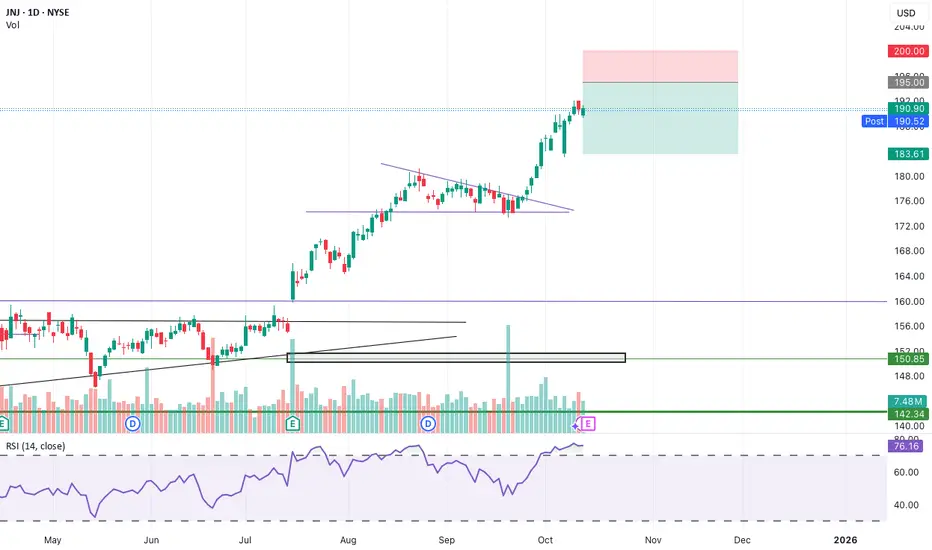
Bear Call Spread on JNJBear Call Spread Sell 195 Call strike and Buy 200 Call Strike, Exp: Nov 28 (45 DTE) for no less than $1.55
Trade has about 67% probability of profit
Taking advantage of high IV rank of 40
Credit received = $155
BP Effect = $345
Max Loss = (5 - 1.55) * 100 = $345
Breakeven = 195 + 1.55 = $196.55
Key facts today
0.55 USD
12.49 B USD
78.89 B USD
About Johnson & Johnson
Sector
Industry
CEO
Joaquin Duato
Website
Headquarters
New Brunswick
Founded
1887
ISIN
ARDEUT110236
FIGI
BBG000FT0KG7
Johnson & Johnson is a holding company, which engages in the research, development, manufacture, and sale of products in the healthcare field. It operates through the Innovative Medicine and MedTech segments. The Innovative Medicine segment focuses on immunology, infectious diseases, neuroscience, oncology, cardiovascular and metabolism, and pulmonary hypertension. The MedTech segment includes a portfolio of products used in the interventional solutions, orthopaedics, surgery, and vision categories. The company was founded by Robert Wood Johnson I, James Wood Johnson, and Edward Mead Johnson Sr. in 1887 and is headquartered in New Brunswick, NJ.
Related stocks
Johnson & Johnson. Clean. Soft. Gentle. Growth.Johnson & Johnson (JNJ) stands out as a bellwether in the global healthcare sector, and its nearly 18% stock performance in 2025 reflects both robust fundamentals and compelling technical trends.
Fundamental Perspective
JNJ maintains a solid financial foundation, underpinned by consistently st
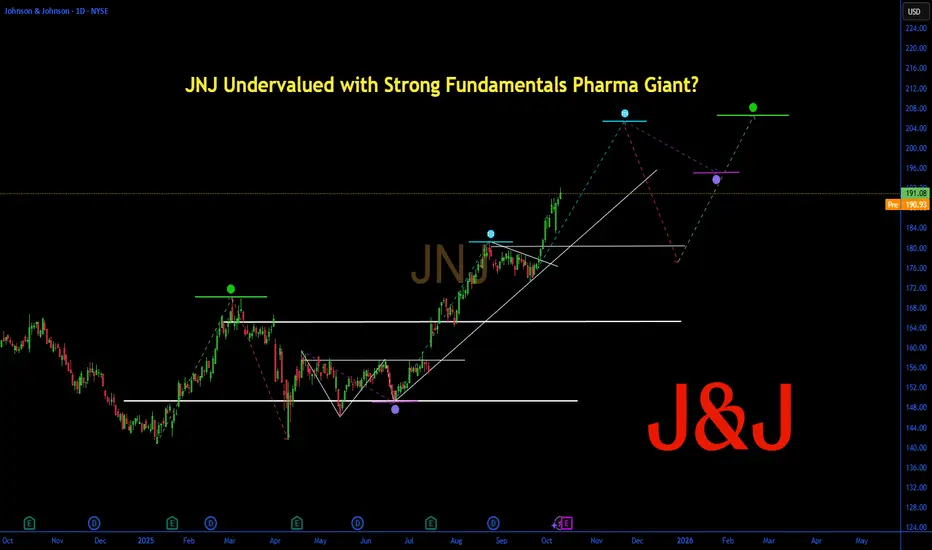
JNJ Undervalued with Strong Fundamentals Pharma Giant?JNJ – Financial Performance & SWOT Analysis
JNJ Undervalued with Strong Fundamentals Pharma Giant?
(1/9)
Good morning, folks! JNJ is steady 📈, at $ 191.08 up 35.31% YTD per October 10, 2025. Q2 revenue shakes up this pharma play , let’s dive in! 📊🔥 Tag a friend who needs this investing hack!
(2
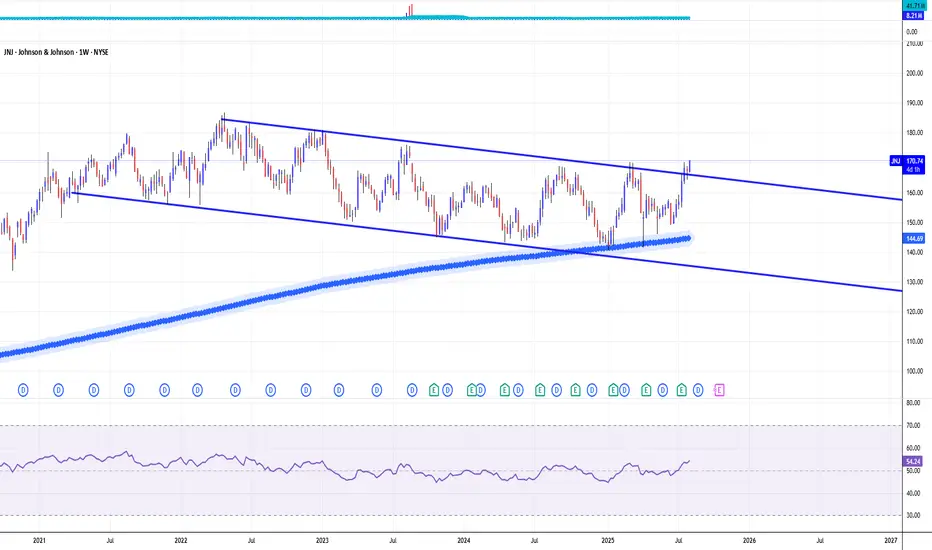
JNJ is unchainedJNJ is unchained
JNJ has spent 4 years moving sideways, which basically means the market agreed this was the fair price f or the stock.
But this August, we saw analysts like Joanne Wuensch from Citi start pointing to the $200 zone , and it looks like she might have been right. 🚀
If you missed
$JNJ Call Alert – Oct 31 ’25 $190 Calls | 144% ROI PotentialEnter: NYSE:JNJ OCT 31 2025 $190 CALLS
Buy in Price: $4.15 - $4.35
Take Profit: $10.13
Stop Bleeding: $3.65
ROI Potential: 144%
Exit Within: 339 Minutes
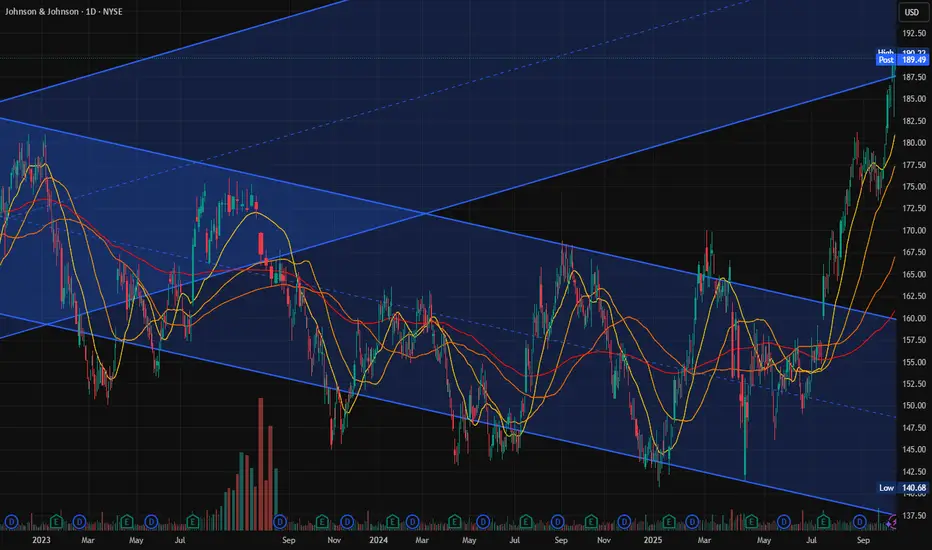
Johnson & Johnson Bulls Break the FlagJohnson & Johnson has been in a strong uptrend, with buyers consistently driving price higher. After the impulsive rally, price consolidated into a downward-sloping flag, where sellers tried to take control but failed to push lower. Buyers then stepped back in, breaking out of the flag with strength

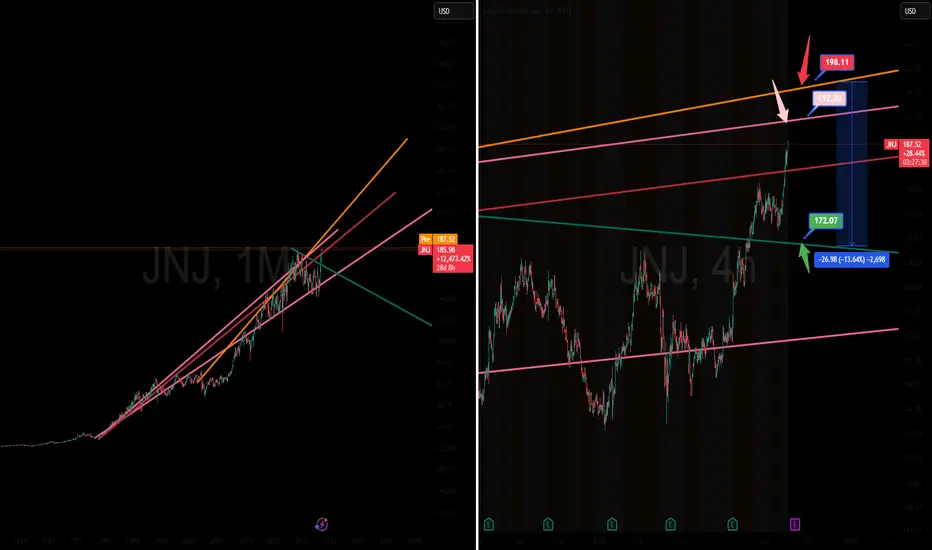
Band-Aids to Blowouts: Shorting J&J's This short trade is based on the idea that JNJ's stock price has extended beyond a long-term upward channel, suggesting a high-probability mean reversion or correction back toward the established trendline. The chart suggests a bearish divergence or a temporary blow-off top scenario. The price has a
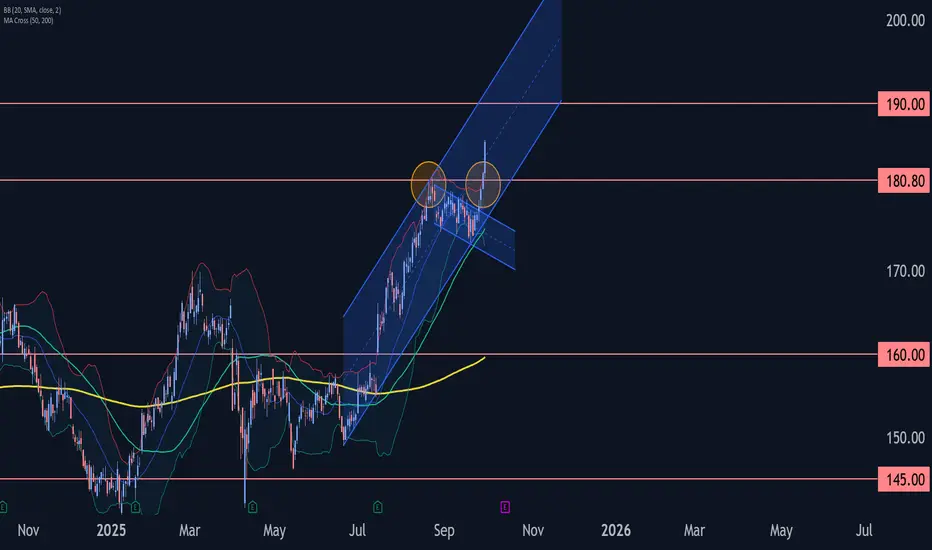
Johnson & Johnson Wave Analysis – 30 September 2025
- Johnson & Johnson broke key resistance level 180.00
- Likely to rise to resistance level 190.00
Johnson & Johnson recently broke sharply above the key resistance level 180.00 (which stopped the previous minor impulse wave 3 at the end of August).
The breakout of the resistance level 180.00 acce
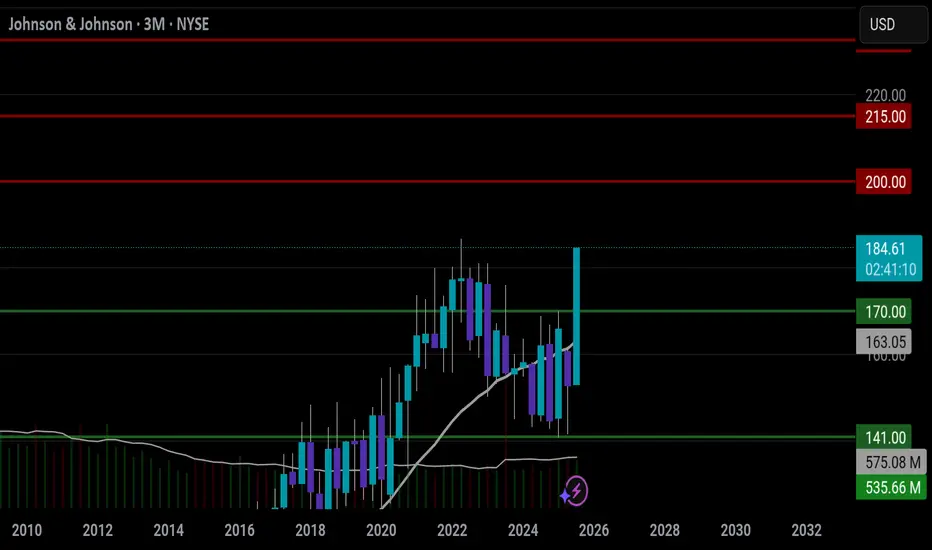
JNJ APPROVEDNYSE:JNJ has recently shown a bullish chart pattern on the 3-month timeframe, which in my view suggests the stock may be aiming for new all-time highs. That makes it, in my opinion, a good stock to hold in a portfolio over the next 2 to 3 months.
This is not financial advice.
JNJ watch $180: Took profits at Serious Resistance that may DIP Caught a PERFECT long now closed (see Idea below)
Now at a serious resistance zone $179.49-180.05
Look for Dip-to-Fib or Break-n-Retest for next move.
.
Previous Analysis that caught the EXACT BREAKOUT:
Hit BOOST and FOLLOW for more such PRECISE and TIMELY charts.
===============================

See all ideas
Summarizing what the indicators are suggesting.
Oscillators
Neutral
SellBuy
Strong sellStrong buy
Strong sellSellNeutralBuyStrong buy
Oscillators
Neutral
SellBuy
Strong sellStrong buy
Strong sellSellNeutralBuyStrong buy
Summary
Neutral
SellBuy
Strong sellStrong buy
Strong sellSellNeutralBuyStrong buy
Summary
Neutral
SellBuy
Strong sellStrong buy
Strong sellSellNeutralBuyStrong buy
Summary
Neutral
SellBuy
Strong sellStrong buy
Strong sellSellNeutralBuyStrong buy
Moving Averages
Neutral
SellBuy
Strong sellStrong buy
Strong sellSellNeutralBuyStrong buy
Moving Averages
Neutral
SellBuy
Strong sellStrong buy
Strong sellSellNeutralBuyStrong buy
Displays a symbol's price movements over previous years to identify recurring trends.
US478160CM4
Johnson & Johnson 3.5% 15-JAN-2048Yield to maturity
5.03%
Maturity date
Jan 15, 2048
JNJJ
Johnson & Johnson 3.75% 03-MAR-2047Yield to maturity
5.02%
Maturity date
Mar 3, 2047
US478160BV5
Johnson & Johnson 3.7% 01-MAR-2046Yield to maturity
5.01%
Maturity date
Mar 1, 2046
US478160CX0
Johnson & Johnson 5.25% 01-JUN-2054Yield to maturity
5.00%
Maturity date
Jun 1, 2054
US478160CS1
Johnson & Johnson 2.25% 01-SEP-2050Yield to maturity
4.99%
Maturity date
Sep 1, 2050
US478160CT9
Johnson & Johnson 2.45% 01-SEP-2060Yield to maturity
4.99%
Maturity date
Sep 1, 2060
JNJ4077469
Johnson & Johnson 4.5% 05-DEC-2043Yield to maturity
4.84%
Maturity date
Dec 5, 2043
US478160BA1
Johnson & Johnson 4.85% 15-MAY-2041Yield to maturity
4.80%
Maturity date
May 15, 2041
US478160CR3
Johnson & Johnson 2.1% 01-SEP-2040Yield to maturity
4.80%
Maturity date
Sep 1, 2040
JNJ.GT
Johnson & Johnson 4.5% 01-SEP-2040Yield to maturity
4.62%
Maturity date
Sep 1, 2040
US478160CL6
Johnson & Johnson 3.4% 15-JAN-2038Yield to maturity
4.57%
Maturity date
Jan 15, 2038
See all JNJD bonds
Curated watchlists where JNJD is featured.


