"LLY's Bear Market Mode ON | Crash Incoming"“ LLY is gearing up for a sharp correction down to the $35–$17 zone — a critical reset that could flush out weak hands before the next explosive bull run. Stay sharp, this is where big opportunities form. ⚠️
🔥 Summary:
Eli Lilly (LLY) looks ready for a major market reset after completing a
Key facts today
0.25 USD
9.41 B USD
40.01 B USD
About Eli Lilly and Company
Sector
Industry
CEO
David A. Ricks
Website
Headquarters
Indianapolis
Founded
1876
ISIN
ARDEUT111192
FIGI
BBG000HFVYP1
Eli Lilly & Co. engages in the discovery, development, manufacture, and sale of pharmaceutical products. The firm's products consist of diabetes, oncology, immunology, neuroscience, and other products and therapies. The company was founded by Eli Lilly in May 1876 and is headquartered in Indianapolis, IN.
Related stocks

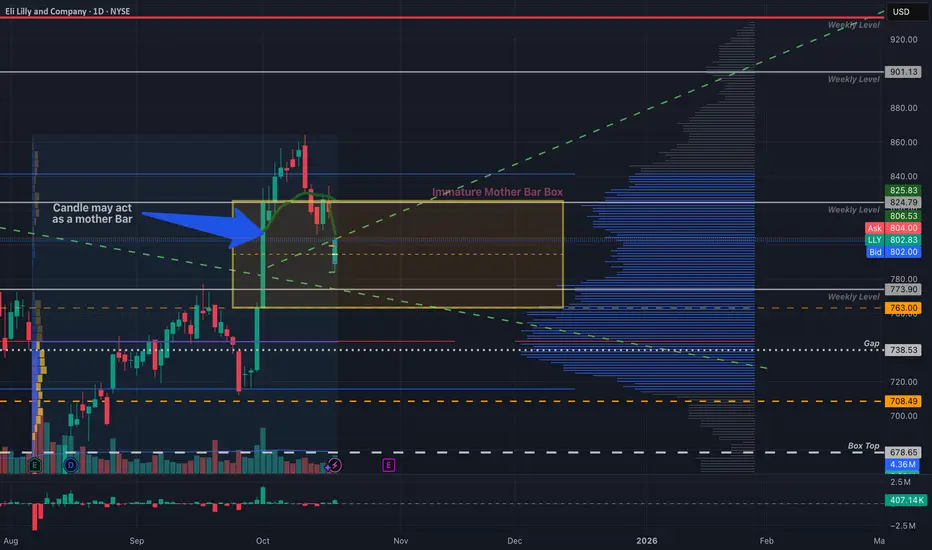
LLY - Beware the MotherbarTaking a closer look at the Eli Lilly chart and noticed that there is a box setup forming on the daily time frame. Specifically this box is the product of a mother bar.
If you take a look the last 4 daily candles have more or less traded within the body of the XXL green candle on the left.
I wou
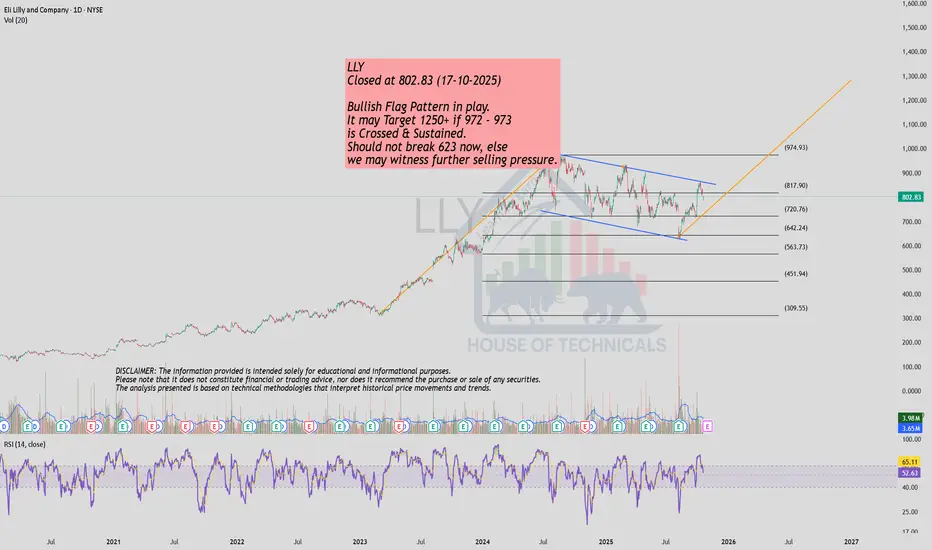
Bullish Flag Pattern!LLY
Closed at 802.83 (17-10-2025)
Bullish Flag Pattern in play.
It may Target 1250+ if 972 - 973
is Crossed & Sustained.
Should not break 623 now, else
we may witness further selling pressure.
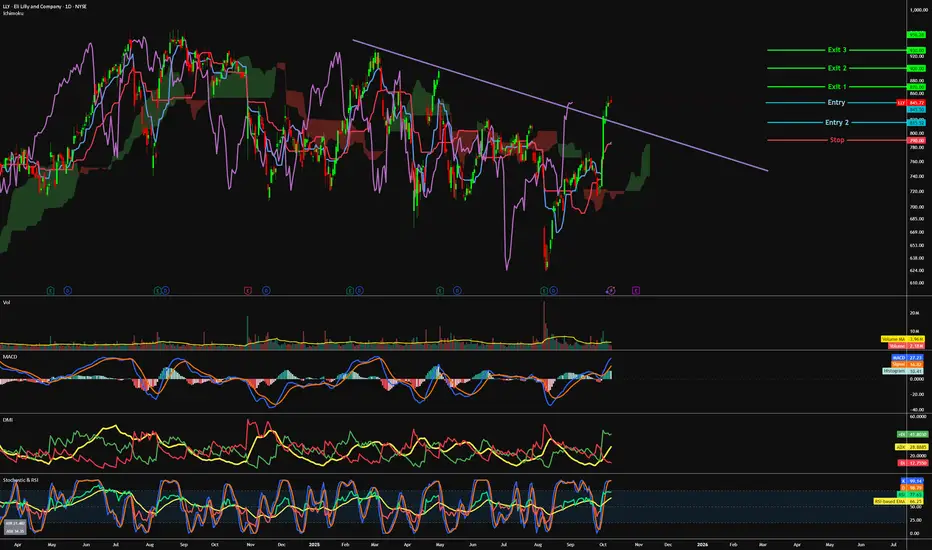
LLY - looking to reach the previous high ?=======
Volume
=======
-slight decreasing volume
==========
Price Action
==========
- Latest downtrend broken
- Change of trend observed
=========
Oscillators
=========
- Ichimoku, price above cloud, green kumo expanding, base + conv + lagging above sign of piercing clouds
- MACD still bullish
$LLY Call Alert – Oct 31 ’25 $850 Calls | 24% ROI PotentialEnter: NYSE:LLY OCT 31 2025 $850 CALLS
Buy in Price: $37.15 - $39.45
Take Profit: $46.07
Stop Bleeding: $32.69
ROI Potential: 24%
Exit Within: 78 Minutes
Red Pill or Blue Pill?Red Pill first - let’s stick to some harsh realities, but using technical analysis only.
Why the harsh crash?
We were rejected at the Value Area high at $972, followed by another rejection at the 0.786 Fibonacci level at $916, along with the top of the flag pattern of this giant bull flag. This wa

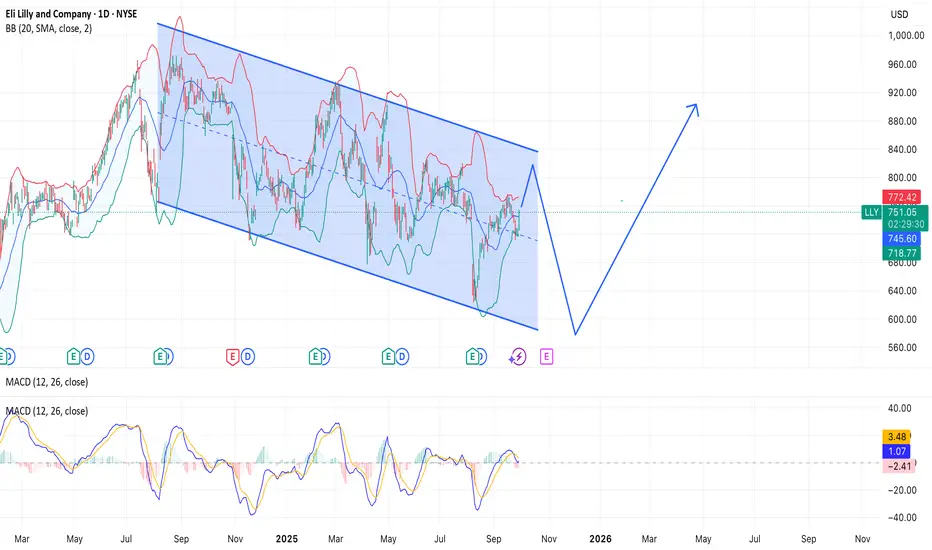
Eli Lilly ($LLY) – Brief AnalysisNYSE:LLY The stock remains in a downward channel (resistance ~772–780 $, support ~720–709 $, key risk level — 680 $).
Current price (~752 $) is around the middle of the channel (Fib 0.5). There’s pressure from the upper boundary.
Entry points:
750–755 $ (aggressive, with retracement risk)
Above
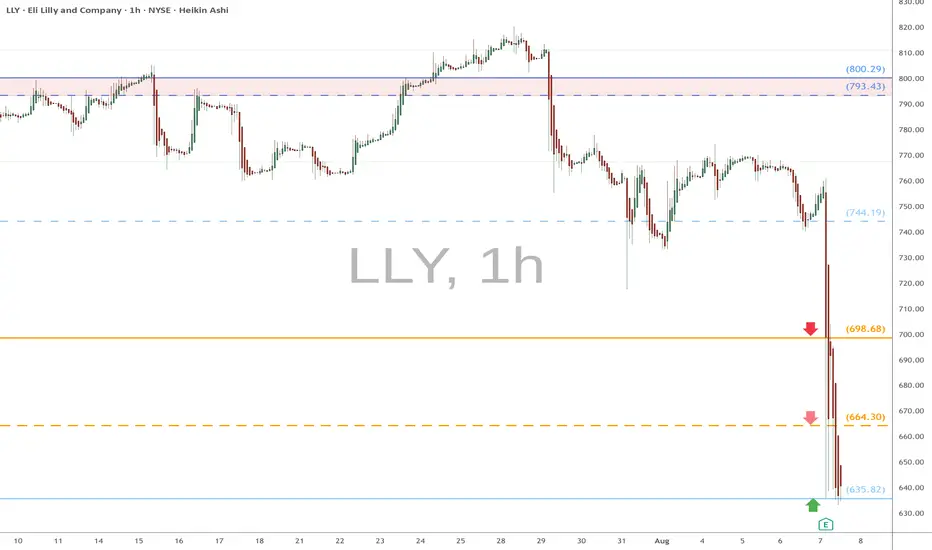
LLY eyes on $635.82: Major fib may hold earnings + news CRASHLLY earnings plus some GLP news tanked the stock.
But the crash came to an abrupt halt at a Genesis fib.
Look for a bounce but expect bears at the Golden's above.
Healthcare Heat check — $LLY (weekly) momentum brewing NYSE:LLY is showing a clean contracting wedged on the weekly chart and currently printing a big green week. Looks like a breakout attempt into real momentum. Long-term trend intact with price set comfortably above 200 SMA.
Healthcare looks like it’s getting rotation & leadership again with names

ELI LILLY COMPANY - STOCK REPORTExecutive Summary
Eli Lilly and Company (LLY) has delivered strong revenue and profit growth driven by blockbuster GLP‑1 therapies (Mounjaro, Zepbound) and continued pipeline progress in oncology and cardiometabolic indications. As of 26 Sep 2025 the company shows robust margins, strong free cash
See all ideas
Summarizing what the indicators are suggesting.
Oscillators
Neutral
SellBuy
Strong sellStrong buy
Strong sellSellNeutralBuyStrong buy
Oscillators
Neutral
SellBuy
Strong sellStrong buy
Strong sellSellNeutralBuyStrong buy
Summary
Neutral
SellBuy
Strong sellStrong buy
Strong sellSellNeutralBuyStrong buy
Summary
Neutral
SellBuy
Strong sellStrong buy
Strong sellSellNeutralBuyStrong buy
Summary
Neutral
SellBuy
Strong sellStrong buy
Strong sellSellNeutralBuyStrong buy
Moving Averages
Neutral
SellBuy
Strong sellStrong buy
Strong sellSellNeutralBuyStrong buy
Moving Averages
Neutral
SellBuy
Strong sellStrong buy
Strong sellSellNeutralBuyStrong buy
Displays a symbol's price movements over previous years to identify recurring trends.
LLY4099975
Eli Lilly and Company 4.65% 15-JUN-2044Yield to maturity
5.65%
Maturity date
Jun 15, 2044
XS238628644
Eli Lilly and Company 1.625% 14-SEP-2043Yield to maturity
5.51%
Maturity date
Sep 14, 2043
LLY6003397
Eli Lilly and Company 5.6% 12-FEB-2065Yield to maturity
5.28%
Maturity date
Feb 12, 2065
LLY6153503
Eli Lilly and Company 5.65% 15-OCT-2065Yield to maturity
5.27%
Maturity date
Oct 15, 2065
LLY5547405
Eli Lilly and Company 4.95% 27-FEB-2063Yield to maturity
5.27%
Maturity date
Feb 27, 2063
LLY5750032
Eli Lilly and Company 5.1% 09-FEB-2064Yield to maturity
5.26%
Maturity date
Feb 9, 2064
LLY5871804
Eli Lilly and Company 5.2% 14-AUG-2064Yield to maturity
5.24%
Maturity date
Aug 14, 2064
LLY4800407
Eli Lilly and Company 4.15% 15-MAR-2059Yield to maturity
5.24%
Maturity date
Mar 15, 2059
LLY5871803
Eli Lilly and Company 5.05% 14-AUG-2054Yield to maturity
5.18%
Maturity date
Aug 14, 2054
LLY6153502
Eli Lilly and Company 5.55% 15-OCT-2055Yield to maturity
5.18%
Maturity date
Oct 15, 2055
LLY5750031
Eli Lilly and Company 5.0% 09-FEB-2054Yield to maturity
5.18%
Maturity date
Feb 9, 2054
See all LLYD bonds


