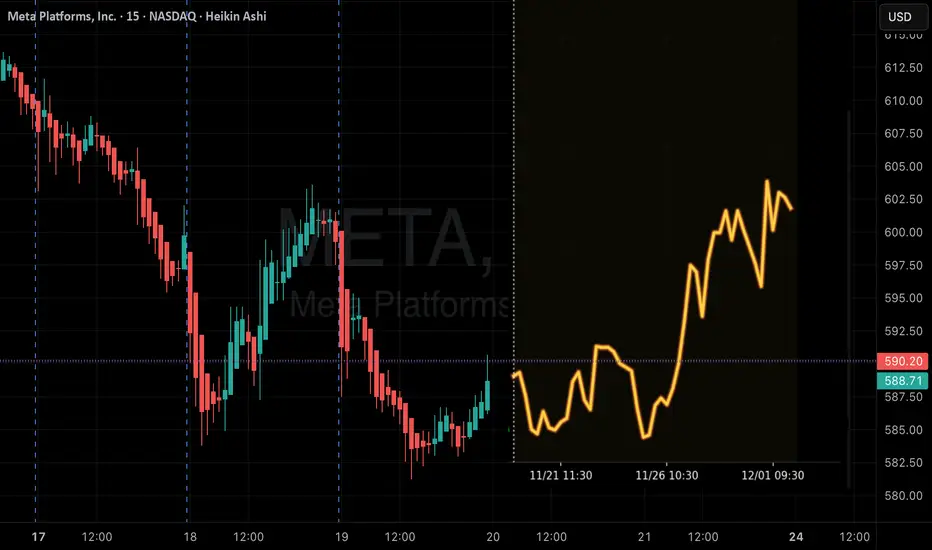
META now close to a critical trendlineMETA is approaching a significant technical region.
The trendline currently in focus originated on 31 October 2022, and it has remained relevant over time.
This same trendline was retested twice in April of this year, and price action is once again moving toward it after achieving a new all-time
Key facts today
0.75 USD
55.39 B USD
146.11 B USD
About Meta Platforms, Inc.
Sector
Industry
CEO
Mark Elliot Zuckerberg
Website
Headquarters
Menlo Park
Founded
2004
ISIN
ARBCOM460168
Meta Platforms, Inc. engages in the development of social media applications. It builds technology that helps people connect and share, find communities, and grow businesses. It operates through the Family of Apps (FoA) and Reality Labs (RL) segments. The FoA segment consists of Facebook, Instagram, Messenger, WhatsApp, and other services. The RL segment includes augmented, mixed and virtual reality related consumer hardware, software, and content. The company was founded by Mark Elliot Zuckerberg, Dustin Moskovitz, Chris R. Hughes, Andrew McCollum, and Eduardo P. Saverin on February 4, 2004, and is headquartered in Menlo Park, CA.
Related stocks

Patience pays off? Long METAI've been patient with META. I've been wanting to go long here since earnings, but I also wanted to see if we'd get closer to the lower trendline. Luckily I waited. But I'm at a point I don't want to wait longer to start my position/trade.
The reasons:
1. That lower trendline has held since October

$META, rejection below $600, not perfect, nor a game changerNASDAQ:META
I remain heavily short.
The rejection below $600 wasn't ideal, but it's not the end of the world either.
For now, odds still favor we will lose $600 support in the coming weeks.

META – Structurally Oversold With a Completed Falling WedgeMETA – Structurally Oversold With a Completed Falling Wedge: Watching for a Counter-Trend ABC Recovery
META continues to trade under significant downside pressure, but the short-term structure is becoming increasingly constructive. Price action has carved out a well-defined falling wedge, accompani

Meta Wins Major Antitrust Battle as Stock Remains Bullish Meta scored a major legal victory after a federal judge ruled that it is not an illegal monopoly, rejecting the Federal Trade Commission’s argument that the company should be forced to divest Instagram and WhatsApp. The FTC had claimed that Meta acquired both platforms to eliminate potential rivals,

$META: at the 100 WMANASDAQ:META : I believe April 2025 low started a new 5-wave sequence for $META. Wave 1-2 completed. Wave 1 of 3 completed and it's in Wave 2 of 3 correction.
Wave 2 can retrace very deep. It has already retraced 61.8% of Wave 1. There is also a trendline support formed by connecting 2022 low with

QuantSignals V3 | META Counter-Trend CALL SetupMETA QuantSignals V3 – Swing CALL Trade (2025-11-19)
Trade Signal:
Direction: BUY CALLS (Long)
Strike Price: $550.00
Entry Range: $40.80–$41.20 (mid $41.00)
Target 1: $61.20 (50% gain)
Target 2: $71.40 (75% gain)
Stop Loss: $32.64 (20% risk)
Expiry: 2025-12-05 (16 days)
Position Size: 3% of
META: The Reversal Zone | Short term Swing Long Trade PlanThe chart shows the price has fallen sharply and is currently testing a zone where three significant technical features converge:
Long-Term Trend Line (Yellow): The price has fallen back to the long-term ascending yellow trend line. This line represents the primary bullish trend established since t

ESG & Green Energy Investments1. What ESG Actually Means
ESG refers to a set of standards for evaluating how responsibly and sustainably a company operates. These three dimensions—Environmental, Social, and Governance—serve as a framework to understand non-financial risks that can influence long-term performance.
Environmental

Death Cross - Contrarian BuyRarely does the death cross actually provide a meaningful sell signal given its lagging components and, in some cases, can end up being a better buy signal. I think this is one of those times where META death cross is providing another meaningful buy signal as the price is well below the 200-day mov

See all ideas
Summarizing what the indicators are suggesting.
Oscillators
Neutral
SellBuy
Strong sellStrong buy
Strong sellSellNeutralBuyStrong buy
Oscillators
Neutral
SellBuy
Strong sellStrong buy
Strong sellSellNeutralBuyStrong buy
Summary
Neutral
SellBuy
Strong sellStrong buy
Strong sellSellNeutralBuyStrong buy
Summary
Neutral
SellBuy
Strong sellStrong buy
Strong sellSellNeutralBuyStrong buy
Summary
Neutral
SellBuy
Strong sellStrong buy
Strong sellSellNeutralBuyStrong buy
Moving Averages
Neutral
SellBuy
Strong sellStrong buy
Strong sellSellNeutralBuyStrong buy
Moving Averages
Neutral
SellBuy
Strong sellStrong buy
Strong sellSellNeutralBuyStrong buy
US30303M8D7
Meta Platforms, Inc. 3.85% 15-AUG-2032Yield to maturity
14.67%
Maturity date
Aug 15, 2032
FB5458295
Meta Platforms, Inc. 4.65% 15-AUG-2062Yield to maturity
5.87%
Maturity date
Aug 15, 2062
FB5868810
Meta Platforms, Inc. 5.55% 15-AUG-2064Yield to maturity
5.80%
Maturity date
Aug 15, 2064
FB6221365
Meta Platforms, Inc. 5.75% 15-NOV-2065Yield to maturity
5.79%
Maturity date
Nov 15, 2065
FB5581331
Meta Platforms, Inc. 5.75% 15-MAY-2063Yield to maturity
5.76%
Maturity date
May 15, 2063
FB5522241
Meta Platforms, Inc. 4.65% 15-AUG-2062Yield to maturity
5.73%
Maturity date
Aug 15, 2062
FB5581330
Meta Platforms, Inc. 5.6% 15-MAY-2053Yield to maturity
5.66%
Maturity date
May 15, 2053
FB5868809
Meta Platforms, Inc. 5.4% 15-AUG-2054Yield to maturity
5.66%
Maturity date
Aug 15, 2054
FB6221364
Meta Platforms, Inc. 5.625% 15-NOV-2055Yield to maturity
5.65%
Maturity date
Nov 15, 2055
FB5522214
Meta Platforms, Inc. 4.45% 15-AUG-2052Yield to maturity
5.64%
Maturity date
Aug 15, 2052
FB6221369
Meta Platforms, Inc. 5.5% 15-NOV-2045Yield to maturity
5.54%
Maturity date
Nov 15, 2045
See all METAC bonds
Curated watchlists where METAC is featured.


