Newmont Corporation Shs Cert Deposito Arg Repr 0.333333 Sh
No trades
Trade ideas

NEMGold and miners have taken a beating in this fake and manipulated market. This has been a hard trade for the gold bulls but in the end game gold I think will win. We see Ichan and Soros taking longs in this sector and physical and thus with the manipulated market I think these will move higher. I have placed a stop at bottom of gap and that is about 3.00 risk so need a 6:++ move to get 2:1 but with long term good potential here


Watch FREE CASH FLOW to understand underlying valuationHere's what investors and traders routinely miss: Free cash flow yield.
What is free cash flow? It is what is truly left over from running a business. If you purchased a business and then held it for yourself to reap the benefits, then you'd want to understand free cash flow. Search for it online to understand the nuances. A main element is that you add back in the depreciation, which is a non-cash charge, to earnings.
Since the market is an M&A (Mergers and Acquisitions) supported market, then you want to look at the market the same way that M&A investors do and they look at Free Cash Flow Yields. Why? Because FCF is what enables you to pay off debt if you own the company outright.
Keep in mind too that data isn't published until well after quarter-end, so you do need to pay attention to EARNINGS REPORT dates. This is an important reason why you need to know what price a stock was when it reported earnings, because that is when investors learn the new data point on free cash flow.
Long live logic and rational thinking.
Tim
9:50AM EST 3/28/2016 NEM 25.43 last.
Oh - buy NEM down at $21 if possible, because I think that is an attractive free cash flow yield; $700 million on 1.3 times sales on 7.7Billion = or 7.7% and exit at 6% FCF Yield.

NEM - 2hrPicked up a tranche of NEM (gold miner) this morning at 24.89. Don't know if she'll see the .50 retrace at 21.89. Tight stop would be 20.36, but I'll give her the benefit of the doubt for now and manage stop manually.


NEWMONT MINING: LONGNEM is a stock I bought recently that has seen some nice gains. For fundamental reasons this stock has looked very attractive for a long time. I recent bought as technicals finally confirmed what my fundamental analysis was telling me.
You can see price broke out from channel, but found a bottom around 16.00. From there we broke short term down trend line, and broke back into the voided channel.
Price came through 100 period moving average, and is coming towards 20.00 area resistance. This level also intersects with 200 period moving average.
After a break of $20 looking for price to head to $27. Plan to be in this trade for a long haul, with a long term target well above current price.


NEM - all that glitters?Re-test and confirmation of the key $27 price point is suggestive of further upside on a break over Fridays high. Buying was accompanied by reasonable volume and the price closed near the high of the session. The stock is sitting above all key moving averages


Automatic markup of Elliott waves.Sometimes, it is useful. Here we see all five waves of the bearish trend.
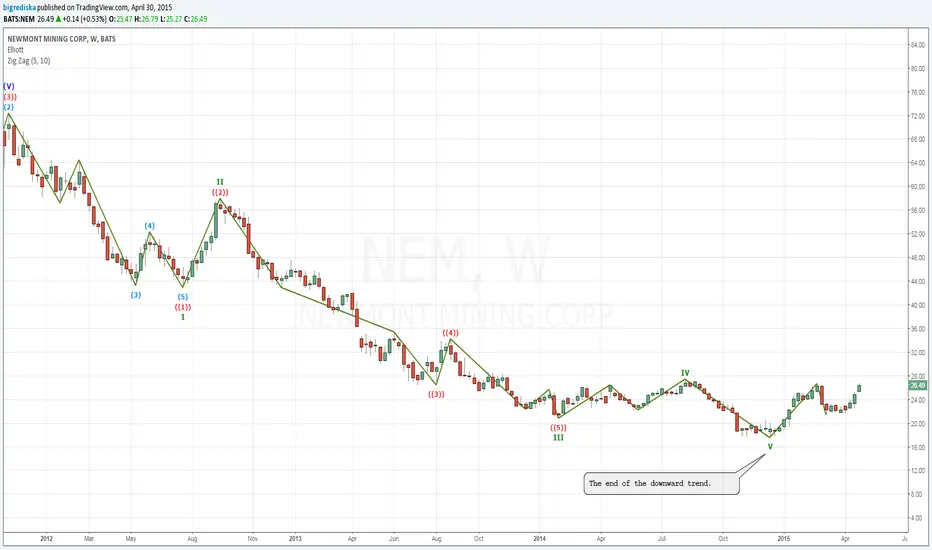


WE STILL HAVE TO WAIT A BIT 2.It seems that this share is amenable to prediction. Published 8 days ago.


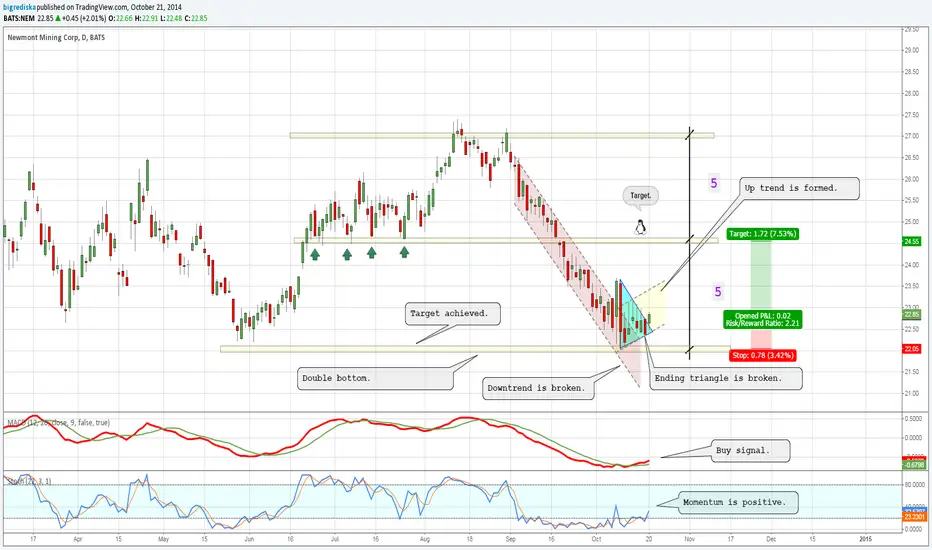
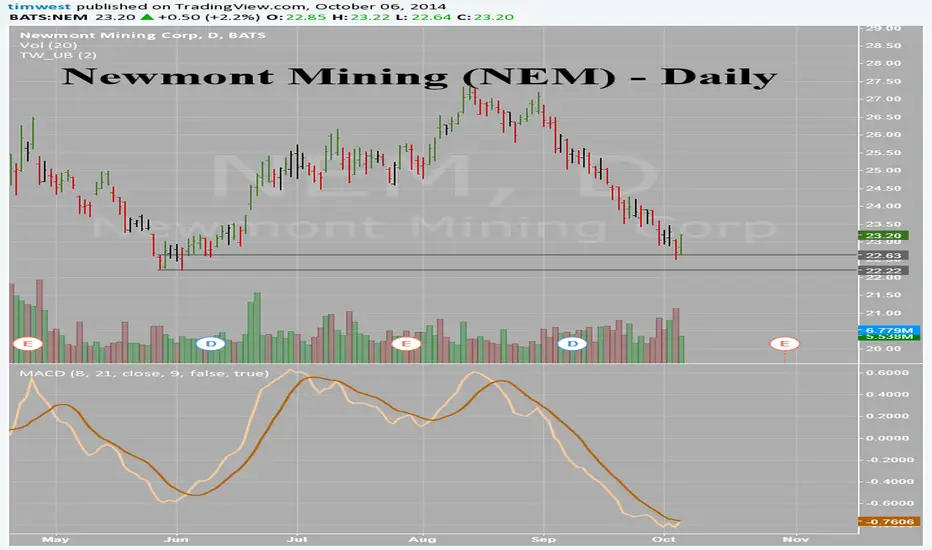
Newmont Mining -NEM -Daily Weekly Monthly Trying to Turn Up (2)Massive level of shorter-term, medium-term (weekly) and long-long-term support (monthly).
MACD is turning up.
Gold flushed down through 1200 last week and turned back up this week, perhaps worthy of a rally from here.
Buy some steadily through the next week. Then hold for a 3 range rally with a 3 range stop.
Tim 3:55PM EST 10/6/2014 23.21 last +0.50 (+2.2%)
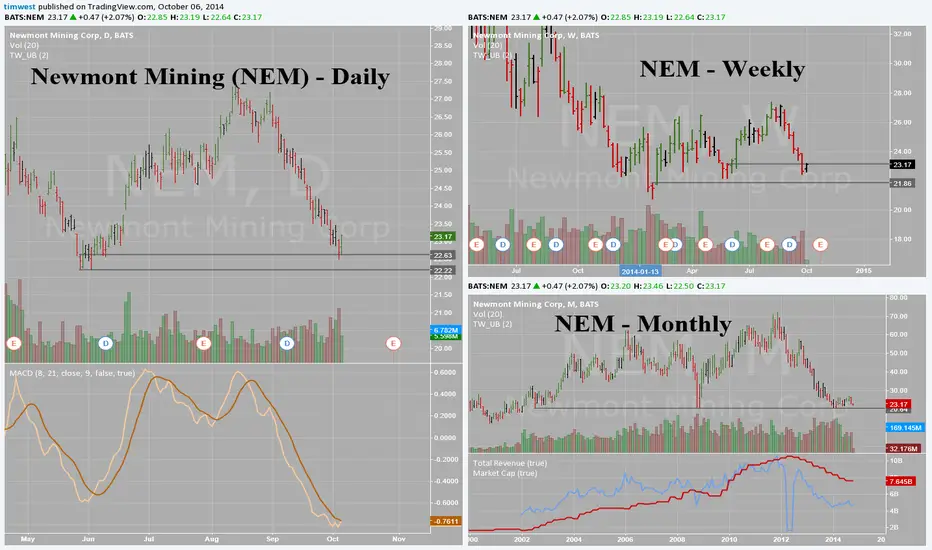
Newmont Mining - NEM - Daily-Weekly-Monthly Trying to Turn UpMassive level of shorter-term, medium-term (weekly) and long-long-term support (monthly).
MACD is turning up.
Gold flushed down through 1200 last week and turned back up this week, perhaps worthy of a rally from here.
Buy some steadily through the next week. Then hold for a 3 range rally with a 3 range stop.
Tim 3:55PM EST 10/6/2014 23.21 last +0.50 (+2.2%)
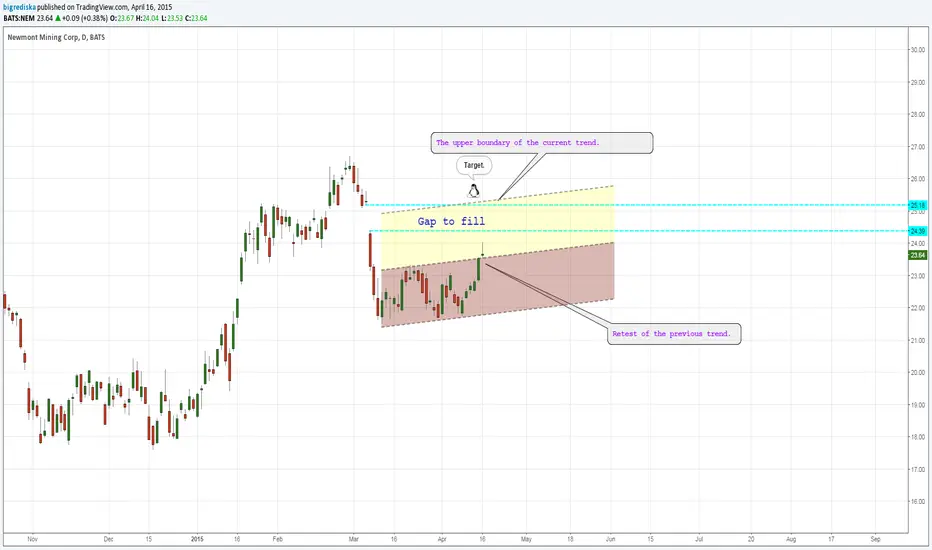
Mining A Profitable Trade, Newmont Mining Corp (NYSE:NEM)Yesterday, Newmont Mining Corp (NYSE:NEM) filled an important gap on the charts, and came into an important trend line of support. As of late gold prices have been falling dramatically, dragging miners down with it. However, the metal as well as many of the leading miners, including Newmont Mining Corp (NYSE:NEM) are starting to set up for possible short term bottoms.
Traders and investors looking to mine profits in Newmont Mining Corp (NYSE:NEM) can go long (buy for a move higher) this equity here, while using confirmation below the rising trend line as a stop loss level. Should Newmont Mining Corp (NYSE:NEM) move up as the charts indicate, profits should be taken around the following levels; the first level of resistance at $25.00 is where you can take profits of half of your positions, and second and major level to take all profits off the table will be $25.89. The best strategy is to place a break-even stop on the trade once you reach the first target and allow the second half to run to your second target. Doing so will allow you to stay in the trade with ease, as you wait for the second target to be achieved, and it won't turn into a losing trade.
If you only read one email again, make sure it comes from the Elite Round Table. Our FREE market emails contain information that can actually make you money. Ask yourself, what email have you read that can do that? Answer = none. Join our list here.
Kiliam Lopez
Elite Round Table
Follow me on twitter @kiliamlopez

NEM. potential rebound.Multiple rejection trend_line. 200 sma support.
KoD like formation. Potential Reversal.
Right shoulder formation ?
Target_1 : 26.17

NEM and the Gold SectorYou will see this base across many gold related stocks including the miners. Looking for a continued move higher out of the base. Will most likely use the daily stochastics to time exit. If we cross back down on the daily stochs I am out . also Like the GLD, and holding GLD
