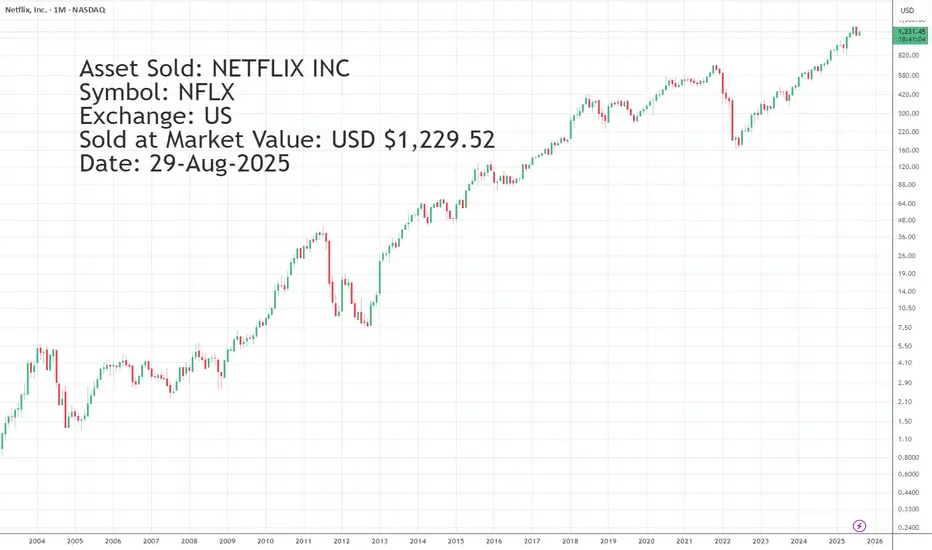
Asset Sold: NETFLIX INC Symbol: NFLX Exchange: US Sold at MarketAsset Sold: NETFLIX
Symbol: NFLX
Exchange: US
Sold at Market Value: USD $1,229.52
Date: 29-Aug-2025
NFLX trade ideas
K-Pop: Demon Hunters to Drive Netflix Higher?The recent success of global hits like K-Pop: Demon Hunters and strong fundamentals give the stock a tailwind, and technically, the corrective and consolidative phase appears to be maturing.
Netflix is consolidating between $1198 and $1243, after rebounding from the $1,144 support level, which has proven to be a strong floor following the sharp correction from the $1341 high.
Price is currently trading under the 50% Fibonacci retracement of the last down leg. The structure suggests that the market is in a decision phase.
The RSI on the 4H timeframe is stabilizing in mid-range territory.
If the price continues to hold above $1198, this keeps the bias bullish.
A breakout above $1243 would likely trigger a move and possible retest of the prior high near $1341.
In my view, the most probable scenario is a move higher as long as the support holds.
My projection is for a period of consolidation, followed by a breakout toward $1340 in the coming weeks, provided $1198 is not broken.

$NFLX Free Trade Idea | @iCurlyCaeDisclaimer: I am not a financial advisor and this is, in no way, financial or trading advice. I am simply sharing options trading strategies that I use, and have been successful with in the stock market. This presentation is for entertainment and educational purposes only. There are significant financial risks involved with trading and I am not responsible for your losses in the market should you decide to utilize the information and/or strategies discussed within this presentation. By choosing to proceed you are acknowledging your understanding of this disclaimer.
#TheStrat

Netflix (NFLX): Ready for a Climb After Healthy Dip
Healthy Pullback & Key Support: After a strong rally, Netflix experienced a normal dip. This pullback found solid support precisely at the 38.2% Fibonacci retracement level, showing it was a healthy correction and not a trend reversal.
Signs of Strength: Following that key support, the stock started to climb again, forming a 'higher low.' This is a good sign that buyers are back in control and the price is likely to keep rising.
Clear Price Targets: We're looking for the stock to first reach 1270, and if it keeps going, a second target is set at 1322.
Managing Risk: To protect against a drop, we'd exit the trade if the price falls below 1193.
Disclaimer:
The information provided in this chart is for educational and informational purposes only and should not be considered as investment advice. Trading and investing involve substantial risk and are not suitable for every investor. You should carefully consider your financial situation and consult with a financial advisor before making any investment decisions. The creator of this chart does not guarantee any specific outcome or profit and is not responsible for any losses incurred as a result of using this information. Past performance is not indicative of future results. Use this information at your own risk. This chart has been created for my own improvement in Trading and Investment Analysis. Please do your own analysis before any investments.

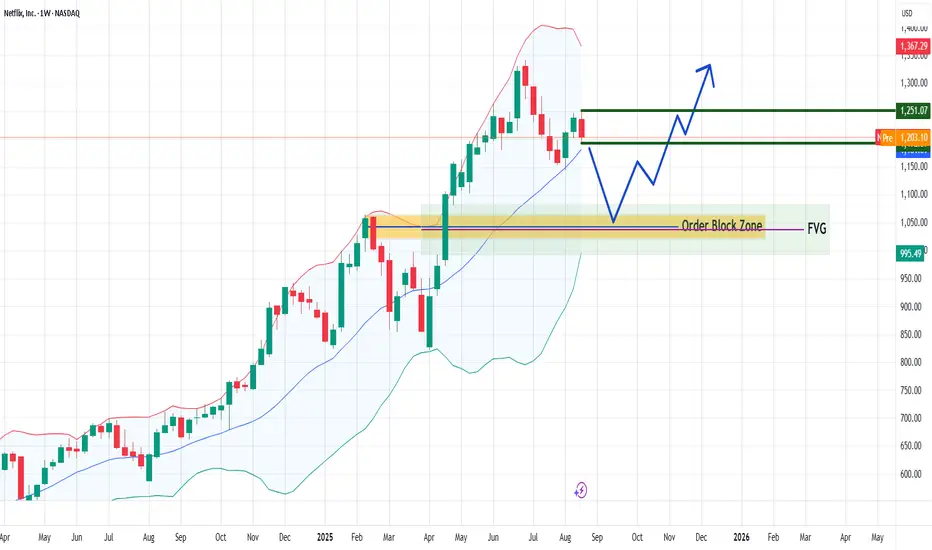
#NFLX - Weekly Timeframe#NFLX
The middle line of the Bollinger Band has provided strong support for a recent bounce. However, there remains a significant chance of a deeper retracement toward the lower band, which aligns with the Weekly Order Block and Fair Value Gap cluster. This bearish outlook would be invalidated if a daily candle closes above the latest weekly high, in which case the upward trend is more likely to continue unfolding.
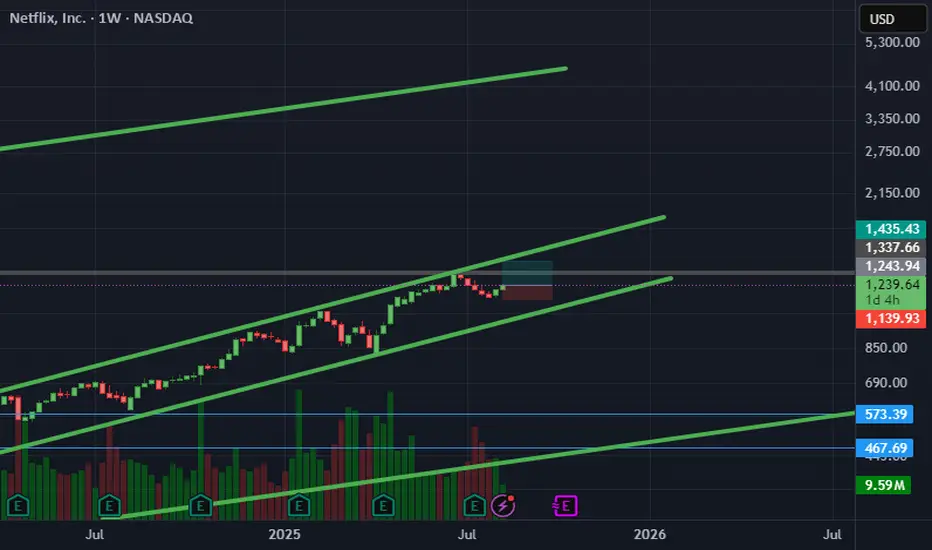
NFLX - a wild ride - hold on tight??This longer term EW count would suggest that we may be looking for a 4th wave correction in this stock in the shorter term while still expecting some decent upside going forward. I have used logarithmic scales for fib measurements.

Netflix Mini Pullback into LongNetflix can be setting up for a potential ABC correction, into the 1-1 extension on tech sector weakness and potential profit taking.
I am watching this stock for a potential buy zone at the lower end of the target, which would be a nice place for a longer term s/r structural flip for further continuation.

Netflix future moves on one hour frame based on my analysis on geometry trading here is how I see Netflix will do in the near future on one hour time frame
thanks

New Setup : NFLXThe current pullback should be over after the most recend crossover.
We are ready to catch both actions, but right now the bullish scenario is more plausible.
Ready !

(Netflix, Inc. – 2H timeframe, NASDAQ)(Netflix, Inc. – 2H timeframe, NASDAQ),
Current price: ~1245 USD
Breakout zone: 1240–1245 USD (holding above support now)
First target: ~1292 USD
Second target: ~1340 USD
📈 So, my chart suggests:
Immediate target: 1290–1295 USD
Extended target: 1340 USD if momentum continues

NFLX is coasting right into the earnings drop zoneI'm taking a chill pill and watching to see what price will do at this area. This is where the post earning drop happened. Are we strengthening to ride higher or nah?
Neutral eye looking for bearish setups myself. What about you?

NFLXNot looking good in my opinion its already breakdown the trendline. Also we have support below this trendline maybe it gonna retest it and bounce again.
Netflix Bullish StanceBreaking above the $1,200 psychological level
Strong earnings growth (47% YoY for Q2)
Technical indicators supporting the bullish stance (Alligator, Stochastic crossover, pSAR)
Key Fibonacci levels providing support and resistance targets
Positive volume pattern suggesting accumulation

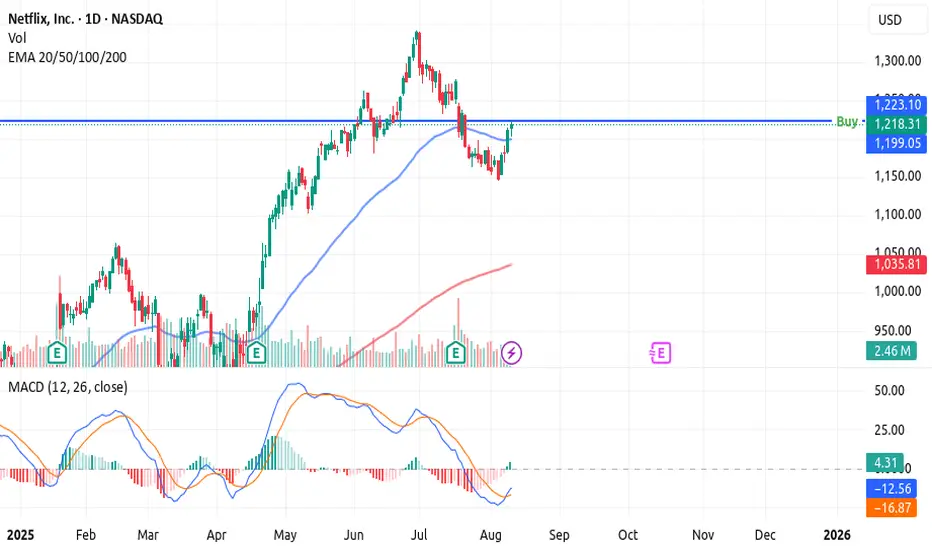
This is A 3 Month Move Using This 3-Step StrategyThis is a 3 month move that you need to prepare for.
But you have to remember something.
Volatility is a must.
Even if you try to be as accurate as possible.
Yes i know you want to make money the safe way which is okay.
But you have to account for risk.
This is why risk management is very important when it
comes to trading the financial markets.
In this chart you will notice the MACD indicator.
This indicator is used for long term trading.
How? By using the rocket booster strategy
which has the following steps:
1-The price has to be above the 50 EMA
2-The price has to be above the 200 EMA
3-The price should have a catalyst
In this case the catalyst is the earnings report
which is due in about 3months from this entry.
This means that this is a 3 month trading strategy.
In order to learn more rocket boost this content right now.
Disclaimer:Trading is risky please learn risk management
and profit taking strategies.Also feel free to use a simulation
trading account before you trade with real money.
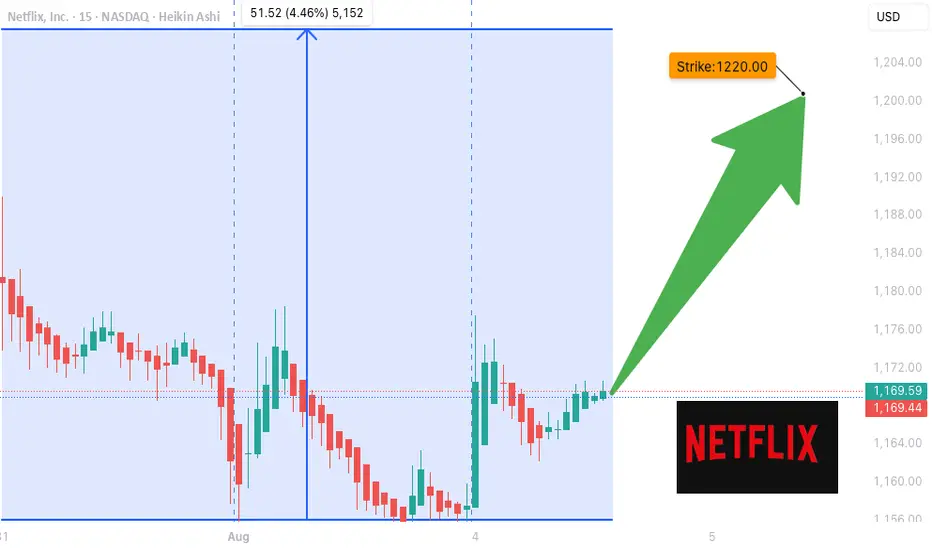
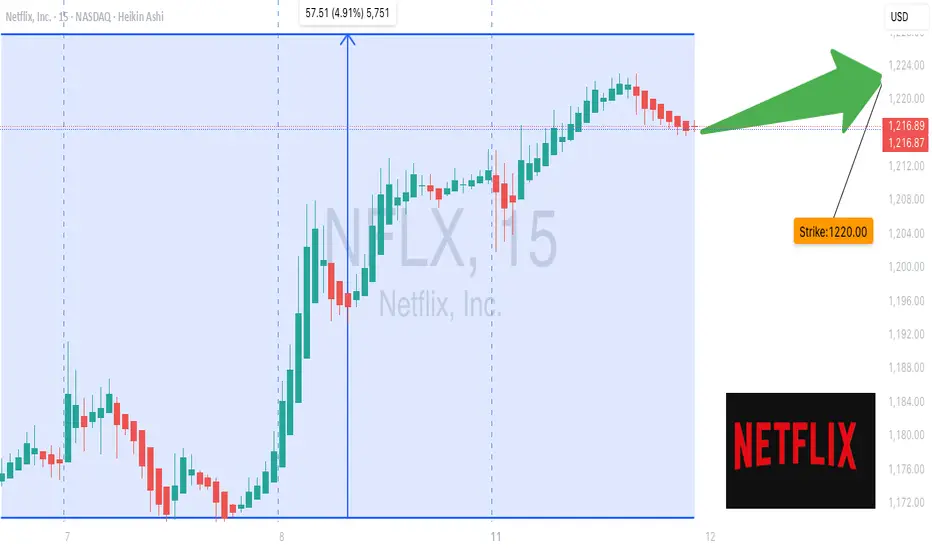
NFLX Weekly Bullish Play – $1220 Calls Poised for a 50% Pop!
🚀 **NFLX WEEKLY TRADE IDEA – AUG 11, 2025** 🚀
**Sentiment:** 📈 *Moderate Weekly Bullish* – Rising Daily & Weekly RSI + Favorable VIX setup.
**Caution:** Weak institutional volume → Watch for false breakouts.
💡 **Trade Setup**:
* **Direction:** CALL (Long)
* **Strike:** \$1220
* **Expiry:** Aug 15, 2025
* **Entry:** \$12.50 or better
* **Profit Target:** \$18.75 (+50%)
* **Stop Loss:** \$6.25 (-50%)
* **Confidence:** 70%
* **Reason:** Multiple AI models agree on upside momentum despite volume weakness.
⚠️ **Risks**:
* 4DTE → High theta decay risk.
* Low volume may slow momentum.
📊 **All 5 Models Agree:**
* RSI climbing on daily & weekly.
* Favorable volatility conditions.
* Call option plays dominate.
---
🔥 *Plan your entries, respect your stops.*
📌 **#NFLX #OptionsTrading #SwingTrade #StockMarket**
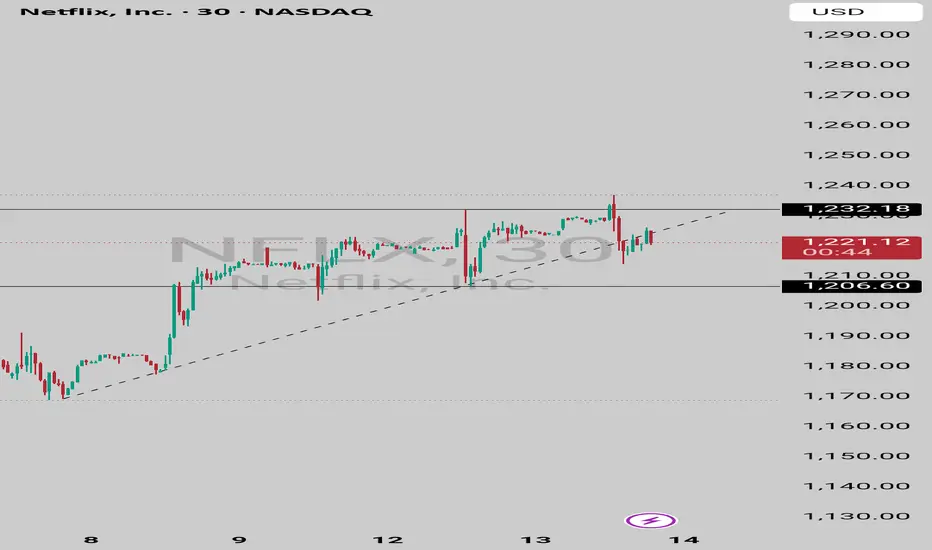
NFLX LongBroader Market Structure (NFLX 15M):
NFLX transitioned from a clear downtrend marked by consistent lower highs and lower lows into a bullish structure after a Change of Character (CHoCH) at $1168.81. This shift was reinforced by a strong rally producing consecutive higher highs and higher lows, confirming that buyers have taken control. The recent structural breaks point toward continuation to the upside unless the most recent higher low is taken out.
Supply and Demand Analysis:
The supply zone between $1232–1240 has previously caused a sharp sell-off, showing that sellers were aggressive here, making it a strong resistance to watch. The demand zone around $1192–1200 is fresh and untested, formed after buyers stepped in with strength during the latest rally, suggesting it could serve as a solid support if retested. Lower demand levels between $1155–1165 and $1144–1148 were key springboard zones during the reversal and remain secondary supports if deeper retracements occur.
Price Action Within Marked Region:
Price is currently pushing toward the supply zone, showing strong bullish candles with minimal wicks, suggesting momentum is with buyers. The projection on the chart indicates a possible pullback into $1192–1200 before attempting a break into the $1232–1240 supply. This aligns with healthy bullish structure behavior—retracing to demand before continuation.
Current Trade Bias & Outlook:
The bias is bullish, with an expected short-term pullback followed by a continuation toward the upper supply zone. The invalidation level for this outlook would be a break and close below $1190, which would compromise the most recent higher low and weaken bullish conviction.
Momentum & Candlestick Behavior:
Momentum clearly favors buyers, with impulsive upward moves and shallow pullbacks. No signs of exhaustion or major reversal patterns have formed yet, supporting the continuation scenario.

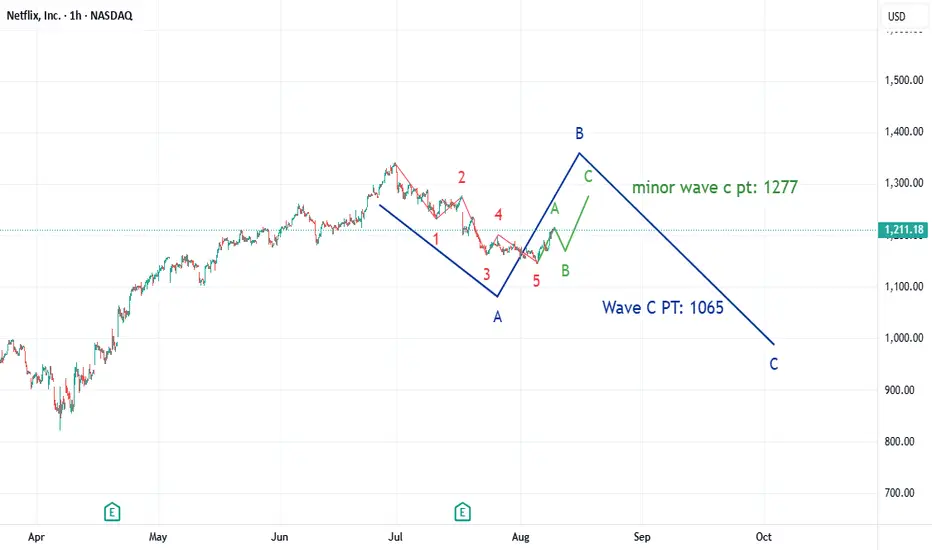
NFLX: ABC CorrectionNFLX is forming an abc corrective wave into a larger Wave B structure. Expecting a retracement to as low as $1170 for minor wave b, then a launch up to $1277 for a gap fill. From there, we should see 5 waves down to Feb 18 high of $1065
NFLX CRACK!!Classic breakdown move from a rising F flag!
Massive Head and shoulders formed, that head test followed through, taking out stops, and now failing off the top of the channel.
Screaming CAUTION to the bulls!
Nice simple short setup for bears.
Click boost, follow, and subscribe. Let's get to 5,000 followers. ))

NFLX Correction setting the stage for a bigger moveNFLX is still in a correction, but the long-term uptrend remains intact. There are two scenarios for how this pullback could end: either it stabilizes around 1150 and starts to turn higher from here, or it dips closer to the stronger support near 1050 before reversing. In both cases, the uptrend toward 1500 stays in play as long as price holds above 1000.

On Watch NetflixThe hourly sees a new bullish ATR Break, while attempting to create a bullish crossover.
On The daily, while the scenario is still bearish on the very short term, the ema 9 is testing the 50d.

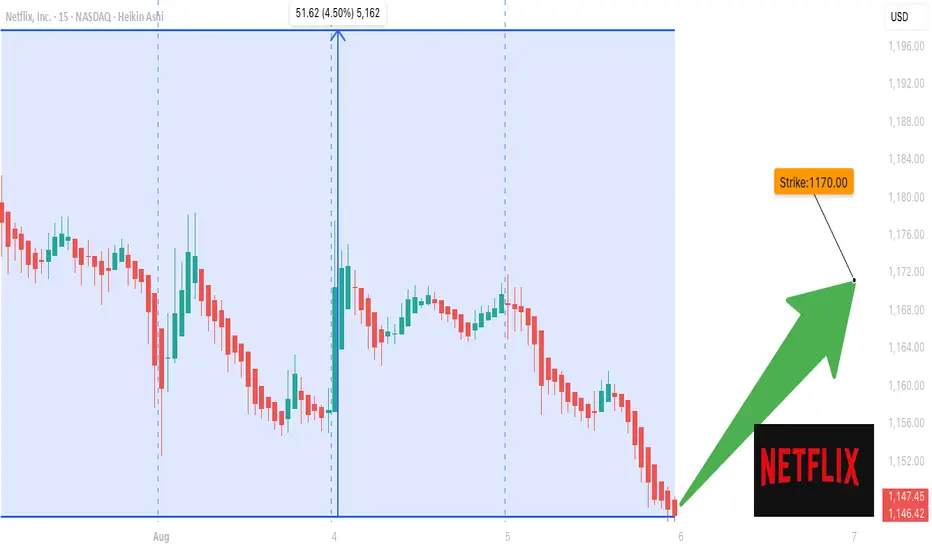
Netflix Options Flash Green – $1170 Target in Sight?
## 🚨 NFLX Options Alert: Quiet Volume, Loud Calls 🚨
**Earnings Loom, Institutions Lean Bullish** 💥
🔹 **Models Align:** 4 out of 5 models flash *Moderate Bullish*
🔹 **RSI**: Daily (35.6) cooling off, Weekly (56.1) still rising
🔹 **Call/Put Ratio**: 1.47 → Bullish positioning building
🔹 **VIX**: At 17.9, IV environment favors options buyers
🔹 **Volume Weakness**: Institution hesitation = key risk
### 📈 TRADE IDEA:
🎯 **NFLX \$1170 Call**
💵 Entry: \$11.80 | 🎯 Target: \$17.70 | 🛑 Stop: \$4.70
📆 Expiry: 2025-08-08 | ⚖️ Confidence: 65%
💡 *Enter at market open. Position size small. Event risk high.*
> “Volume is low, but flow is glowing.”
> Could this be *the* earnings week breakout?
---
### 🏷 Hashtags for Viral Reach:
`#NFLX #OptionsFlow #EarningsTrade #TechStocks #UnusualOptionsActivity #Netflix #TradingSignals #CallOptions #WeeklySetup #TradingViewIdeas`
NFLX Wait For Break Out Fibo Level
## 📈 \ NASDAQ:NFLX WEEKLY TRADE IDEA (AUG 5–9)
**🔥 BULLISH FLOW | CALL/PUT RATIO: 1.84 | CONFIDENCE: 65%**
---
### 🧠 AI-DRIVEN SENTIMENT
* **Weekly RSI**: 54.9 ✅ (Bullish Momentum)
* **Daily RSI**: 38.4 ↗️ (Climbing but still weak)
* **Volume**: 📉 0.7x last week = Low institutional follow-through
* **Options Flow**: Massive call buying = Institutions lean bullish
* **Volatility**: VIX at 18.2 = Option-friendly zone
---
### 🛠️ TRADE SETUP
| 🔹 | Trade Type | Long Call |
| -- | --------------- | ------------------- |
| 🎯 | **Strike** | **\$1200** |
| 📅 | **Expiry** | **Aug 8 (Fri)** |
| 💵 | **Entry** | **\$4.05** |
| 📈 | **Target** | **\$6.00 – \$8.00** |
| 🛑 | **Stop** | **\$2.50** |
| 🔐 | **Size** | 1 contract |
| ⚖️ | **Risk/Reward** | \~1:2 |
---
### ⚠️ RISK CHECK
* 🔸 Daily RSI still < 45 — needs breakout for full confirmation
* 🔸 Volume not convincing — watch for fakeouts
* 🔸 Short expiry = 🔥 gamma risk
---
### 🧩 STRATEGY INSIGHT
> "Call buyers are in. RSI is rising. But volume is soft. You’re early — not late."
🎯 Enter @ Open
🚀 Target quick momentum pop
👀 Exit if RSI fails to break or macro hits
---
💬 **Plan to enter?** Comment “IN”
🔁 Repost if you're tracking NFLX
📊 Follow for more AI-synced trades