Netflix (NFLX) - Elliott Wave Map to $25K📘 Netflix (NFLX) – The Final Act of Supercycle Wave III, Setting the Stage for Wave V to $25,000+
Symbol: NASDAQ:NFLX
Timeframe: Monthly
Published: October 2025
Current Price: ~$1,120
Framework: Elliott Wave | Fibonacci Extensions | Price Action | Smart Money Concepts (SMC) | Fundamenta
Key facts today
0.40 USD
7.74 B USD
34.53 B USD
About Netflix, Inc.
Sector
Industry
Website
Headquarters
Los Gatos
Founded
1997
ISIN
ARBCOM4601D2
Netflix, Inc. engages in providing entertainment services. It also offers activities for leisure time, entertainment video, video gaming, and other sources of entertainment. It operates through the United States and International geographic segments. The company was founded by Marc Randolph and Wilmot Reed Hastings on August 29, 1997 and is headquartered in Los Gatos, CA.
Related stocks

Netflix Down After Earning, But Its Hunting SupportNetflix is coming down after earnings and is currently trading more than 10% lower. Whenever we see such a sharp reversal, it’s important to zoom out and look at the broader trend. From the 2023 lows, there is still a very strong and impulsive recovery, so this could be just a temporary deeper corre
NFLX Earnings Today - Levels to WatchNetflix (NFLX) releases its Q3 earnings today, and sentiment is leaning bullish.
Analysts expect revenue around $11.5 billion (+17% YoY) and EPS near $6.96, supported by optimism around its ad-tier and paid-sharing model.
🌿 This signals growth.
For Q2 2025, Netflix posted revenue of about $11
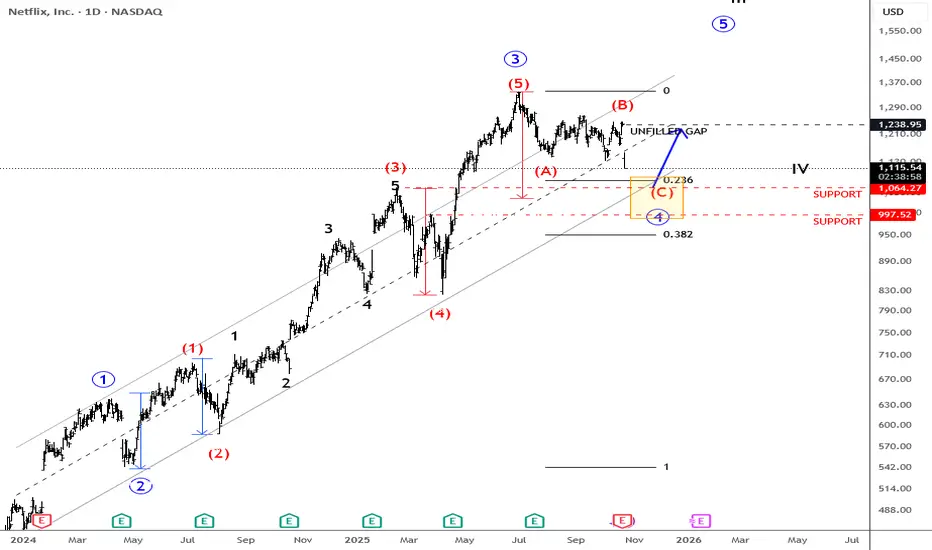
Netflix: Key Support Zone in sightNetflix shares have continued to decline since our last update. We have now provided additional detail on the ongoing turquoise wave 4, which is subdivided into a magenta three-part structure. Within this structure, wave is expected to push price further down into the turquoise Target Zone, betwee

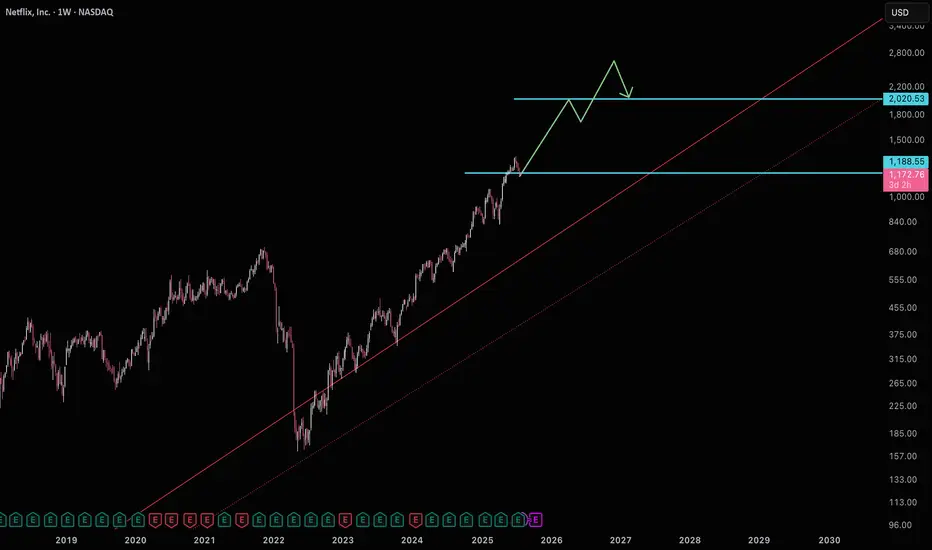
Netflix building support for $2000Netflix is currently sitting on support getting ready for a move to $2000.
Good luck!
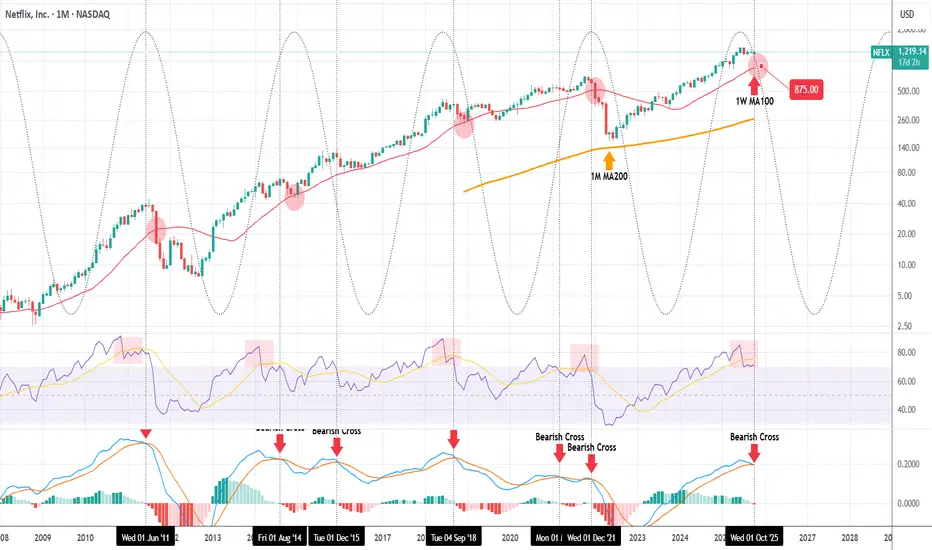
NETFLIX has topped and can pull back to $875.Netflix (NFLX) has formed one of its strongest Sell Signals in the last 15 years. That's the 1M MACD Bearish Cross.
The stock has been trading on a very consistent pattern ever since the 2008 U.S. Housing Crisis and during this multi-year span, the best indicator for a Top has been the 1M MACD form
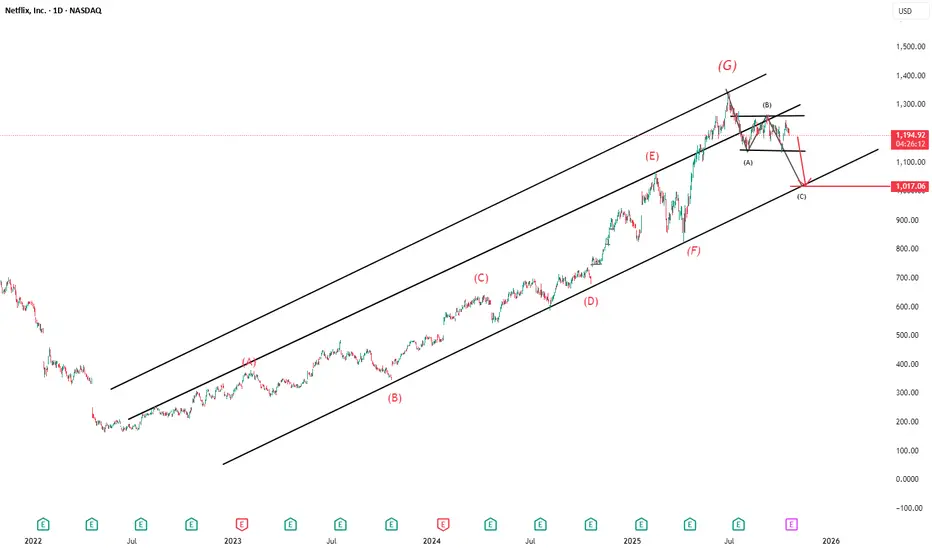
Netflix Ready to Fall ??Technical Analysis Summary
Chart Type: Daily (1D)
Ticker: NFLX (Netflix Inc.)
Current Price: $1,194.00 (as of October 16, 2025)
Recent Movement: Down by -0.77%
📈 Elliott Wave Labels (in red)
The stock shows a 7-wave impulse move labeled from (A) to (G), forming an upward channel.
The latest t
Netflix Buying OpportunityNetflix shares have dropped sharply — losing around 10% of their value in just one day, wiping billions from its market cap. The decline followed disappointing earnings results and a one-off $619 million tax charge in Brazil, overshadowing strong revenue growth.
On the chart, price has tapped into

Netflix (NFLX) Shares See a Sharp DeclineNetflix (NFLX) Shares See a Sharp Decline
According to recent charts, Netflix (NFLX) shares have traded below $1,100 this week — for the first time since late May. The stock has fallen more than 17% from its July peak, while the S&P 500 index remains close to record highs.
Why Has Netflix (NFLX)
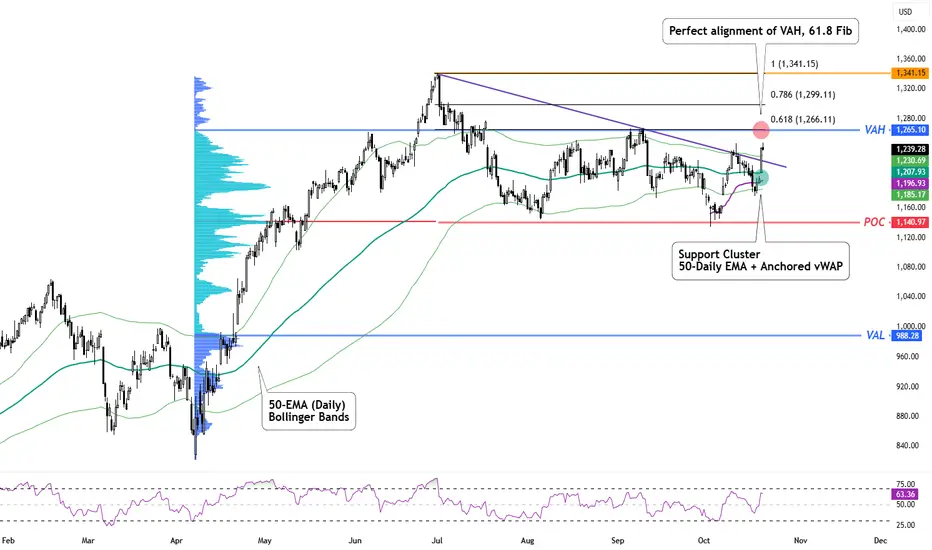
NETFLIX PERFECT LONGNASDAQ:NFLX On the daily TF has committed a large sweep of liquidity, then has broken the previous swing high and is now consolidating bullishly towards the daily 50ema, where I am looking for a reaction to the upside. At the lowest there could be a spike down to the 50fib on a fast retracement, so
See all ideas
Summarizing what the indicators are suggesting.
Oscillators
Neutral
SellBuy
Strong sellStrong buy
Strong sellSellNeutralBuyStrong buy
Oscillators
Neutral
SellBuy
Strong sellStrong buy
Strong sellSellNeutralBuyStrong buy
Summary
Neutral
SellBuy
Strong sellStrong buy
Strong sellSellNeutralBuyStrong buy
Summary
Neutral
SellBuy
Strong sellStrong buy
Strong sellSellNeutralBuyStrong buy
Summary
Neutral
SellBuy
Strong sellStrong buy
Strong sellSellNeutralBuyStrong buy
Moving Averages
Neutral
SellBuy
Strong sellStrong buy
Strong sellSellNeutralBuyStrong buy
Moving Averages
Neutral
SellBuy
Strong sellStrong buy
Strong sellSellNeutralBuyStrong buy
Displays a symbol's price movements over previous years to identify recurring trends.
NFLX5862368
Netflix, Inc. 5.4% 15-AUG-2054Yield to maturity
5.27%
Maturity date
Aug 15, 2054
NFLX5862367
Netflix, Inc. 4.9% 15-AUG-2034Yield to maturity
4.35%
Maturity date
Aug 15, 2034
NFLX4901374
Netflix, Inc. 4.875% 15-JUN-2030Yield to maturity
4.10%
Maturity date
Jun 15, 2030
USU74079AN1
Netflix, Inc. 5.375% 15-NOV-2029Yield to maturity
4.06%
Maturity date
Nov 15, 2029
NFLX4908613
Netflix, Inc. 6.375% 15-MAY-2029Yield to maturity
3.95%
Maturity date
May 15, 2029
US64110LAN64
Netflix, Inc. 4.375% 15-NOV-2026Yield to maturity
3.94%
Maturity date
Nov 15, 2026
NFLX4826528
Netflix, Inc. 5.875% 15-NOV-2028Yield to maturity
3.89%
Maturity date
Nov 15, 2028
NFLX4764899
Netflix, Inc. 4.875% 15-APR-2028Yield to maturity
3.85%
Maturity date
Apr 15, 2028
XS198938050
Netflix, Inc. 3.875% 15-NOV-2029Yield to maturity
3.34%
Maturity date
Nov 15, 2029
XS207282979
Netflix, Inc. 3.625% 15-JUN-2030Yield to maturity
2.83%
Maturity date
Jun 15, 2030
NFCE
Netflix, Inc. 4.625% 15-MAY-2029Yield to maturity
2.68%
Maturity date
May 15, 2029
See all NFLXD bonds
Curated watchlists where NFLXD is featured.


