NKE Pullback-I'm Buying the DipNike (NKE) is under pressure — post-earnings volatility, macro noise, and sentiment all weighing in. But for swing traders, this looks like a textbook accumulation setup.
📌 Entry Zones I’m Targeting:
🔹 $70.00
🔹 $65.00
🔹 $60.00
Profit Targets (Taking wins before 88):
✅ $78.80
✅ $82.50
Let the m
1.30 USD
2.74 B USD
39.55 B USD
About Nike, Inc.
Sector
Industry
CEO
Elliott J. Hill
Website
Headquarters
Beaverton
Founded
1964
ISIN
ARDEUT111341
FIGI
BBG000HG0S03
NIKE, Inc. engages in the design, development, marketing, and sale of athletic footwear, apparel, accessories, equipment, and services. It operates through the following segments: North America, Europe, Middle East, and Africa (EMEA), Greater China, Asia Pacific and Latin America (APLA), Global Brand Divisions, Converse, and Corporate. The North America, EMEA, Greater China, and APLA segments refer to the design, development, marketing, and selling of athletic footwear, apparel, and equipment. The Global Brand Divisions segment represents its NIKE Brand licensing businesses. The Converse segment designs, markets, licenses, and sells casual sneakers, apparel, and accessories. The Corporate segment is composed of unallocated general and administrative expenses. The company was founded by William Jay Bowerman and Philip Hampson Knight on January 25, 1964 and is headquartered in Beaverton, OR.
Related stocks

Global Brand Power Driving Growth Opportunity: BUYBuy Reason: Nike’s strong brand presence, global market penetration, and innovation in sportswear position it for steady revenue growth and resilience amid market fluctuations. Its expanding digital sales and product innovation make it attractive for long-term investors.

$NKE - a Technical Crossroads: April Trendline RetestFocusing on the yellow April trendline and the current price action within the falling red channel:
🟡 Key Level: April Trendline
The yellow diagonal line represents a long-term support/resistance drawn from April.
Price is currently testing that trendline from below, suggesting it's now acting as

Nike's Shift into Premium Markets Drives Bullish Outlook Current Price: $67.37
Direction: LONG
Targets:
- T1 = $70.50
- T2 = $73.75
Stop Levels:
- S1 = $65.50
- S2 = $63.75
**Wisdom of Professional Traders:**
This analysis synthesizes insights from thousands of professional traders and market experts, leveraging collective intelligen

$NKE Inverse Head and Shoulder $117 to gap fillThe chart is currently forming a classic Inverse Head and Shoulders pattern, which is a bullish reversal setup. The left shoulder and head have already been established, and the right shoulder is in development, suggesting a potential breakout to the upside. The neckline resistance appears to be aro

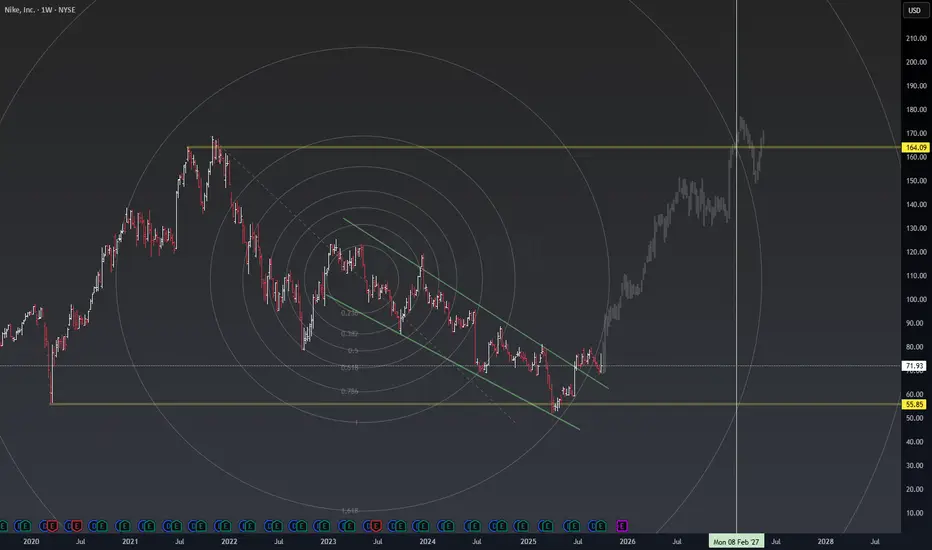
Nike Inc (NKE) - Long Setup Idea📈 Entry: 71.25
🔻 Stop Loss (SL): 52.28
🎯 Target 1 (TP1): 123.39 (+85.41%)
🎯 Target 2 (TP2): 179.10 (+169.39%)
Analysis :
Nike is forming a potential long-term reversal pattern on the monthly timeframe, showing accumulation after a prolonged downtrend. A break above the current consolidation zone c

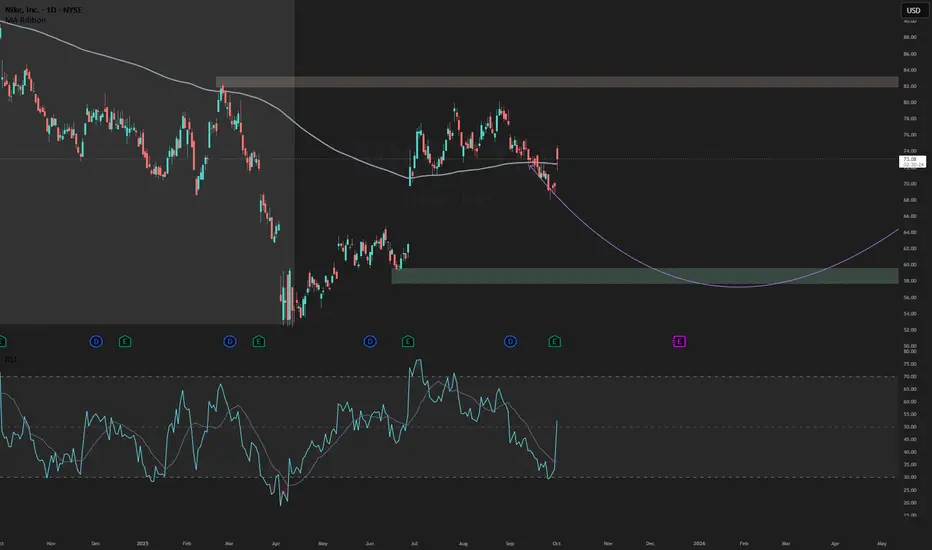
$NKE | Seasonal Reversal Cycle Loading…🧭 NYSE:NKE | Seasonal Reversal Cycle Loading…
NYSE:NKE has historically shown strong Q4–Q1 recoveries following multi-quarter downtrends — a pattern tied to consumer rotation and holiday-season demand.
Current structure shows a breakout from the 2-year falling channel, with the next cyclical wa
NIKE BREAKDOWN (NKE)...POTENTIAL LONG OPPORTUNITYHey hey Tradingview family!!! Joseph here AKA JosePips! Just wanted to come on this week and do a breakdown on the company Nike & what I see technically potentially happening next on this stock! In this video you will get a in depth breakdown of
1. Overall price action structure/context
2. Momentu

My Long Nike idea 1st of October 2025 Nike is honestly such a good investment at these prices but I'm looking for deeper pullbacks if I'm being honest here. We sort of filled a gap on the chart but this is not something that I personally find as a good reason to enter. However, definitely a DCA setup so I will be proceeding with DCA wh
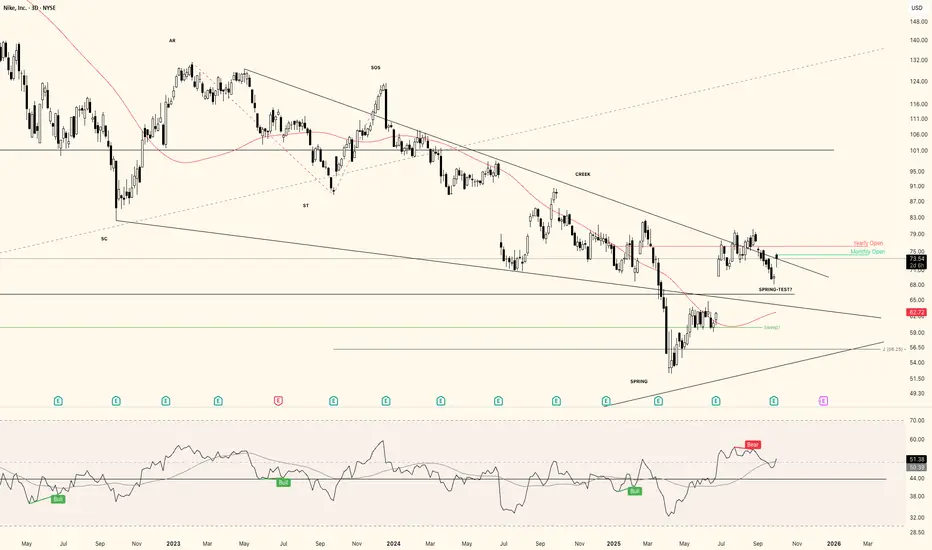
NKE starting a new uprendIf you've followed my previous post about NYSE:NKE you know I was eying a descending wyckoff accumulation schematic. We successfully anticipated the spring-phase and now I think there is a big chance the spring-test has been completed, or anyway will complete soon.
So long story short: next up is
See all ideas
Summarizing what the indicators are suggesting.
Oscillators
Neutral
SellBuy
Strong sellStrong buy
Strong sellSellNeutralBuyStrong buy
Oscillators
Neutral
SellBuy
Strong sellStrong buy
Strong sellSellNeutralBuyStrong buy
Summary
Neutral
SellBuy
Strong sellStrong buy
Strong sellSellNeutralBuyStrong buy
Summary
Neutral
SellBuy
Strong sellStrong buy
Strong sellSellNeutralBuyStrong buy
Summary
Neutral
SellBuy
Strong sellStrong buy
Strong sellSellNeutralBuyStrong buy
Moving Averages
Neutral
SellBuy
Strong sellStrong buy
Strong sellSellNeutralBuyStrong buy
Moving Averages
Neutral
SellBuy
Strong sellStrong buy
Strong sellSellNeutralBuyStrong buy
Displays a symbol's price movements over previous years to identify recurring trends.
US654106AG8
NIKE, Inc. 3.375% 01-NOV-2046Yield to maturity
5.27%
Maturity date
Nov 1, 2046
NKEB
NIKE, Inc. 3.875% 01-NOV-2045Yield to maturity
5.26%
Maturity date
Nov 1, 2045
NKE4971170
NIKE, Inc. 3.375% 27-MAR-2050Yield to maturity
5.21%
Maturity date
Mar 27, 2050
NKEA
NIKE, Inc. 3.625% 01-MAY-2043Yield to maturity
5.20%
Maturity date
May 1, 2043
NKE4971169
NIKE, Inc. 3.25% 27-MAR-2040Yield to maturity
4.94%
Maturity date
Mar 27, 2040
US654106AF0
NIKE, Inc. 2.375% 01-NOV-2026Yield to maturity
3.93%
Maturity date
Nov 1, 2026
NKE4971168
NIKE, Inc. 2.85% 27-MAR-2030Yield to maturity
3.93%
Maturity date
Mar 27, 2030
NKE4971167
NIKE, Inc. 2.75% 27-MAR-2027Yield to maturity
3.72%
Maturity date
Mar 27, 2027
See all NKED bonds
Curated watchlists where NKED is featured.


