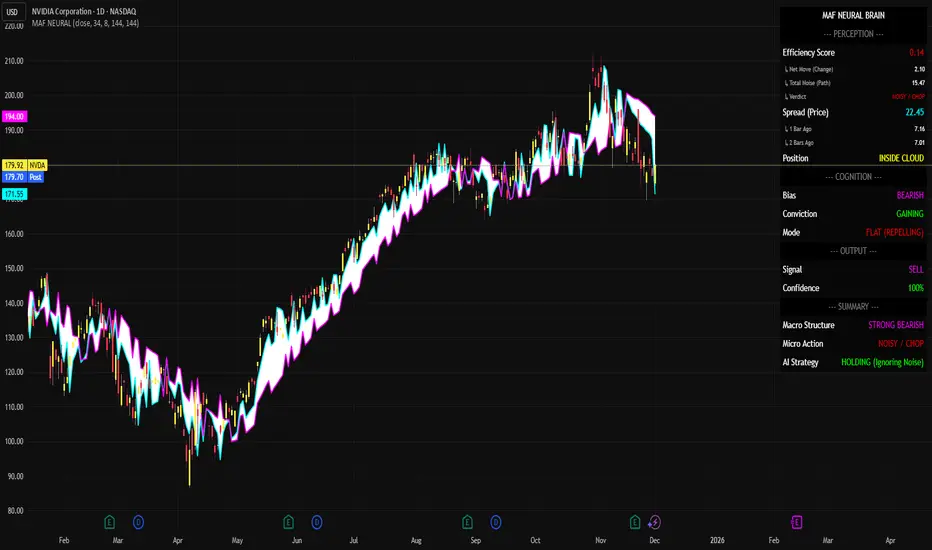
Trade Summary: Bearish Continuation with High ConfidenceYou are looking at the Daily chart for NVDA (NVIDIA Corporation). The broader trend is clearly bearish, and the MAF Neural Brain indicator has identified a high-probability continuation setup.
1. Perception (The Eyes): What the Indicator Sees
Efficiency Score: 0.14. This is very low, indicating "Noisy/Chop" price action. The daily candles are overlapping significantly, showing a struggle between buyers and sellers rather than a smooth trend.
Spread (Price): 22.45. Volatility is present but contained within the bearish structure.
Position: INSIDE CLOUD. Price is trading within the indicator's bands, confirming that this is a consolidation phase within the larger downtrend.
Trade Summary: Bearish Continuation with High Confidence
2. Cognition (The Mind): How the Indicator Interprets It
Bias: BEARISH. Despite the choppy daily action, the system maintains a negative bias.
Conviction: GAINING. This is the key insight. While the market looks messy to the naked eye, the algorithm's internal confidence in the downtrend is actually increasing. It sees the current chop as a pause before another drop, not a reversal.
Mode: FLAT (REPELLING). The market is stuck in a range that is resisting upward breakouts.
3. Narrative (The Story): The Strategic Output
Signal: SELL. A hard sell signal is active.
Confidence: 100%. The system is fully aligned. Every metric (Bias, Conviction, Structure) points to lower prices.
4. Summary (The Execution)
Macro Structure: STRONG BEARISH. The dominant force is selling.
Micro Action: NOISY / CHOP. The daily candles are messy.
AI Strategy: HOLDING (Ignoring Noise).
Trade Analysis: This setup represents a "Bear Flag" or Consolidation in a Downtrend.
The Opportunity: Traders often get shaken out during "Noisy" consolidations like this because they mistake the sideways movement for a bottom. The Neural Brain is explicitly telling you to ignore that noise.
The Action: If you are short, HOLD. If you are flat, this is a valid entry for a Short position, anticipating a breakdown from the current "Inside Cloud" consolidation.
The Verdict: The 100% confidence level combined with "Gaining Conviction" suggests the path of least resistance remains strictly downward.
In plain English: "NVDA is taking a breather after dropping, and the price action is messy. However, the internal data says sellers are still in total control and getting stronger. Don't buy the dip; expect the drop to continue."
NVIDIA Corporation Shs Cert Deposito Arg Repr 0.04166667 Sh
No trades
Market insights
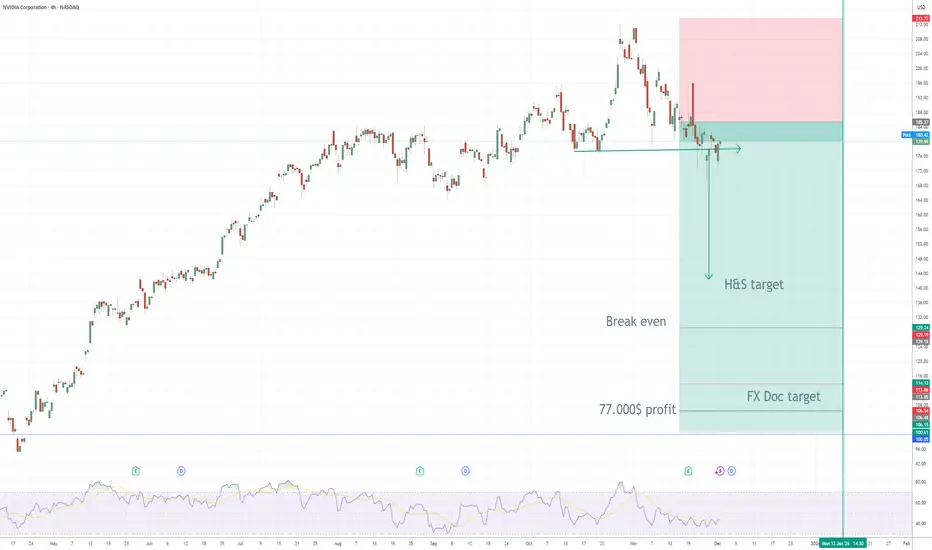
NVIDIA (NVDA) – My PUT Options Position ExplainedI opened a medium-term bearish position on NVDA by purchasing PUT options.
Here’s the full breakdown of the idea, entry logic, and projected targets.
🧠 Why I Entered the Trade
NVDA formed a clear Head & Shoulders (H&S) reversal pattern on the 4H chart — one of the strongest technical reversal signals after an extended bullish trend.
The neckline has now been broken, validating the structure and confirming bearish momentum.
The rejection from the right shoulder, combined with weakening RSI and loss of key market structure, provides additional confirmation.
🎯 My PUT Options Position
I purchased PUT contracts with a defined risk and leveraged downside exposure.
Break-Even Price: ~129 USD
This is the key level where:
the option premium is fully recovered
the position shifts from “loss” to “profit”
As long as NVDA trades below 129 USD before expiration, the position begins generating profit.
💰 Profit Projection
My profit target zone is around 102 USD.
At that level, the trade yields approximately:
➡️ +77,000 USD profit
This aligns with:
the measured target of the Head & Shoulders pattern
previous demand zone turning into resistance
Fibonacci extensions
a full correction of the last impulsive leg
📌 Technical Breakdown
H&S target: ~160 → ~130 → projected extension toward 102
Break-even: 129 USD
FXDoctor target: 102 USD
Trend structure: Major lower lows forming
Momentum: RSI breakdown and bearish continuation signals
The chart clearly shows a potential shift from a hyper-parabolic bullish phase into a deeper correction — a move that benefits PUT buyers with asymmetric risk/reward.
🧨 Summary
I’m holding PUT options on NVDA
Break-even: 129 USD
Projected profit: ~77,000 USD at 102 USD
The trade is based on a clean and validated Head & Shoulders reversal
NVDA is showing early signs of a much larger bearish correction
$NVDA - $140 Target - Short Position - AI Bubble About to BurstIn my opinion, Nvidia does not have much to continue the next needed support for a pro-longed bull run, at least in terms of sentiment. The AI bubble has gone on for too long and the actual multiples of valuations in comparison to revenue and profit generations do not seem to have strong support when considering traditional investing strategies. Also, the next wave seems getting closer and closer to a red trend. Retracement potential is possible after hitting $140, but Nvidia needs to do far more benefit for the public good and have a differentiation that doesn't rely on trends such as crypto mining and the boost of LLMs. As always, none of this is investment or financial advice. Please do your own due diligence and research.
Market Conditions are the Cycle of a Bull or Bear MarketEverything you are learning is beneficial to your trading so long as the information is factual and accurate and NOT hype, scams, fraud, misinformation or manipulative information.
One way to determine if what you are learning is accurate or not is to understand the CYCLEs of the Bull Market and Bear market which are entirely different.
A Great Bull Market is all about new technologies that will and are displacing old technology and are disruptive forces for the older companies whose once new technology is aging and out of date.
Bull Markets have 6 primary market conditions. Each market condition is unique in how you trade that with your trading style, how you find stocks to trade, risk inherent in that market condition and profit opportunities.
We are in the early years of a Great Bull Market. Bull Markets do not just go upward. Retracements, Short Term Corrections, and Intermediate Trend corrections and Flash Crashes, occur periodically when the price of a stock is too far above the fundamental level for that stock. This impacts the indexes.
If a correction causes a sudden collapse of the stock price to be below the fundamental level which is a horizontal price level, then Dark Pools will start bargain hunting and buy the stock to move it back into their Buy Zone.

NVDA long-term TANvidia is still keeping up the long-term uptrend but the mid-term is currently in distribution since the last couple of weeks, so let the news won't surprise you, it's healthy for Nvidia to fall lower and that's what it been doing recently. Some time is needed for Nvidia to bottom out, while long-term remains bullish, the mid-term is yet bearish.

Nvidia ($NVDA) Stock: $2B Synopsys Deal Expands AI Design PowerNvidia has taken another major step to secure its dominance in AI infrastructure by investing $2 billion in Synopsys, one of the world’s leading chip design software companies. The investment instantly makes Nvidia one of the top shareholders and deepens the long-term collaboration between the two firms. The deal strengthens Nvidia’s control over key parts of the AI value chain, from hardware to software tools used in designing new chips across multiple industries.
This partnership gives Synopsys access to Nvidia’s advanced developer tools and GPU-accelerated libraries to boost its electronic design automation (EDA) processes. These improvements aim to speed up chip development cycles at a time when demand for advanced AI hardware continues to surge. For Nvidia, the move ensures it stays positioned at the center of AI innovation and benefits financially from the growth of the entire ecosystem—not just from selling GPUs.
The timing also matters. Synopsys recently reported weakness in its intellectual property segment due to export restrictions tied to China and slower activity from a major foundry customer. Nvidia’s investment restores confidence in Synopsys' long-term outlook while offering Nvidia a strategic foothold in the tools that design the chips running global AI infrastructure.
Technical Analysis
Nvidia’s overall trend remains bullish despite a slight pullback. Price currently trades around $178, holding above a key support zone at $145, which becomes the level to watch if broader tech stocks weaken. Upside momentum resumes if price pushes toward the $212 resistance area—its previous major high. A confirmed breakout above $212 would signal continuation of the broader bullish structure.
With a strong fundamental catalyst and firm long-term trend, Nvidia remains one of the leading names powering AI’s next wave.
Forex Trading Options1. What Are Forex Options?
A forex option is a derivative contract whose value is derived from an underlying currency pair such as EUR/USD, GBP/INR, USD/JPY, or AUD/USD. The buyer of a forex option pays a premium to the seller (writer) in exchange for the right—not the obligation—to buy or sell the currency pair at a predefined price, known as the strike price.
Options help traders manage risk, hedge exposures, and take advantage of directional or non-directional forecasts about the forex market. Because global currencies constantly fluctuate due to interest rates, inflation, monetary policies, geopolitical factors, and macroeconomic data, options give traders flexibility and control over how much they stand to lose or gain.
2. Types of Forex Options
Forex options are broadly divided into two categories: vanilla options and exotic options.
a) Vanilla Options
These are the most basic and widely used options. They come in two forms:
Call Option
A call option gives the buyer the right to buy a currency pair at the strike price.
Example:
Buying a EUR/USD call at 1.0800 means you profit if EUR/USD rises above 1.0800 before expiry.
Put Option
A put option gives the buyer the right to sell a currency pair at the strike price.
Example:
Buying a USD/JPY put at 150.00 means you profit if USD/JPY falls below 150.00.
Vanilla options are straightforward and behave similarly to stock options.
b) Exotic Options
Exotic forex options are complex instruments tailored for advanced hedging or speculative plays. Popular types include:
Binary (digital) options – payoff is fixed if a condition is met.
Barrier options (knock-in, knock-out) – activate or deactivate based on price movement.
Asian options – payoff depends on average price over a period.
Chooser options – allow the holder to choose later whether it is a call or put.
These options are commonly used by institutions rather than retail traders.
3. How Forex Options Work
To understand how options work in forex, you need to understand a few essential terms.
a) Strike Price
The pre-agreed price at which the currency can be bought or sold.
b) Premium
The cost of buying the option. It is non-refundable.
c) Expiry Date
The date when the option contract ends.
d) In-the-Money (ITM)
Option currently has intrinsic value.
e) Out-of-the-Money (OTM)
Option has no intrinsic value and expires worthless unless price moves.
f) At-the-Money (ATM)
Spot price equals the strike price.
4. Option Pricing – What Determines Premium?
The price (premium) of an option is influenced by multiple factors:
1. Spot Price
The current market price of the currency pair.
2. Strike Price
The closeness of the strike to the spot affects intrinsic value.
3. Implied Volatility (IV)
Higher volatility = higher premium.
Forex markets with instability or news events have high IV.
4. Time to Expiry
More time = more premium, since more time means more opportunity for the trade to become profitable.
5. Interest Rate Differentials
Different national interest rates influence currency pair forward values and options pricing.
6. Market Liquidity
Major pairs like EUR/USD have cheaper, more liquid options compared to exotic pairs like USD/TRY.
These factors combine via pricing models like the Garman-Kohlhagen model (a modification of Black-Scholes for forex).
5. Why Traders Use Forex Options
Forex options provide unique advantages not available in spot trading.
1. Limited Risk
The worst-case scenario for option buyers is losing only the premium.
2. Unlimited Upside (for Call Buyers)
If the currency skyrockets, the trader profits significantly.
3. Hedging Tool
Businesses hedge currency risk using options to protect against exchange rate fluctuations.
Example:
An Indian importer expecting to buy goods in USD may buy a USD/INR call option to lock in cost.
4. Flexible Strategies
Options can be combined in creative ways to profit from trending, stagnant, or volatile markets.
5. No Mandatory Execution
If the market goes opposite, the trader can simply let the option expire.
6. Popular Forex Option Trading Strategies
1. Long Call
Expect the currency pair to rise.
2. Long Put
Expect the currency pair to fall.
3. Straddle
Buy both a call and a put at the same strike.
Used when expecting high volatility.
4. Strangle
Cheaper version of a straddle; strikes are wider apart.
5. Bull Call Spread
Buy one call and sell a higher strike call.
Used when expecting moderate upside.
6. Bear Put Spread
Buy put at higher strike, sell put at lower strike.
Used when expecting moderate downside.
7. Protective Put
Used by investors holding forex futures or large spot exposures.
8. Risk Reversal
Combine a long call and a short put to express directional views at lower cost.
Each strategy serves a different market scenario—trend, range, or high-volatility environment.
7. Forex Options vs. Spot Forex Trading
Feature Forex Options Spot Forex
Risk Limited to premium Unlimited (stop-loss needed)
Flexibility Very flexible Less flexible
Cost Requires premium No upfront cost
Profit Potential Unlimited (calls) High but risky
Expiry Yes No expiry
Complexity High Simple
Options are ideal when uncertainty is high, while spot forex is better for immediate price speculation.
8. Risks Involved in Forex Options Trading
Despite protections, options are not risk-free:
1. Time Decay (Theta)
Options lose value as expiration approaches.
2. Complex Pricing
Requires understanding volatility and Greeks.
3. Low Liquidity on Minor Pairs
Wider spreads = less efficient execution.
4. Premium Cost
High volatility = expensive options.
5. Seller’s Risk
Option sellers can face unlimited losses.
Therefore, beginners should focus on buying options rather than writing them.
9. Who Should Trade Forex Options?
Forex options are suitable for:
Intermediate to advanced traders
Businesses hedging currency exposure
Investors wanting limited risk
Traders expecting volatility spikes during events (Fed policy, inflation, elections)
Swing and positional traders who want controlled leverage
Beginners should start with vanilla calls and puts before experimenting with complex structures.
10. Conclusion
Forex options are powerful instruments that provide flexibility, leverage, and limited risk potential. By understanding the mechanics of calls and puts, pricing factors, strategies, and risks, traders can use options to hedge against uncertainties or speculate on currency movements with precision. While more complex than spot trading, forex options offer sophisticated possibilities—especially in volatile global markets driven by economic data, central bank policies, geopolitical events, and macroeconomic trends. With proper knowledge and disciplined strategy, forex options can significantly enhance a trader’s toolkit and open new avenues for profitable trading.
Nvidia breakdown signals further downside this weekCurrent Price: $183.11
Direction: SHORT
Confidence Level: 68% (The majority of professional traders highlight ongoing weakness, technical downtrend channels, and critical support at $174.15 as being at risk. Sentiment leans bearish despite some long-term bullish bets.)
Targets:
- T1 = $175.00
- T2 = $164.00
Stop Levels:
- S1 = $187.00
- S2 = $190.00
**Wisdom of Professional Traders:**
I'm seeing consistent caution among the professional traders tracking Nvidia this week. Several traders point out that the price action remains stuck in a downtrend, with multiple mentions of resistance around $185–$187 and support sitting near $174.15. The consensus from the trading community is that Nvidia's inability to regain the 50-day moving average is keeping the momentum tilted toward the downside, especially with competitive threats from Google's TPU chips pressuring sentiment.
**Key Insights:**
The key point here is the near-term weakness that follows Nvidia's last earnings release. Despite strong results, traders observed a “gap and crap” setup, where the initial post-earnings rally quickly reversed. Many traders are watching the $174.15 level closely; a decisive break here could trigger a sharper sell-off toward the May lows around $164. In this short-term context, long-term call leaps into 2028 don't outweigh the immediate technical vulnerability. The repeated failure to hold above $185 shows sellers are defending that zone aggressively.
Another factor to consider is sector rotation. Several traders noted that other semiconductor names like AMD, Broadcom, and Qualcomm are showing relative strength while Nvidia lags. This divergence suggests capital is moving away from Nvidia into peers, which could exacerbate near-term pressure.
**Recent Performance:**
This all played out in recent sessions as Nvidia declined over 12% last month, breaking key technical levels and underperforming both the Philly Semiconductor Index and Nasdaq. Last week’s price closed down 1.8% even as many tech names bounced, underscoring persistent weakness.
**Expert Analysis:**
Multiple professional traders' analysis points to clear downside setups. Several mentioned Nvidia being “bearish unless it breaks 185” with lower-high patterns forming. Support zones at $174.15 and $164 are in play if the trend continues. Many traders highlighted heavy institutional selling, potentially linked to AI bubble concerns. Even those with long-term bullish views admit the near-term chart is unattractive, and that the downtrend channel remains intact.
**News Impact:**
What's interesting is the competitive pressure narrative gaining traction — especially reports about Meta considering Google TPUs in future data centers. This kind of news has already triggered multiple single-day drops exceeding 6%, adding fuel to the bearish case. While the Fed’s policy pivot could help broader markets, traders are pointing out that Nvidia’s specific headwinds—valuation, technical breakdowns, and competitive threats—are more pressing in the short-term.
**Trading Recommendation:**
Putting it all together, I’d look for short setups below $183, targeting $175 first and then $164 if bearish momentum accelerates. Stops should be placed above $187 to limit losses, with a wider emergency stop at $190 in case of a sharp reversal. Position sizing should reflect moderate confidence, with risk kept tight until Nvidia reclaims and holds above the 50-day moving average. This looks like a tactical short for the week, taking advantage of persistent weakness and well-defined technical levels.
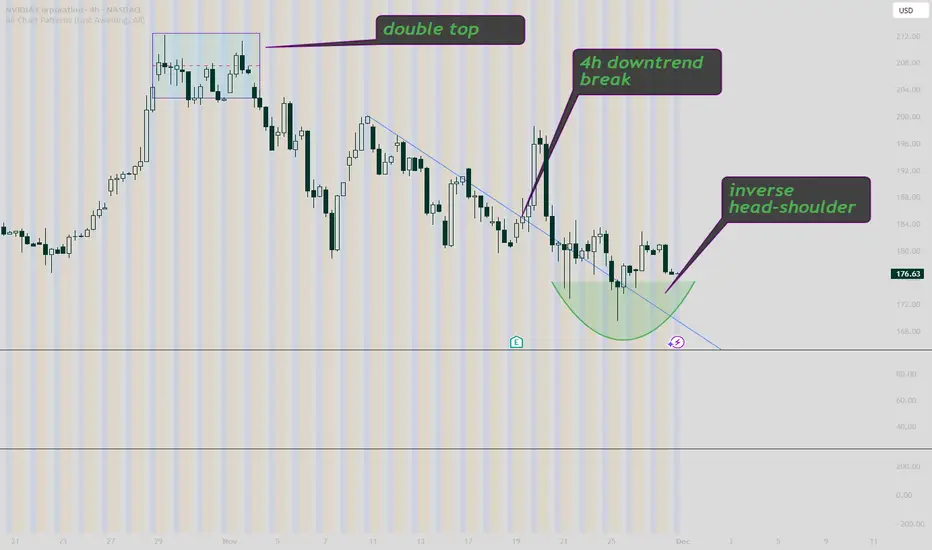
NVDA 4H TECHNICAL ANALYSIS NVDA has broken a downtrend triggered by a double top, and has now formed a inverse head and shoulders
Forex Trading Secrets1. Price Action Is the Real King (Not Indicators)
Most beginners clutter their charts with dozens of indicators hoping to find a perfect buy–sell formula. Professionals know the truth: price itself gives the most reliable information. Indicators lag because they represent past price data, not current market intent.
What professionals focus on:
Support and resistance zones
Market structure (higher highs, lower lows)
Liquidity levels (areas where stop-loss clusters exist)
Candlestick strength (rejection wicks, engulfing candles)
When a trader learns to read price action—how candles react to zones, how momentum builds or fades—they can trade profitably even with a clean chart. Indicators become secondary confirmation tools, not primary decision drivers.
2. Liquidity Is What Moves the Market
Here’s a hidden truth: forex markets move to fill liquidity, not because of random price swings. Big players like banks and institutional traders execute massive orders, and they need liquidity to fill those orders efficiently. That means:
Price hunts stop-loss clusters
Price sweeps highs and lows before reversing
Spikes occur to capture pending orders
This is why you often get stopped out right before the market moves in your favor. Understanding liquidity behavior gives traders a powerful edge.
Liquidity concepts include:
Stop hunts
Fake breakouts
Order block zones
Liquidity grabs
Smart traders expect these moves and position themselves accordingly.
3. The Trend Is Stronger Than Your Analysis
One of the biggest secrets is deceptively simple: Trading with the trend dramatically increases win probability. Many traders try to catch tops and bottoms, but institutional players rarely fight the trend—they ride it.
Characteristics of trend-following success:
Higher time-frame confirmation
Entering on pullbacks, not chasing
Using simple trend continuation patterns
Keeping trades open longer during strong trends
The trend holds more weight than any indicator or news event. Fighting the trend is one of the fastest ways to blow up an account.
4. Risk Management Is the Most Guarded Secret
Ask any long-term successful trader their biggest edge, and the answer won’t be a strategy—it will be risk management.
Key risk management secrets:
Never risk more than 1–2% per trade
Position sizing is more important than entries
A trader with moderate accuracy and strong risk rules often outperforms a trader with high accuracy but poor risk control
Understanding when not to trade is also a powerful risk strategy. Not trading low-quality setups protects your capital and mental energy.
5. Trading Psychology Outweighs Strategy
This is the hardest secret for beginners to accept: Your mindset determines your results more than your system.
The psychological traits professionals share:
Patience to wait for ideal setups
Discipline to follow rules consistently
Neutrality—no emotional attachment to wins or losses
Resilience after a losing streak
Confidence built on data, not hope
A trader can have the world’s best strategy, but fear, greed, revenge trading, and impulsiveness will destroy the account. This is why psychology books are more valuable than indicator tutorials.
6. Higher Time Frames Reduce Noise and Increase Accuracy
A hidden secret among consistently profitable traders is that they rely heavily on higher time frames like the daily or 4-hour.
Why higher time frames work:
Clearer market structure
Stronger trend visibility
Fewer false signals
Trades require less screen monitoring
Better risk-to-reward setups
Scalping looks attractive, but it magnifies emotions and often leads to over-trading. Higher time-frame trading reduces mental stress and increases consistency.
7. Fundamental Catalysts Drive Major Moves
Forex is deeply influenced by macroeconomic factors. Professionals use fundamentals to understand why the market is trending and where major volatility will occur.
Major catalysts include:
Central bank interest rate decisions
Inflation data (CPI, PCE)
Employment data (NFP, unemployment rates)
GDP figures
Geopolitical events
Fiscal policies
Ignoring fundamentals means ignoring the very forces that create trends.
But the secret is: You don’t need to be an economist—just know when news is happening and how it affects risk.
8. Smart Money Concept (SMC) Edge
Institutional-style concepts, once hidden from retail traders, are now increasingly discussed. These include:
Order blocks
Fair value gaps (FVG)
Market structure shifts (MSS)
Imbalance zones
Buy-side and sell-side liquidity
These concepts explain how institutions accumulate and distribute positions. Traders who master SMC often experience a major breakthrough in accuracy.
9. Consistency Beats Intensity
This secret is rarely acknowledged.
Successful traders:
Follow a structured routine
Practice the same strategy repeatedly
Keep a trading journal
Backtest regularly
Set trading sessions and stick to them
Failure in forex often comes from randomness—random indicators, random entries, random time frames. Success comes from consistency, not constant experimentation.
10. Forex Is a Business, Not Gambling
Treating forex like a business means:
Maintaining a trading plan
Logging trades
Tracking performance metrics
Identifying weak areas
Improving process instead of chasing profits
Traders who approach forex like gambling lose money. Traders who approach it like a business grow gradually and sustainably.
Conclusion: The “Secrets” Are Not Hidden—They Are Underrated
The real secrets of forex trading are not magic formulas or mysterious tools. They are principles that professionals use every day but beginners often overlook in search of shortcuts.
To summarize:
Price action matters most
Liquidity drives the market
Trend-following improves probability
Risk management is the true edge
Psychology determines consistency
Higher time frames simplify trading
Fundamentals guide long-term trends
SMC offers an advanced structural view
Consistency builds mastery
Treating trading as a business ensures longevity
Mastering these secrets takes time, discipline, and patience. But once internalized, they form the foundation of sustainable forex success.
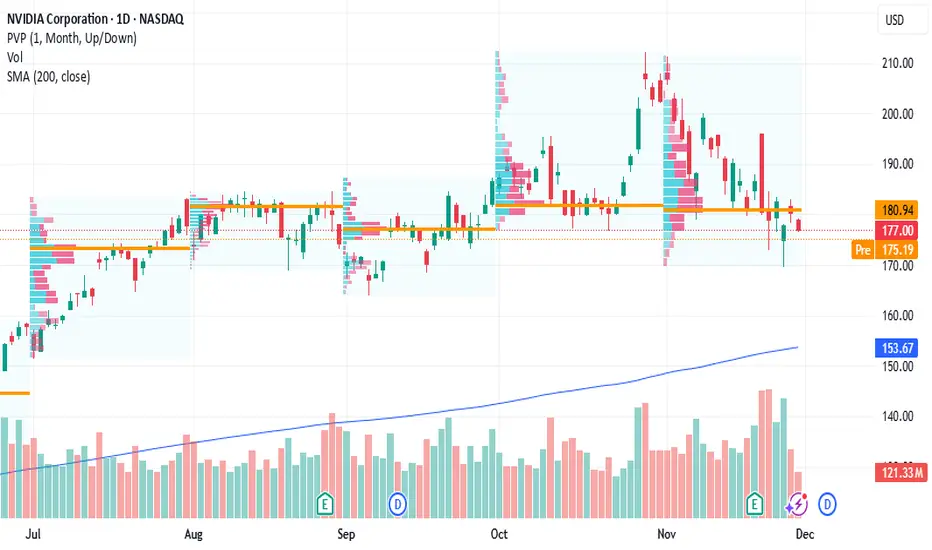
NVDA at a Decision Level – Dec 1–5 OutlookWeekly – Trend Still Up, But Losing Strength
NVDA has been riding a strong multi-month uptrend, but the last few weekly candles show the first real slowdown. A clear CHoCH formed near the recent highs, and sellers stepped in aggressively. The weekly candle closed with a long upper wick and a heavier body — signaling momentum cooling.
Important weekly zones:
* $198–200: previous weekly supply
* $176–178: weekly support where buyers stepped in
* $153–160: deeper weekly demand
* $120s: major demand if the market rolls over hard
Weekly tone → still bullish on the big structure, but fading momentum with the first signs of deeper pullback potential.
Daily – Inside a Pullback After Supply Rejection
Daily shows a sharp rejection from the supply zone near $210–215. Price broke structure downward (CHoCH), then bounced from a lower demand zone but hasn’t reclaimed the supply above.
Daily key levels:
* Resistance: $198 → $212
* Support: $177 → $172
Until price fully reclaims and holds above $198–200, NVDA stays at risk for lower continuation.
Daily tone → trapped underneath supply, struggling to regain upside momentum.
1-Hour – Sideways Grind After Breakdown
The 1H shows clean weakness:
* BOS downward
* Multiple failed retests of $182–183
* Price repeatedly rejecting the underside of the broken trendline
* Buyers only defending short-term at $176–178
The more NVDA keeps getting rejected at the same 1H resistance, the more pressure builds for a deeper dip.
Short-term 1H levels:
* Breakout: above $183 → retest $188–190
* Breakdown: below $176 → flush toward $172–170
1H tone → consolidation after rejection, leaning bearish unless buyers reclaim $183.
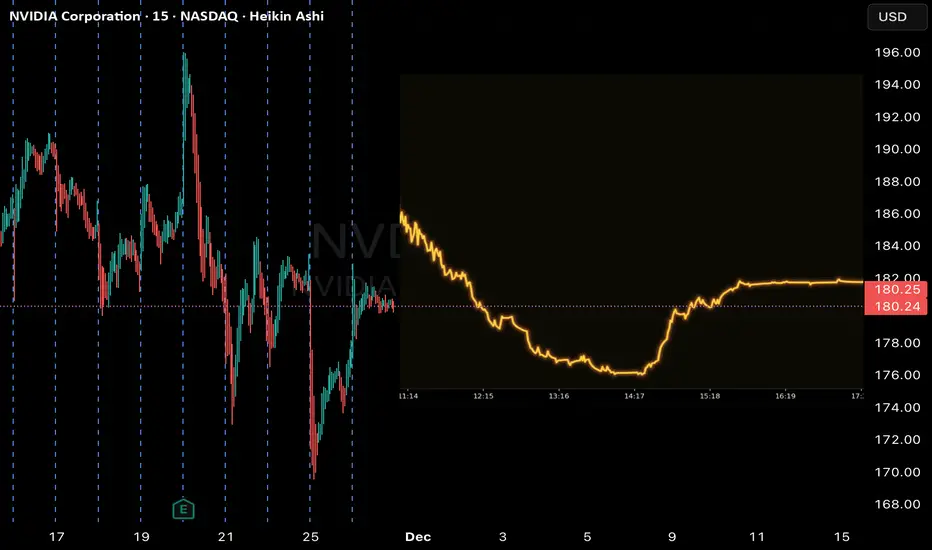
15-Minute – Compression Before the Next Move
The 15m chart is compressing inside a tight range after the clean BOS move earlier. This type of structure usually leads to an impulsive move.
The repeated rejection at $182–183 shows sellers defending aggressively. Buyers are only holding the short-term demand around $176–178.
15m tone → leaning bearish unless it breaks above $183 with real strength.
GEX – Options Positioning Shows the Real Pressure Points
On the NVDA GEX chart:
* Highest positive GEX: $185–187 → magnet + resistance
* 3rd CALL wall: near $190 → extension if momentum flips
* PUT walls:
* $172–175: heavy PUT support
* $160: large negative gamma zone
* $145–150: deep support if the market panics
What GEX is saying:
* Below $183, market makers lean bearish and push toward $176–172.
* A clean break above $185 can snap the chart upward into $188–190 fast due to positive gamma.
* A breakdown below $176 opens a straight path to $170–172 with momentum.
GEX aligns perfectly with the TA:
* All timeframes showing pressure from above
* GEX walls lining up with the exact levels on the 1H and 15m
* A bigger move waiting as soon as NVDA loses or reclaims the key areas
Trading Thoughts – Dec 1–5
Bullish Setup
NVDA needs a clean break + hold above $183–185.
Targets:
* Target 1: $188
* Target 2: $190 (CALL wall)
Stop zone → below $176
Call idea (only if breakout happens):
NVDA 185C / 190C, short-dated — ONLY after confirmation.
Bearish Setup
If NVDA loses $176, downside opens quickly.
Targets:
* Target 1: $172
* Target 2: $170
* Target 3: $160 (deep support on GEX)
Put idea (safer):
NVDA 172P or 170P — only valid if breakdown happens.
Overall Outlook for Dec 1–5
NVDA is sitting right at a squeeze point.
Key alignments:
* Weekly: losing momentum
* Daily: stuck under major supply
* 1H: rejecting underside of broken trendline
* 15m: compression before a direction
* GEX: clear resistance above $185 and clear support at $176 → perfect pressure map
The next move will be clean once direction confirms.
This is the type of setup where option traders shouldn’t guess — just wait for the breakout or breakdown and ride the move.
Disclaimer
This analysis is for educational purposes only, not financial advice. Always trade with proper risk management and confirmation.
NVDA to $170? AI Bubble Risk, Big Money Exits & Heavy Shorts !I f you haven`t bought NVDA before the previous earnings:
Now you need to know that NVIDIA has dominated 2023–2025, becoming the face of the global AI boom. But the higher the climb, the harder the fall. While NVDA is still seen as “untouchable,” several major signals suggest the stock could revisit levels near $170 — a healthy correction of 10–15% from here.
1. Major Investors Are Exiting — SoftBank Dumped Everything
SoftBank, one of Nvidia’s earliest and most influential institutional backers, sold its entire stake in late 2025, worth roughly $5.8 billion.
Smart-money exits near all-time highs should never be ignored.
SoftBank rarely sells unless it believes:
- the sector is overheated
- the valuation has run too far
- risk/reward becomes asymmetric
This mirrors their strategy in 2021–2022 when they unloaded overvalued tech before the correction.
SoftBank’s full exit is a red flag for anyone ignoring the possibility of an AI bubble.
2. Michael Burry Bought Massive Puts — A Direct Bet Against the AI Mania
Michael Burry — famous for predicting the 2008 crisis — has quietly increased his put positions on NVIDIA and other AI names.
Why does this matter?
Because Burry doesn’t short “normal” overvaluations.
He shorts bubbles.
His AI thesis:
- expectations are unrealistic
- revenue growth is priced as infinite
- companies are spending billions on AI with no short-term monetization
- chip demand could normalize faster than markets expect
When a contrarian with Burry’s track record bets against a trend, it’s worth paying attention.
3. NVIDIA’s Valuation Is Stretched Even for a Hyper-Growth Company
Even bulls agree: NVDA’s multiples are once again aggressively priced.
Key issues:
• Price-to-Sales historically elevated
NVDA is trading at a P/S ratio that would be insane for any company approaching a $5 trillion market cap.
• Revenue growth expectations assume perfect long-term AI adoption
If AI monetization slows or plateaus even slightly, NVDA’s valuation collapses fast.
4. Are We in an AI Bubble? Many Indicators Say Yes
Top analysts, academics, and even bullish investors admit:
AI has bubble-like behavior.
Evidence of a bubble:
- Stock prices rising faster than actual earnings growth
- Companies buying GPUs “because everyone else is doing it”
- Zero clarity on monetization for many AI firms
- AI startups valued at billions with no revenue
- Media hype similar to 1999 dot-com sentiment
Harvard Business Review, Wired, and Investopedia already discuss the “AI bubble thesis.”
If AI expectations don’t materialize fast enough, NVDA becomes the single most vulnerable stock on the market.

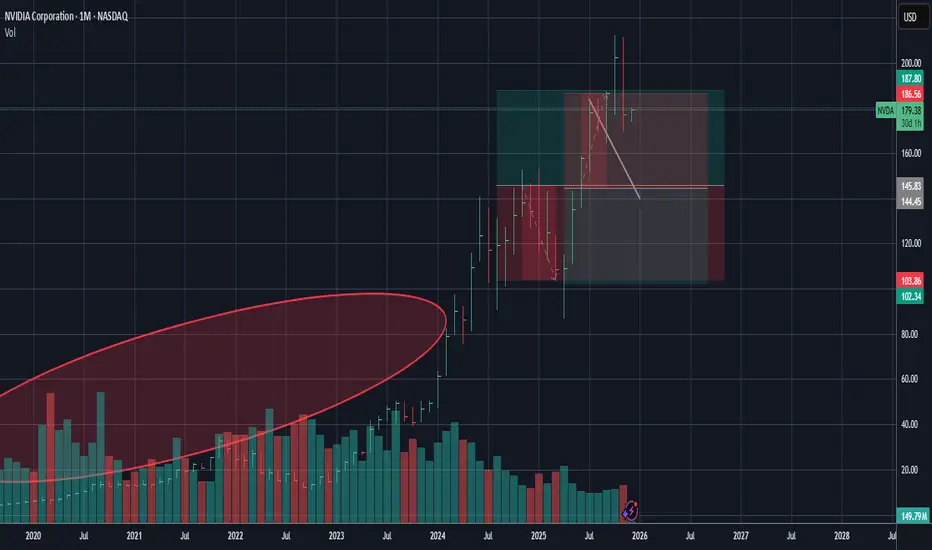
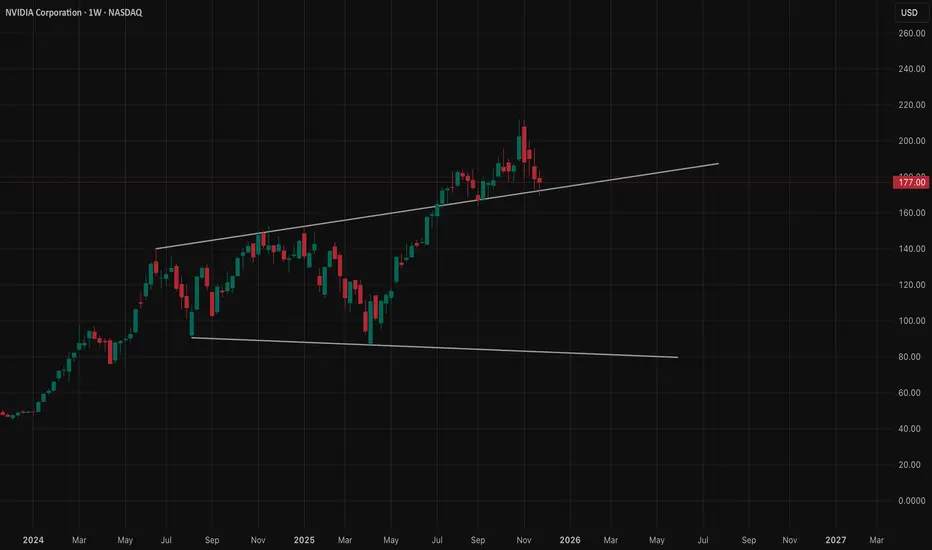
NVIDIA Trading plan from $100 to $1000. Is it plausible?Exactly a month ago, we called the end of the rally on NVIDIA Corporation (NVDA), essentially the end of its multi-year Bull Cycle and the beginning of an aggressive Bear Cycle correction.
** The 10 year Channel Up **
So far this is paying dividends as the stock just completed a 4-week red streak. The essence of NVIDIA's trend has been a decade long Channel Up, as you can see on this chart and that's the basis of all the buy entries and sell exits we've made over the years.
** Bull and Bear Cycles **
Since early 2025, the stock started that Channel Up, whose first Bull Cycle (as well as the next ones with the exception of one breaking) was supported by the 1W MA50 (blue trend-line). Once that Bear Cycle (in the form of the Channel's Bullish Leg) ended, the subsequent Bear Cycle (Bearish Leg) broke below both the 1W MA50 and 1W MA100 (green trend-line) and bottomed exactly on its 1W MA200 (orange trend-line), marginally above the 0.382 Fibonacci retracement level.
The following Bull Cycle as well as the Bear Cycle followed the same structure only, the bottom was this time marginally below the 0.382 Fib. Then the Bull Cycle that just ended started, with only basic difference that its early 2025 correction broke below the 1W MA50 but found Support on the 1W MA100. Every Bull Cycle had such pre-Top correction (blue ellipse). Note also that this last Bull Cycle as been the strongest Leg on +1881% rise and the one before it, the 'weakest' at +1004%.
** The RSI **
Notice also that the 1W RSI has made the same Double Top rejection pattern on the Lower Highs Zone that both previous Bull Cycle Tops did. Strong confirmation therefore of the emerging Bear Cycle.
** The next bottom **
Technically, we expect the market to bottom yet again on the 1W MA200, which by a fair projection of its current trajectory, we expect that to be around $100. That would still be considerably above the 0.382 Fib, which can only get hit if the Bear Cycle falls very aggressively. Note here that historically within this Channel Up, the most optimal buy signal was given when the 1W RSI hit 42.00. Use that in combination with the 1W MA200.
** Future Targets **
So after the Bear Cycle bottoms, what Target can we pursue? Well the 'minimum' projection based on the 2.618 Fibonacci extension of the Bull Cycle that just ended is $700. At the same time, if it rises by again the 'minimum' % of the weakest +1004% Bullish Leg of the Channel, we are looking potentially at a 4-year Target of $1100. It is also worth noting the valuable use of the Sine Waves that have so far accurately grasped the peak formations of the Bull Cycles. We can use this to time our market exits in 2029.
Realistic or not subjectively, the $100 to $1000 path is what the pure technicals and historical data support and clearly show is a very likely probability for a long-term investment.
---
** Please LIKE 👍, FOLLOW ✅, SHARE 🙌 and COMMENT ✍ if you enjoy this idea! Also share your ideas and charts in the comments section below! This is best way to keep it relevant, support us, keep the content here free and allow the idea to reach as many people as possible. **
---
💸💸💸💸💸💸
👇 👇 👇 👇 👇 👇

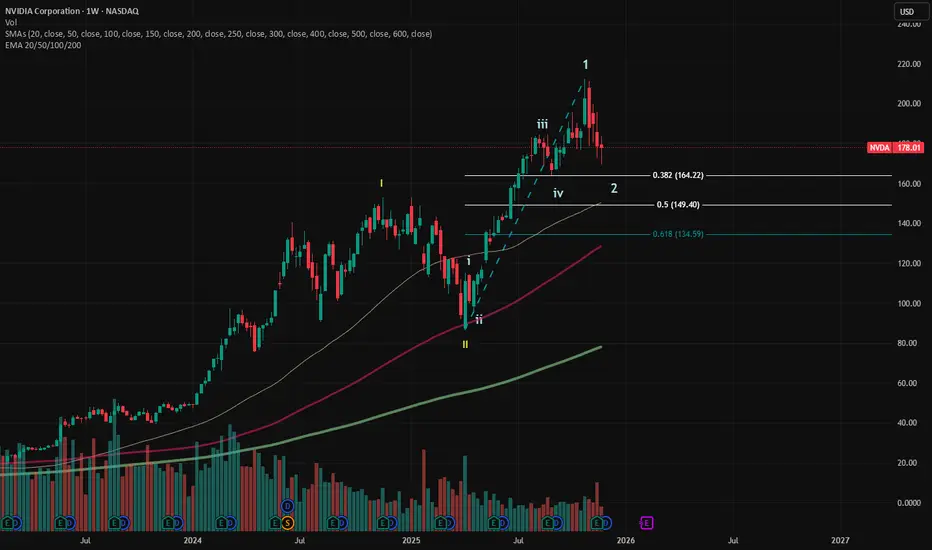
$NVDA: Wave 2 correction in placeNASDAQ:NVDA : I'm long term bullish on NVDA. I count the current weakness as a Wave 2 correction. Wave 2 can correct deeply. Presently, it has not corrected 38.2% yet.
I have a long term NVDA position that accounts for 2.7% of my portfolio. If it drops to 38.2% retracement area, I'll add. If not, I'm happy with holding my current position.
Currently, I'm 8% in cash.
Case Studies of High-Growth Emerging EconomiesIntroduction
Emerging economies play a pivotal role in shaping global economic dynamics. Characterized by rapid industrialization, increasing integration into global markets, and significant socio-economic transformation, these countries often exhibit higher growth rates compared to developed economies. Understanding their trajectories offers critical insights into developmental strategies, policy formulation, and investment opportunities. This case study analysis focuses on select high-growth emerging economies, examining the factors that fueled their rise, challenges they faced, and lessons that can inform other countries.
1. China: The Manufacturing Giant
Economic Transformation:
China’s growth story is one of the most studied among emerging economies. Since the late 1970s, China transitioned from a centrally planned economy to a market-oriented one. Reforms, such as the establishment of Special Economic Zones (SEZs) and liberalization of trade, catalyzed manufacturing and exports, positioning China as the “world’s factory.”
Key Growth Drivers:
Export-Led Growth: China leveraged low-cost labor and improved infrastructure to dominate global manufacturing.
Investment in Infrastructure: Massive investments in roads, ports, and energy supported industrial expansion.
Technology Adoption: China strategically invested in technology transfer, innovation, and R&D, gradually moving from low-end manufacturing to high-tech industries.
Challenges:
Environmental degradation due to rapid industrialization.
Rising labor costs leading to the relocation of manufacturing to other emerging markets.
Increasing reliance on debt-financed infrastructure projects.
Lessons Learned:
China’s model illustrates the effectiveness of phased liberalization, export-driven strategies, and strategic government intervention in catalyzing rapid growth.
2. India: Services-Led Growth
Economic Transformation:
India represents a contrasting high-growth model driven predominantly by services rather than manufacturing. Since economic liberalization in 1991, India’s GDP has grown steadily, propelled by information technology (IT), software services, and business process outsourcing (BPO).
Key Growth Drivers:
Human Capital: A large, young, and English-speaking workforce facilitated the IT and services boom.
Policy Reforms: Liberalization, privatization, and deregulation attracted foreign investments and promoted entrepreneurship.
Global Integration: India leveraged globalization to become a hub for IT exports, serving international markets.
Challenges:
Infrastructure bottlenecks, particularly in transport and energy, limit manufacturing growth.
Income inequality and regional disparities pose social and political challenges.
Dependence on global demand for IT services makes the economy vulnerable to international shocks.
Lessons Learned:
India’s case underscores the potential of services-led growth and the importance of investing in human capital and digital infrastructure.
3. Vietnam: Export-Oriented Manufacturing
Economic Transformation:
Vietnam’s growth trajectory has been remarkable, with GDP expanding rapidly over the past two decades. Economic reforms under Đổi Mới in 1986 shifted Vietnam from a centrally planned to a market-oriented economy, stimulating private enterprise, foreign investment, and export-led manufacturing.
Key Growth Drivers:
Foreign Direct Investment (FDI): Incentives and trade agreements attracted global manufacturers in electronics, textiles, and footwear.
Competitive Labor Costs: Vietnam’s young workforce and low wages made it a preferred alternative to China for global supply chains.
Trade Liberalization: Membership in the World Trade Organization (WTO) and bilateral trade deals integrated Vietnam into global markets.
Challenges:
Overreliance on FDI and exports exposes the economy to external shocks.
Environmental concerns due to industrialization and urban expansion.
Need for skilled labor and innovation to move up the value chain.
Lessons Learned:
Vietnam highlights the effectiveness of combining market reforms with targeted FDI policies to achieve rapid industrial growth.
4. Ethiopia: Agriculture and Industrial Parks
Economic Transformation:
Ethiopia’s growth story differs from East Asian models, as it relies heavily on agriculture and government-led industrialization. Over the past decade, Ethiopia has been one of Africa’s fastest-growing economies, with infrastructure projects and industrial parks driving development.
Key Growth Drivers:
Agricultural Reforms: Modernizing agriculture through irrigation, mechanization, and value-chain development.
Industrial Parks: Establishment of textile and garment industrial parks attracted foreign investment.
Infrastructure Development: Roads, energy projects, and telecom expansion improved productivity and connectivity.
Challenges:
Political instability and regional conflicts have hampered sustained growth.
Heavy reliance on donor funding and external loans poses debt sustainability risks.
Climate vulnerability affects agricultural output.
Lessons Learned:
Ethiopia demonstrates how strategic public investment in infrastructure and industrial policy can drive growth, even in low-income economies, but highlights the importance of political stability.
5. Brazil: Resource-Led Growth and Diversification
Economic Transformation:
Brazil’s growth has been fueled by abundant natural resources, agricultural exports, and a diversified industrial base. The country emerged as a key player in commodities such as soybeans, iron ore, and oil.
Key Growth Drivers:
Natural Resources: Exploitation of oil, minerals, and agricultural commodities drove export revenues.
Social Programs: Initiatives like Bolsa Família improved human development indicators, supporting domestic consumption.
Industrial Diversification: Investment in automotive, aerospace, and manufacturing sectors reduced dependency on raw materials.
Challenges:
Volatile commodity prices exposed the economy to global shocks.
Political corruption and policy inconsistency hindered long-term growth.
Structural inequality and inflationary pressures remained persistent challenges.
Lessons Learned:
Brazil’s experience underscores the importance of diversifying growth drivers and managing the resource curse through effective policies.
Comparative Analysis
Across these case studies, several common patterns emerge:
Policy Reforms Matter: Successful emerging economies implemented liberalization, trade openness, and regulatory reforms to attract investment.
Human Capital is Key: Education, skill development, and labor force quality are crucial for sustaining growth.
Infrastructure Investment: Physical and digital infrastructure accelerates industrialization and trade integration.
Global Integration: Leveraging globalization through exports and FDI is a consistent growth enabler.
Challenges Remain: Environmental sustainability, inequality, and political stability are recurring constraints that need continuous attention.
While the paths differ—China’s manufacturing-led growth, India’s service-led expansion, Vietnam’s FDI-driven industrialization, Ethiopia’s public-sector infrastructure model, and Brazil’s resource-led diversification—they all highlight that a combination of strategic policies, investments in human and physical capital, and integration into global markets drives high growth.
Conclusion
High-growth emerging economies offer valuable lessons in economic transformation. Their experiences demonstrate that while growth strategies can differ based on comparative advantages, consistent factors such as policy reforms, human capital development, infrastructure investment, and global engagement are universally critical. However, challenges such as inequality, environmental sustainability, and political stability must be addressed to ensure long-term, inclusive growth.
Understanding these cases equips policymakers, investors, and scholars with insights on how emerging economies can navigate the complexities of globalization, industrialization, and socio-economic development, while providing a roadmap for other developing nations aspiring for rapid and sustainable growth.

NVDA vs. The Narrative: Why I’m Holding Through the NoiseWhile headlines scream "bubble" and Michael Burry loads up on short positions, I’m doubling down on what the charts are actually saying — not the fear-based narratives. This post is for those who trust price structure, volume psychology, and timeframe alignment over media noise. Let’s dive in.
Chart Structure Speaks Louder Than Opinions
Across all timeframes — from 4H to 6M — NVDA and the broader S&P are forming morning star dojis, a powerful reversal signal. These candles are whispering accumulation. Retail isn’t listening. Smart money already has.
Key Observations:
SPY & SPXL (S&P 500 ETFs): Forming higher lows with bullish fib retracements holding tight. No sign of weakness, despite Burry’s apocalyptic tone.
NVDA (NASDAQ):
The 6M chart shows clear magnet zones at 212 and 392.
An unfilled liquidity gap from the 390s is now acting as a gravitational pull — price will revisit it.
Every timeframe confirms this momentum is building for a breakout, not breakdown.
NVDA/USD Confluence: Mirrors the NVDA/NASDAQ structure almost 1:1. This correlation across instruments adds major conviction to the thesis.
Psychology Check: Why I Disagree with Michael Burry
Burry may be shorting because of macroeconomic risk. Or, maybe he’s playing the same game Melvin Capital did — betting retail will panic.
But I believe he’s underestimating the AI revolution, semiconductor demand, and the market’s memory of missed upside in prior decades.
The dot-com boom had hype, yes — but this has utility. AI isn’t a buzzword anymore. It’s infrastructure. And NVDA is at the core.
Liquidity will return. The market will wake up. And those who held the line will reap the rewards.
Final Words:
The media lies. Liquidity hides. But candlesticks don’t fake structure.
If NVDA fills its liquidity magnet, hits prior highs, or simply rides the S&P's tide — the upside is mathematically undeniable.
To those holding — congratulations.
To the bears — good luck.
To Burry — you might be early, but you might also be wrong.
- MoNí

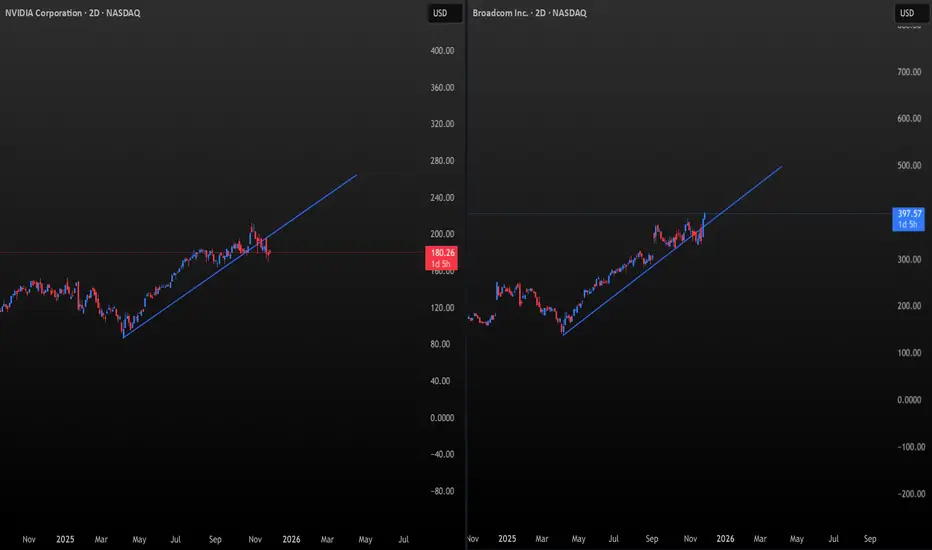
NVDA vs AVGO: The Battle for the AI Throne Has Begun⚡A New Leader Emerges in the Semiconductors
For years, NVDA was the undisputed titan — the gravitational center of the semiconductor universe.
But now, the geometry tells a different story.
THE CHARTS 📐
Both charts use the same natural scaling:
1° of time = $1 of price per unit.
And here’s the critical observation:
NVDA has broken beneath its 1° angle.
AVGO has recaptured and accelerated above its 1° angle.
AVGO has already made new all-time highs.
During a semiconductor correction.
While SMH was down.
While the S&P 500 retraced.
The real question still remains however, are we still in the early innings of the AI Boom?
SMH — The Semiconductor Supercycle Update
The Structure That Defines the AI Era🏛️
The 2023–2027 channel is the master structure for this entire semiconductor cycle.
SMH bounced precisely where the primary and secondary angles intersect.
🚀 Market Knots — Speed & Acceleration Confirm the Turn
Speed found support precisely at the median line around 126 Market Knots — the natural mid-energy band where major long-term advances restart.
Acceleration appears to have:
🔻spiked,
📉bottomed, and
is now curling upward.
Poised to turn positive
The measurements point to a weekly bottom and another wave higher in this semiconductor cycle fueled by AI growth.
The Leadership Rotation🏅 (The Baton Moment)
AVGO is emerging as the structural leader of the AI supercycle.
It has already demonstrated exceptional strength:
holding its 1° angle, breaking into new all-time highs, and accelerating while the rest of the semiconductor sector underperformed.
This behavior is not random.
It reflects Broadcom’s unique position at the infrastructure core of AI — the networking, switching, optical, and custom ASIC layer that becomes the bottleneck after GPUs.
As the semiconductor supercycle builds, AVGO steps forward as the defining leader of the AI boom
Will Nvda crash the AI bubbleThis channel is not providing individualized trading or investment advice, nor is it a banking service, brokerage service, trading service, investment service or money management service

NVDA Put Alert | QuantSignals V3: Katy AI Predicts Short-Term
Signal Type: 1-Month Prediction (QuantSignals V3)
Date: 2025-11-26
Current Price: $180.19
Predicted Price: $177.34 (-1.58%)
30-Min Target: $178.91 (-0.71%)
Trend: Bearish
Confidence: 60.6%
Volatility: 16.7%
Trade Signal: PUT
Entry: $180.19
Target: $177.91
Stop Loss: $182.89
Expected Move: -1.58%
Analysis Summary:
Katy AI predicts a short-term downward trajectory.
Technical resistance near $182.89 acts as stop loss level.
Moderately high confidence (60.6%) indicates some caution is warranted.
Volatility at 16.7% suggests moderate price swings.
Key Notes:
No additional trade signals; single-symbol analysis.
Ideal for traders looking for short-term bearish exposure.
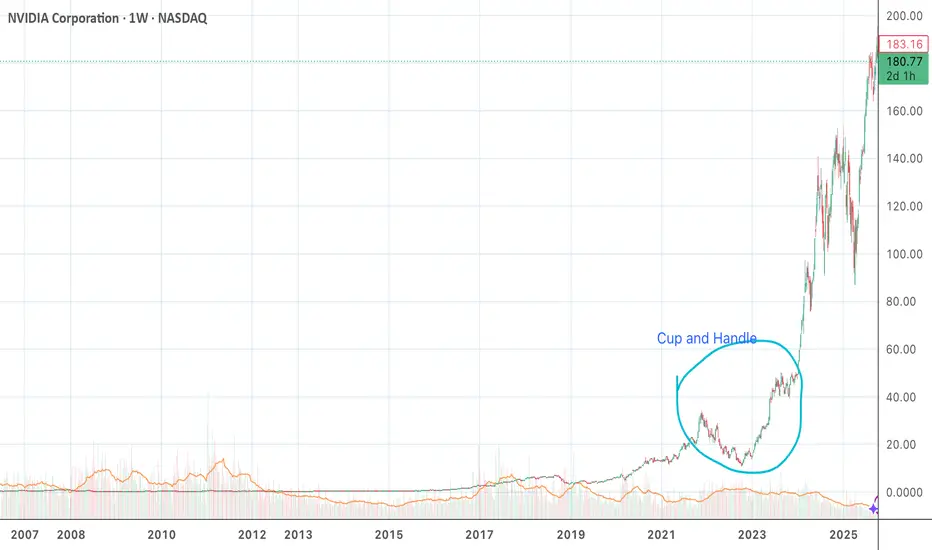
NVIDIA Cup and HandleThe cup and handle is a bullish continuation pattern in technical analysis that signals a potential uptrend after a period of consolidation.
It consists of two parts: a rounded, "U-shaped" cup, and a smaller, downward-sloping handle that forms on the right side of the cup.
Traders look for a breakout above the handle's resistance level, often accompanied by a spike in volume, to confirm the pattern and enter a long position.
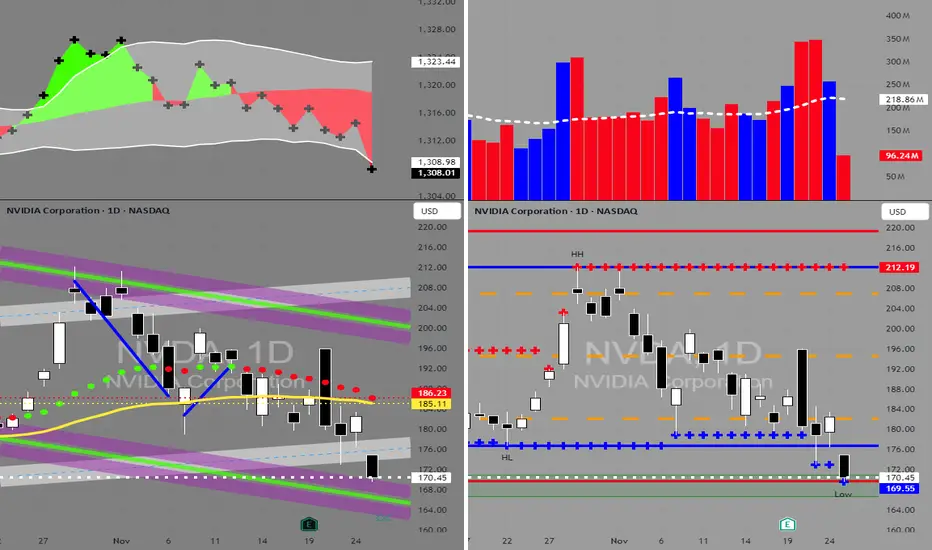
NVDA in BUY ZONEMy trading plan is very simple.
I buy or sell when at either of these events happen:
* Price tags the top or bottom of parallel channel zones
* Money flow volume spikes beyond it's Bollinger Bands
So...
Here's why I'm picking this symbol to do the thing.
Price in buying zone near bottom of channels
Money flow momentum is spiked negative and under bottom of Bollinger Band
Entry at $170
Target is moving average at $185
Looking to catch a quick bounce this week.
Will be buying as low as $167.
Set your own stop.
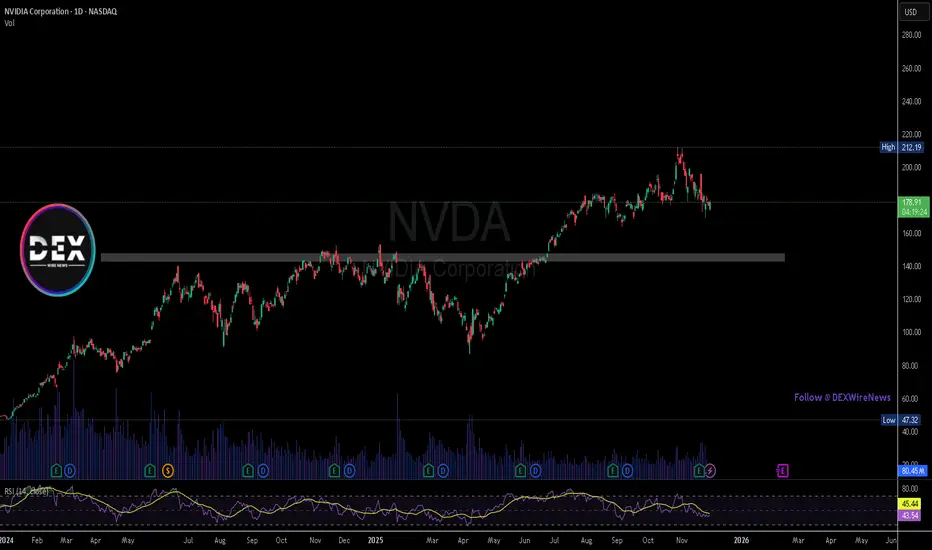
Nvidia plummeted amid the threat of competition from GOOGL
Optimism surrounding the Gemini 3 and news that Alphabet (GOOGL) will internally supply its TPUs to Meta Platforms (META) supported the AI rally. On the other hand, Nvidia (NVDA) experienced a significant decline due to concerns over the potential GOOGL threat.
Mizuho noted that the "Google wins, OpenAI/Nvidia loses" trade is gaining traction, accelerating the sell-off in OpenAI-related stocks like NVDA and Oracle (ORCL).
Meanwhile, the US administration's decision regarding the allowance of NVDA's H200 chip sales to China remains a potential positive catalyst for future NVDA stock prices.
NVDA briefly fell below the support at 173.00 after breaking below the ascending trendline. Diverging bearish EMAs indicate a potential extension of the downtrend.
If NVDA breaks below 173.00 again, the price could further decline to the next support at 164.50.
Conversely, if NVDA closes above 182.50, the price may advance toward the following resistance at 190.00.

NVDA Hagia Sophia CRACKING! CAUTION!NVDA is starting to fall apart. Nice rounding top followed by mini towerspike (as shown in the picture) that is now starting to roll over.
The price was rejected after the first crack that bounced lower. That's the big warning CRACK! Now we wait for the bigger CRACK! to occur.
Despite how small it looks on the chart, the reality is that NVDA has lost 20% or 1/5 of its total value already.
There is only so much B.S. they can come out and say to pump the stock. Eventually, that dies off along with the stock.
Remember! Circular financing is flat-out illegal because it fabricates the appearance of real demand, real capital, or real creditworthiness when none actually exists. It’s the financial version of forging a signature. This administration has gutted the SEC, and no one will dare call it out for what it is in AI. But the markets will always correct for theivery in the end.
NVDA should never have gotten this high. But that is the beauty of Reflexivity. We should all be used to it by now.
Eventually, it will all come crashing down. I hope not with you in it. I urge caution to the bulls!
THANK YOU for getting me to 5,000 followers! 🙏🔥
Let’s keep climbing.
If you enjoy the work:
👉 Boost
👉 Follow
👉 Drop a solid comment
Let’s push it to 6,000 and keep building a community grounded in truth, not hype.
