Your Playbook for Deep Corrections: Top Seven Things to KnowEvery trader hopes that whatever is happening with any pullback is healthy. “Just a healthy retreat, it’ll go back, it always does. R-r-right?”
While that’s true (obviously, markets had always shot up to records after deep losses), your job is to survive that lower leg and ideally come out stronger than before.
Because sometimes the market doesn’t correct immediately. It drops, turns around, drops some more and doesn’t ask you how you’re doing.
Where are we in the valuation cycle now? In the “Is this AI thing a bubble” talks.
With stocks stretched, AI valuations orbiting Saturn, and Nvidia NASDAQ:NVDA dictating the market’s fate, investors are starting to ask: What happens if this thing unwinds… fast?
A deep correction shakes your portfolio like nothing else, ultimately putting your strategy (and sanity) to a test. That's why you must know how to deal with correction ( if when it comes).
Here’s your playbook. Seven things every trader should know when markets get serious.
⚡️ 1. Know What’s Driving the Tempo
Right now, the tempo-setter isn't in the economic calendar (but good to keep an eye on it). It's not gold, the US dollar, oil prices, or consumer sentiment.
It’s Nvidia NASDAQ:NVDA
The stock has shot to stratospheric levels, climbing with such force that the entire market now reacts to its every earnings forecast, capex comment, and Jensen Huang metaphor about the "virtuous cycle of AI.”
When a single company starts steering the market’s mood, you know the stakes are high. Nvidia’s rise has been spectacular. Its potential fall could also be spectacular.
If there’s a crash in the current market, undoubtedly tech goes first, and AI-tied shares are poised to lead the plunge. Not because the companies are bad, but because valuations are sky-high, crowded, and pumped by shady-looking multi-billion-dollar deals.
🧨 2. Sky-High Valuations Fall the Hardest
AI has been the market’s darling. And like any hot market corner, the exit door gets crowded when the music stops.
These stocks work great in a liquidity-rich, momentum-heavy environment. But in a deep correction, they can drop first and fastest.
Why?
They’re relatively expensive.
They’re owned by institutions (by boatloads).
They’re deeply intertwined with leverage.
When selling starts, it spreads: chips, software, cloud. Really anything with “AI initiative” mentioned in the last five earnings calls.
If the correction deepens, correlations go to 1 , and “diversification” starts to feel like a theoretical concept.
🧺 3. Staples Can Survive. But Aren’t Safe.
What tends to hold up in a downturn?
Companies that produce things people buy every day.
Coca-Cola NYSE:KO , Procter & Gamble NYSE:PG , Walmart NYSE:WMT , Costco NASDAQ:COST . These are the boring giants who don’t need AI hype to sell toothpaste, detergent, and caffeine.
But here’s the catch.
When tech crashes, fund managers don’t just sell tech.
They sell everything with liquidity to buy the tech names they've been waiting to own at a discount.
That includes consumer staples. Even the defensive darlings can get dumped to fund someone’s impulsive “NVDA is finally cheap!” moment.
🧭 4. Corrections Have Phases. Know Which One You’re In.
Corrections tend to move in waves:
Denial: “This is just a dip.”
Realization: “This is not a dip.”
Capitulation: “Sell everything.”
Bargain hunting: “Wait… everything is on sale.”
Recovery: “We survived. Buy up!”
Don’t confuse early weakness with late-stage panic.
Ideally, you want to buy when everyone else is emotionally unavailable, not when they’re still debating if it’s a pullback or an opportunity.
📊 5. Liquidity Matters More Than Fundamentals
In a deep correction, fundamentals usually take a backseat.
Everything becomes about liquidity.
Who needs cash?
Who has margin calls?
Who needs to rotate?
Which institutions need to de-risk?
This is why great companies drop alongside mediocre ones.
Liquidity can trump logic.
Market structure can trump valuation.
And algos don’t care that you really like that stock long-term.
🧘♂️ 6. Your Mindset Is a Position Too
Corrections can provoke every trading impulse, especially if they're steep and you expect a quick rebound:
Revenge trades
Over-leveraged dip buying
Premature bottom-calling
The hardest thing during a deep correction isn’t predicting the bottom, but not losing your head (and cash) before the bottom arrives.
Pro traders work with a few rules that help them avoid emotional decision making:
Pre-set drawdown limits
Scaling entries
Non-negotiable stop-losses
Portfolio hedges
Cash as an asset
If you don’t have a playbook before the drop, you’ll be writing one during the drop.
🛒 7. Buy the Best, Not the Loudest
When markets crack, everything goes on sale, everyone knows that.
Before you go bargain hunting and deep discount shopping, prioritize:
Cash-generating giants
Companies with pricing power (and moat)
Firms selling essentials in whatever industry
Businesses that don’t rely on hype to survive
🧾 The Takeaway
A deep correction may not be the end of the world, but it could be the market’s way of redistributing opportunity.
Nvidia and the AI titans have been running the show. And they’ll likely lead any sharp selloff.
And yes, even your safe, boring consumer staples can get dragged into the downside.
But corrections create clarity. They separate narrative from value, hype from durability, and momentum from substance.
If you stay disciplined, patient, and unemotional, a correction becomes less of a threat and more of a roadmap, pointing you toward assets worth owning when the next bull run begins.
Off to you : What’s your take on the current market situation? Do you see a bubble in the works, ready to go pop? Or it’s all looking fine and dandy, no reason for caution?
Trade ideas

NVDA at a Critical Breakdown. Bounce Coming or Flush to $175NVDA at a Critical Breakdown Zone – Bounce Coming or Full Flush Below $175? 🔥
Weekly Trend (Big Picture)
NVDA’s weekly chart just did something important:
✅ Broke below the long-term rising structure
✅ First real weekly lower high since the major uptrend started
✅ Strong selling wick at the top
This shift tells us momentum is no longer purely bullish. Buyers lost control near $220–$230, and the weekly now leans corrective, not trending.
Key weekly support: $176–$180
This is where the prior trendline, demand, and volume cluster meet.
If NVDA loses this zone on a weekly close → the next major weekly demand isn’t until $160–$165.
Daily Structure
The daily makes the story even clearer:
* Multiple CHoCH signals (trend weakness)
* Failed continuation after breakout attempt
* Price rejecting the daily bearish order block around $198–$205
* Holding inside a large daily demand zone $175–$182
This is the final defense for bulls.
As long as NVDA holds $176–$180 on the daily, we can see:
➡️ Relief bounce toward $187–$192
➡️ Possibly $198 retest
But if $176 breaks…
➡️ Daily breakdown
➡️ Clean air to $165
➡️ Fast move likely
1-Hour View (Trader Timing)
The 1H structure is currently:
* Downtrend channel
* Lower highs
* Multiple failed bounces
* Buyers defending the green demand block $177–$182
Short-term, this is range to down, but oversold enough for intraday bounces.
Best actionable levels:
✅ Long scalp only if price holds above $180 → target $184–$187
❌ Avoid longs below $179
📉 If $176 breaks → expect momentum selling toward $170–$165
GEX (Options Positioning Signal)
This is the key confluence.
GEX shows:
🔴 PUT dominance
🔴 Highest negative exposure at $175
🟥 Strong PUT support wall below $175
🟢 Light CALL interest above $188–$195
What this means:
Institutions are positioned for downside or pinning around $175–$180.
If price cracks $175, dealers flip into accelerated selling → this is where the flush to $165 can trigger quickly.
If price holds above $180 and pushes toward $187+, GEX shifts to neutral and a bounce can develop.
My Thoughts
NVDA is the opposite of AAPL and GOOGL right now.
Those are pushing highs with momentum.
NVDA is:
* Weakest of the big names
* Losing trend structure
* Sitting on final support
* Option flow leaning bearish
This usually leads to:
🔥 Either a violent bounce
🔥 Or a breakdown flush
No middle.
Direction Summary
Bullish scenario:
Hold $180 → push into $187–$192
Bearish scenario (higher probability if $176 breaks):
Break $176 → unwind to $165 fast
Disclaimer:
This analysis is for educational purposes only and does not constitute financial advice. Always do your own research and manage your risk before trading.

NVDA Hagia Sophia CRACKING! CAUTION!NVDA is starting to fall apart. Nice rounding top followed by mini towerspike (as shown in the picture) that is now starting to roll over.
The price was rejected after the first crack that bounced lower. That's the big warning CRACK! Now we wait for the bigger CRACK! to occur.
Despite how small it looks on the chart, the reality is that NVDA has lost 20% or 1/5 of its total value already.
There is only so much B.S. they can come out and say to pump the stock. Eventually, that dies off along with the stock.
Remember! Circular financing is flat-out illegal because it fabricates the appearance of real demand, real capital, or real creditworthiness when none actually exists. It’s the financial version of forging a signature. This administration has gutted the SEC, and no one will dare call it out for what it is in AI. But the markets will always correct for theivery in the end.
NVDA should never have gotten this high. But that is the beauty of Reflexivity. We should all be used to it by now.
Eventually, it will all come crashing down. I hope not with you in it. I urge caution to the bulls!
THANK YOU for getting me to 5,000 followers! 🙏🔥
Let’s keep climbing.
If you enjoy the work:
👉 Boost
👉 Follow
👉 Drop a solid comment
Let’s push it to 6,000 and keep building a community grounded in truth, not hype.

Nvidia - Now is the time to go short!💣Nvidia ( NASDAQ:NVDA ) is now creating a top:
🔎Analysis summary:
Just a couple of days ago, Nvidia perfectly retested a major resistance trendline. Always in the past, such a retest was followed by a major move towards the downside. Therefore, Nvidia is preparing for a major drop, which could lead to another -25% drop in the future.
📝Levels to watch:
$180 and $140 and $100
SwingTraderPhil
SwingTrading.Simplified. | Investing.Simplified. | #LONGTERMVISION

Midterm Stock Forecast for NVIDIANASDAQ:NVDA shows weakening momentum after its extended rally, with H1 structure signaling a corrective phase. A drop from $178 toward $150 aligns with cooling AI-driven sentiment and stretched valuation multiples. Fundamentally the long-term demand for GPUs remains strong, but midterm pricing pressure and slowing data-center spending could weigh on sentiment. A retracement to $150 would reset indicators and create a healthier base for long-term buyers.

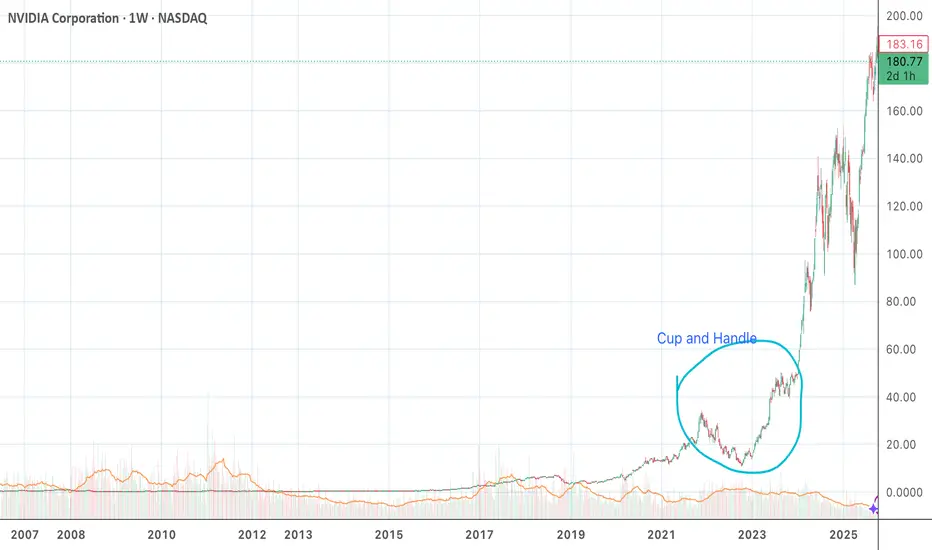
NVIDIA Cup and HandleThe cup and handle is a bullish continuation pattern in technical analysis that signals a potential uptrend after a period of consolidation.
It consists of two parts: a rounded, "U-shaped" cup, and a smaller, downward-sloping handle that forms on the right side of the cup.
Traders look for a breakout above the handle's resistance level, often accompanied by a spike in volume, to confirm the pattern and enter a long position.
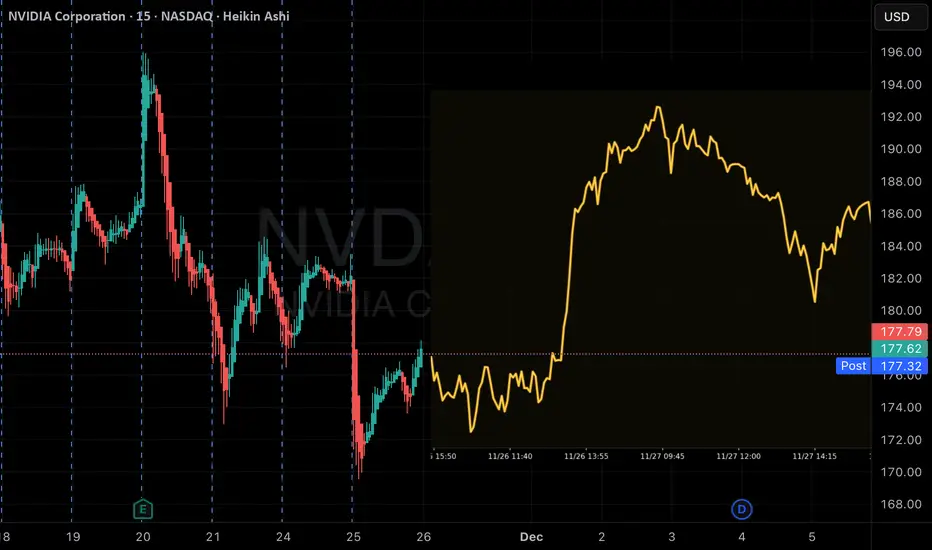
Nvidia Earnings Finally Ease Market Jitters. Are AI Bulls Back?It’s confirmed. This is Nvidia’s stock market and we all live in it.
Nvidia NASDAQ:NVDA reported yet another record-breaking quarter, instantly soothing market nerves after a week filled with talks of “AI bubble,” “valuation fever,” and “maybe Michael Burry is right again.” It was the cherry of the earnings season .
The chipmaking giant announced $57 billion in sales during the most recent quarter.
The figure is up 62% year-over-year and way above estimates. In other words, Nvidia didn’t just calm the market. It kicked the door open and shouted: “Get in losers, we’re going shopping.”
CEO Jensen Huang was even more enthusiastic, declaring that “AI is going everywhere, doing everything, all at once.” In classic Huang fashion, you could almost smell the leather jacket.
💽 Data Center Demand: Still Insatiable
Let’s cut to the headline number: $51.2 billion in data-center revenue. Analysts expected $49 billion. Nvidia delivered more.
The company’s new Blackwell GPUs, described by Huang as “off the charts” when it comes to demand, continue to fly off the production line the moment they’re made.
Quarterly net income hit a whopping $31.9 billion, up 65% from the year prior. At a time when most companies celebrate single-digit percentage growth, Nvidia is casually stacking double and triple digits.
📈 Markets Exhale, Futures Soar
The relief was immediate and widespread. You could say that Nvidia’s earnings are not just earnings anymore, but a macro signal.
Here’s what the picture looked like after the release:
CoreWeave NASDAQ:CRWV jumped 10%
Futures tied to the Nasdaq NASDAQ:IXIC climbed 2%
Every Magnificent Seven stock flashing green
Investors had been waiting for confirmation that the AI boom still had room. And Nvidia delivered enough reassurance to light up the entire tech complex.
“Okay. Maybe we don’t need to rotate into utilities just yet,” every tech bro, probably.
😬 The Stakes Were High. Really High.
The reaction, though, must be taken within the current context. Over the past few weeks, tech stocks were hit by deep selloffs as markets fretted over the same question: “Is AI too expensive?”
Between skyrocketing capital expenditures, absurdly ambitious data-center budgets, and the kind of spending plans that would make even sovereign wealth funds blush, investors wondered whether Big Tech was building an AI future or an AI money pit.
Even Michael Burry stepped in, revealing positions betting against Nvidia NASDAQ:NVDA and Palantir NASDAQ:PLTR . That move alone sent pockets of the market into a philosophical crisis.
After all, that’s the guy from “The Big Short” and he’s hedged against your favorite trade.
🤖 So… Are the Bulls Back?
Maybe. For now at least. But with conditions.
Nvidia’s stock more than doubled between April and late October, only to slide in recent weeks as bubble fears thickened. Year to date, the stock is still up about 30%.
Nvidia’s numbers prove that AI spending is still accelerating. But the broader question remains: Can companies actually turn those massive AI investments into profit?
Nvidia’s blowout quarter just reset the narrative:
AI demand is still real
Spending is justified
The cycle is still “virtuous,” in Huang’s words
After this earnings print, the bull case has something it desperately needed: momentum.
And momentum is a powerful thing, especially in a market that had started to doubt its favorite story.
Off to you : Do you still see room for growth in the AI space? Or is that rebound a short-term reflex? Share your views in the comments!

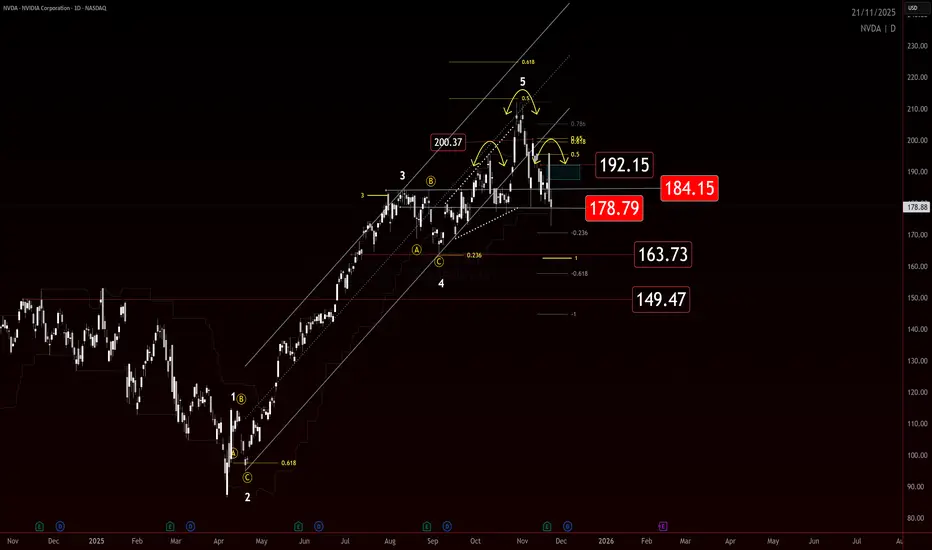
NVIDIA Trading plan from $100 to $1000. Is it plausible?Exactly a month ago, we called the end of the rally on NVIDIA Corporation (NVDA), essentially the end of its multi-year Bull Cycle and the beginning of an aggressive Bear Cycle correction.
** The 10 year Channel Up **
So far this is paying dividends as the stock just completed a 4-week red streak. The essence of NVIDIA's trend has been a decade long Channel Up, as you can see on this chart and that's the basis of all the buy entries and sell exits we've made over the years.
** Bull and Bear Cycles **
Since early 2025, the stock started that Channel Up, whose first Bull Cycle (as well as the next ones with the exception of one breaking) was supported by the 1W MA50 (blue trend-line). Once that Bear Cycle (in the form of the Channel's Bullish Leg) ended, the subsequent Bear Cycle (Bearish Leg) broke below both the 1W MA50 and 1W MA100 (green trend-line) and bottomed exactly on its 1W MA200 (orange trend-line), marginally above the 0.382 Fibonacci retracement level.
The following Bull Cycle as well as the Bear Cycle followed the same structure only, the bottom was this time marginally below the 0.382 Fib. Then the Bull Cycle that just ended started, with only basic difference that its early 2025 correction broke below the 1W MA50 but found Support on the 1W MA100. Every Bull Cycle had such pre-Top correction (blue ellipse). Note also that this last Bull Cycle as been the strongest Leg on +1881% rise and the one before it, the 'weakest' at +1004%.
** The RSI **
Notice also that the 1W RSI has made the same Double Top rejection pattern on the Lower Highs Zone that both previous Bull Cycle Tops did. Strong confirmation therefore of the emerging Bear Cycle.
** The next bottom **
Technically, we expect the market to bottom yet again on the 1W MA200, which by a fair projection of its current trajectory, we expect that to be around $100. That would still be considerably above the 0.382 Fib, which can only get hit if the Bear Cycle falls very aggressively. Note here that historically within this Channel Up, the most optimal buy signal was given when the 1W RSI hit 42.00. Use that in combination with the 1W MA200.
** Future Targets **
So after the Bear Cycle bottoms, what Target can we pursue? Well the 'minimum' projection based on the 2.618 Fibonacci extension of the Bull Cycle that just ended is $700. At the same time, if it rises by again the 'minimum' % of the weakest +1004% Bullish Leg of the Channel, we are looking potentially at a 4-year Target of $1100. It is also worth noting the valuable use of the Sine Waves that have so far accurately grasped the peak formations of the Bull Cycles. We can use this to time our market exits in 2029.
Realistic or not subjectively, the $100 to $1000 path is what the pure technicals and historical data support and clearly show is a very likely probability for a long-term investment.
---
** Please LIKE 👍, FOLLOW ✅, SHARE 🙌 and COMMENT ✍ if you enjoy this idea! Also share your ideas and charts in the comments section below! This is best way to keep it relevant, support us, keep the content here free and allow the idea to reach as many people as possible. **
---
💸💸💸💸💸💸
👇 👇 👇 👇 👇 👇

$NVDA Structure keeps improving for a move lower.Just added to my NASDAQ:NVDA short.
Structure keeps improving for a move lower.
And the competitive pressure is real:
NASDAQ:GOOGL ’sTPU stack is becoming a legitimate alternative to Nvidia for training/inference.
11/25/25 - $NVDA - Norms gonna norm11/25/25 :: VROCKSTAR :: NASDAQ:NVDA
Norms gonna norm
- there are basically two things that you can own in this world
- AI and L1s (BTC and ETH)
- in AI landia, there's the king
- you own the kings
- "yuh but V google's making chips". yes. so does AMD... AVGO... MRVL...
- fade the norms. 25x PE for NVDA, laughably easy at this pt.
- higher.
V

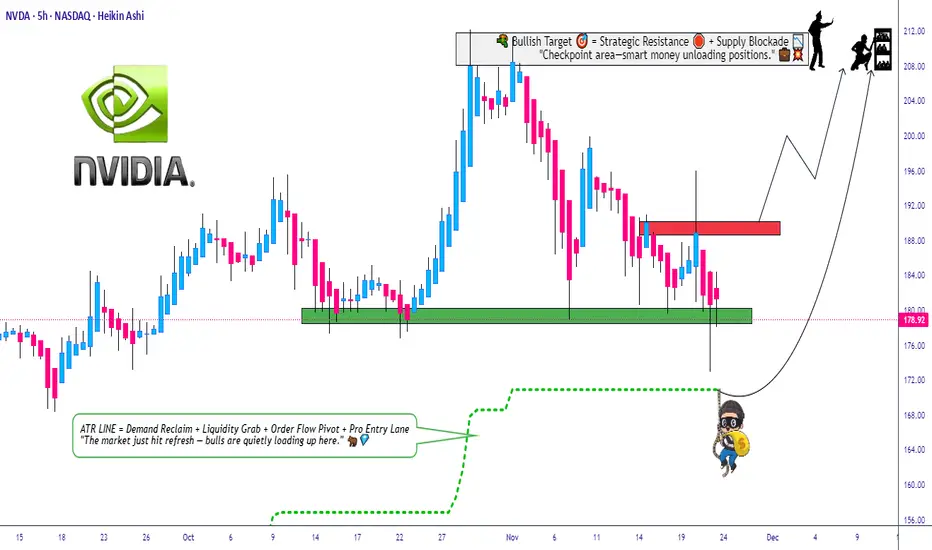
Can NVDA Hold the Pullback Zone and Extend the Uptrend?🔥 NVDA Bullish Pullback Playbook – Thief-Style Swing Setup 🚀🕵️♂️
Hey traders & my fellow Thief OG’s 😎🕶️ — here’s a clean, polished, TradingView-friendly version of my NVDA Swing Trade Playbook with a professional + funny touch. Let’s get to the setup 👇🔥
📌 Asset
NVDA – NVIDIA Corporation (NASDAQ)
Swing Trade | Momentum | Trend-Following Setup
📈 Plan: Bullish Pullback Strategy (Pending Orders Active)
The trend is strong, the buyers are steady, and NVDA is still delivering clean higher-lows. We're waiting for either a breakout continuation or a discounted pullback entry. 📊⚡
🎯 Entry Zones
1️⃣ Breakout Entry – Momentum Thief Mode 🥷⚡
Enter after clearing the nearest resistance at $191.00
• Clean breakout
• Volume confirmation
• Trend continuation strength
2️⃣ Pullback Entry – SuperTrend ATR Sniper Entry 🎯📉
Watch for a discounted pullback near $170.00 around the SuperTrend ATR zone.
• Trend support retest
• Lower-risk entry
• Ideal for swing traders who wait for “patience-pays entries” 😎
🛡️ Stop-Loss (Thief Style – Risk First)
Breakout Entry SL → $180.00
SuperTrend Pullback SL → $160.00
Note: Dear Ladies & Gentlemen (Thief OG’s) ❤️
I’m NOT recommending you use only my SL. Choose your own levels — you make the money, you protect the money. Trade at your own risk 🔐⚠️
🎯 Target (Take-Profit Zone)
Our target → $210.00
Why?
• Strong resistance zone
• Overbought region historically
• Buyer trap zone where police force 🚔👮♂️ usually waits — so escape with profits early 😂💨
Note: Dear Ladies & Gentlemen (Thief OG’s) 🙌
I’m NOT recommending you set my TP only. Choose your own TP — your money, your exit. Trade with responsibility 💼💰
🔍 Related Pairs to Watch (Correlation Insights + Key Notes)
NASDAQ:AMD
• High positive correlation with NVDA
• When AMD shows volume expansion, NVDA often follows
• Good for momentum confirmation 🔥
NASDAQ:SOXX (iShares Semiconductor ETF)
• NVDA is a major weighted component
• ETF direction confirms big-money flow 🧠💸
• Great for spotting sector-wide risk-on / risk-off shifts
NASDAQ:QQQ (NASDAQ 100 ETF)
• NVDA is one of the heaviest weights
• If QQQ trends strongly → NVDA often mirrors
• Macro sentiment index for tech strength 📊⚡
NASDAQ:SMH (VanEck Semiconductor ETF)
• Clean supply/demand signals
• NVDA mirrors SMH breakouts frequently
• Helps confirm breakout validity before taking the trade
All these help you avoid fakeouts and align with overall semiconductor market strength.
✨ “If you find value in my analysis, a 👍 and 🚀 boost is much appreciated — it helps me share more setups with the community!”
⚠️ This is a thief-style trading strategy created just for fun. Trade responsibly.
NVDA Cooked!?If you find this information inspiring/helpful, please consider a boost and follow! Any questions or comments, please leave a comment!
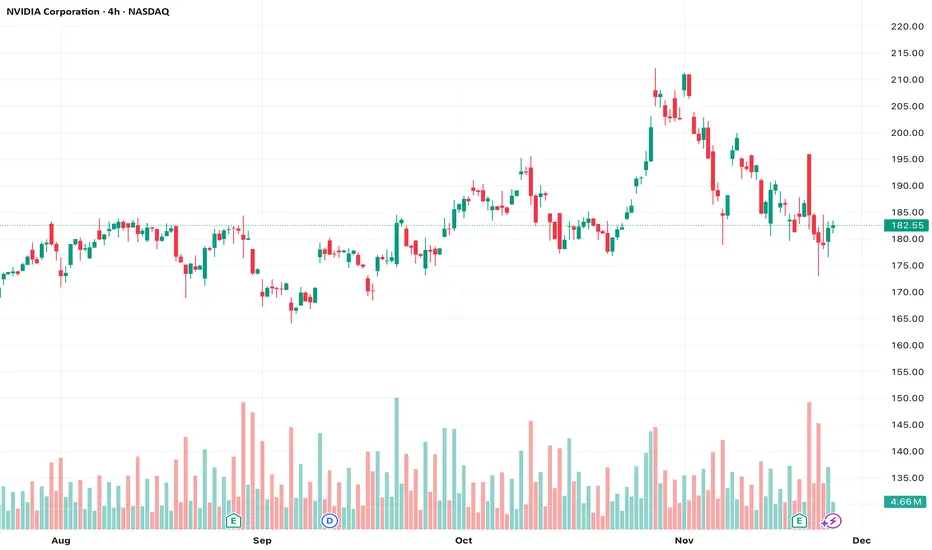
NVDA Price Action Update: Key Levels To Watch
NVDA is cooked if it cannot reclaim the key levels overhead. Price is currently testing 178 and this area is critical for determining whether buyers still have any momentum left.
To flip this structure back upward, NVDA needs an impulse through 178 and then 184. Anything that retraces in a choppy or corrective manner within the impulsive range from 195 is suspect and suggests continuation lower.
If buyers fail to generate an impulsive move from here, the downside levels below come back into play. Seller control increases with every failed retest and every weak bounce.
This is a simple structure play. Impulsive strength is required to shift control. Corrective behavior keeps the door open for further decline.
Trade safe and trade clarity.
NVDA vs. The Narrative: Why I’m Holding Through the NoiseWhile headlines scream "bubble" and Michael Burry loads up on short positions, I’m doubling down on what the charts are actually saying — not the fear-based narratives. This post is for those who trust price structure, volume psychology, and timeframe alignment over media noise. Let’s dive in.
Chart Structure Speaks Louder Than Opinions
Across all timeframes — from 4H to 6M — NVDA and the broader S&P are forming morning star dojis, a powerful reversal signal. These candles are whispering accumulation. Retail isn’t listening. Smart money already has.
Key Observations:
SPY & SPXL (S&P 500 ETFs): Forming higher lows with bullish fib retracements holding tight. No sign of weakness, despite Burry’s apocalyptic tone.
NVDA (NASDAQ):
The 6M chart shows clear magnet zones at 212 and 392.
An unfilled liquidity gap from the 390s is now acting as a gravitational pull — price will revisit it.
Every timeframe confirms this momentum is building for a breakout, not breakdown.
NVDA/USD Confluence: Mirrors the NVDA/NASDAQ structure almost 1:1. This correlation across instruments adds major conviction to the thesis.
Psychology Check: Why I Disagree with Michael Burry
Burry may be shorting because of macroeconomic risk. Or, maybe he’s playing the same game Melvin Capital did — betting retail will panic.
But I believe he’s underestimating the AI revolution, semiconductor demand, and the market’s memory of missed upside in prior decades.
The dot-com boom had hype, yes — but this has utility. AI isn’t a buzzword anymore. It’s infrastructure. And NVDA is at the core.
Liquidity will return. The market will wake up. And those who held the line will reap the rewards.
Final Words:
The media lies. Liquidity hides. But candlesticks don’t fake structure.
If NVDA fills its liquidity magnet, hits prior highs, or simply rides the S&P's tide — the upside is mathematically undeniable.
To those holding — congratulations.
To the bears — good luck.
To Burry — you might be early, but you might also be wrong.
- MoNí

Analysis of the Nvidia (NVDA) Share ChartAnalysis of the Nvidia (NVDA) Share Chart
Last week, we published a post titled “Ahead of Nvidia’s (NVDA) Earnings: How the Price Could Move”, in which we:
→ Drew an ascending channel (shown in blue);
→ Suggested that market participants’ overly high expectations would likely not be met when earnings were released, leading to a decline in NVDA’s price towards the lower boundary of the ascending channel, where support lies at $165.
In reality, the earnings report turned out to be very strong:
→ Gross revenue: actual = $57bn, forecast = ~$54.9bn.
→ Earnings per share (EPS): actual = $1.30, forecast = $1.26 (previous quarter = $1.05).
The surge in price with a bullish gap towards point A reflected the initial reaction to the strong figures, but the share price then began to fall (reaching a two-month low), thereby confirming our expectations.
Technical Analysis of the Nvidia (NVDA) Chart
An analysis of NVDA’s price action suggests that the current situation can be viewed as a correction (shown with red lines), forming within an expanded ascending channel.
If NVDA’s share price declines towards the $165 level, where the lower boundary of the channel lies, this could encourage the bulls to attempt to resume the 2025 uptrend and mount a new push towards the psychological $200 mark.
This article represents the opinion of the Companies operating under the FXOpen brand only. It is not to be construed as an offer, solicitation, or recommendation with respect to products and services provided by the Companies operating under the FXOpen brand, nor is it to be considered financial advice.

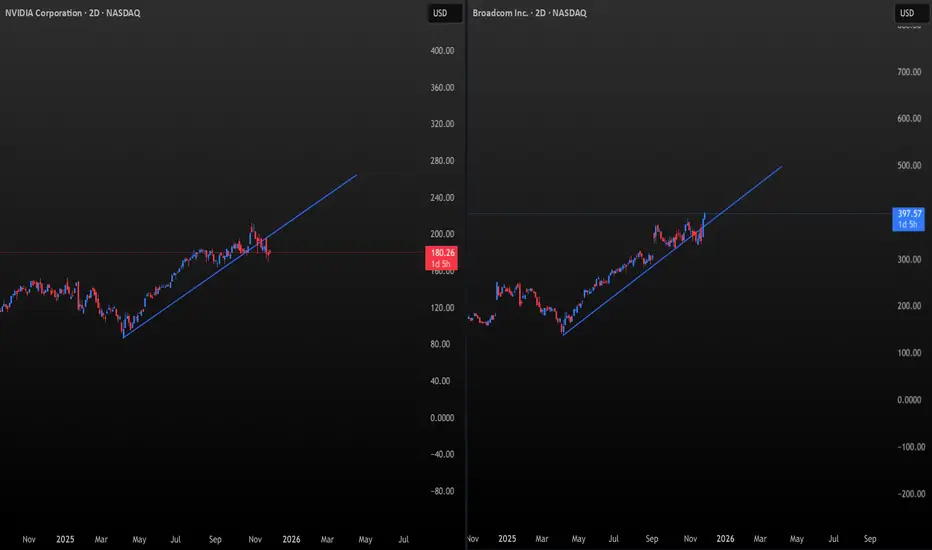
NVDA vs AVGO: The Battle for the AI Throne Has Begun⚡A New Leader Emerges in the Semiconductors
For years, NVDA was the undisputed titan — the gravitational center of the semiconductor universe.
But now, the geometry tells a different story.
THE CHARTS 📐
Both charts use the same natural scaling:
1° of time = $1 of price per unit.
And here’s the critical observation:
NVDA has broken beneath its 1° angle.
AVGO has recaptured and accelerated above its 1° angle.
AVGO has already made new all-time highs.
During a semiconductor correction.
While SMH was down.
While the S&P 500 retraced.
The real question still remains however, are we still in the early innings of the AI Boom?
SMH — The Semiconductor Supercycle Update
The Structure That Defines the AI Era🏛️
The 2023–2027 channel is the master structure for this entire semiconductor cycle.
SMH bounced precisely where the primary and secondary angles intersect.
🚀 Market Knots — Speed & Acceleration Confirm the Turn
Speed found support precisely at the median line around 126 Market Knots — the natural mid-energy band where major long-term advances restart.
Acceleration appears to have:
🔻spiked,
📉bottomed, and
is now curling upward.
Poised to turn positive
The measurements point to a weekly bottom and another wave higher in this semiconductor cycle fueled by AI growth.
The Leadership Rotation🏅 (The Baton Moment)
AVGO is emerging as the structural leader of the AI supercycle.
It has already demonstrated exceptional strength:
holding its 1° angle, breaking into new all-time highs, and accelerating while the rest of the semiconductor sector underperformed.
This behavior is not random.
It reflects Broadcom’s unique position at the infrastructure core of AI — the networking, switching, optical, and custom ASIC layer that becomes the bottleneck after GPUs.
As the semiconductor supercycle builds, AVGO steps forward as the defining leader of the AI boom
I guess it is a bubble...When the CEO is selling, the CFO is selling, SoftBank is unloading, Peter Thiel is selling, and Michael Burry is short, you have to stop and ask the only question that matters:
Is it actually smart to buy the dip here?
I didn’t even bother checking the latest SMH holdings, but if anyone wants to post the updated weightings, it would help frame how much passive-flow risk still sits above price.
The real question is whether there’s room left on the downside and whether this is anywhere near a bottom. If you want an example of how low “too low” can go, just study META during its unwinding. Fundamentals didn’t matter. Valuation didn’t matter. Price just kept repricing until forced sellers were done.
The one positive about this environment is volatility. When liquidity thins out and ranges widen, both sides can pull money out — but only if you treat it like a scalp environment, not a swing-long hero trade.
Because think about it rationally:
Do you want to be the one buying while billionaires, insiders, and institutions are selling into strength?
We’re moving into year-end — historically the period where funds clean books, tax-loss harvest, and unwind risk. Pair that with the probability of crypto-liquidation bleed-through, and you can easily get a chain reaction. Markets don’t fall in straight lines; they fall like Jenga blocks, dominoes, or a card tower collapsing from the bottom up.
This isn’t doom posting — it’s just market structure.
Flow dictates direction, and right now the flow is one-directional.

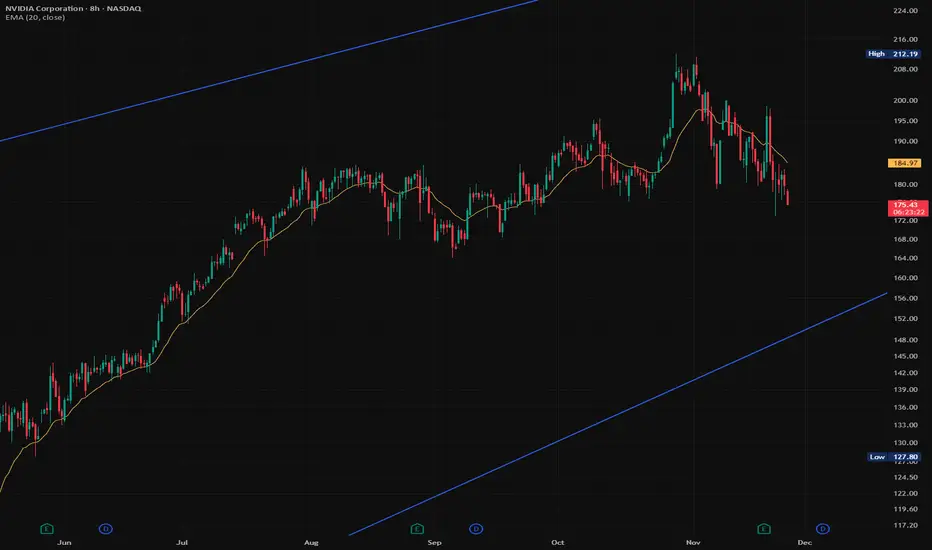
Nvidia likely to sell off throughout December 2025Nvidia has dominated 2025 with an exceptional upward trend, driven by relentless AI infrastructure demand. Recently, NVDA has finally broken below that steep up-channel — a signal that the stock may need a short-term cooldown before its next leg higher.
A retracement into the mid-$150 range would bring price back to a well-established support zone visible on the chart. This would represent a constructive pullback rather than a change in the long-term trend, especially heading into new product and AI-spending catalysts expected in early 2026.
For perspective: just three years ago, NASDAQ:NVDA was trading near $12 per share — a staggering +1,375% gain in only 36 months. Given that magnitude of appreciation, a modest pullback to $150 should be viewed as healthy consolidation rather than bearish pressure.

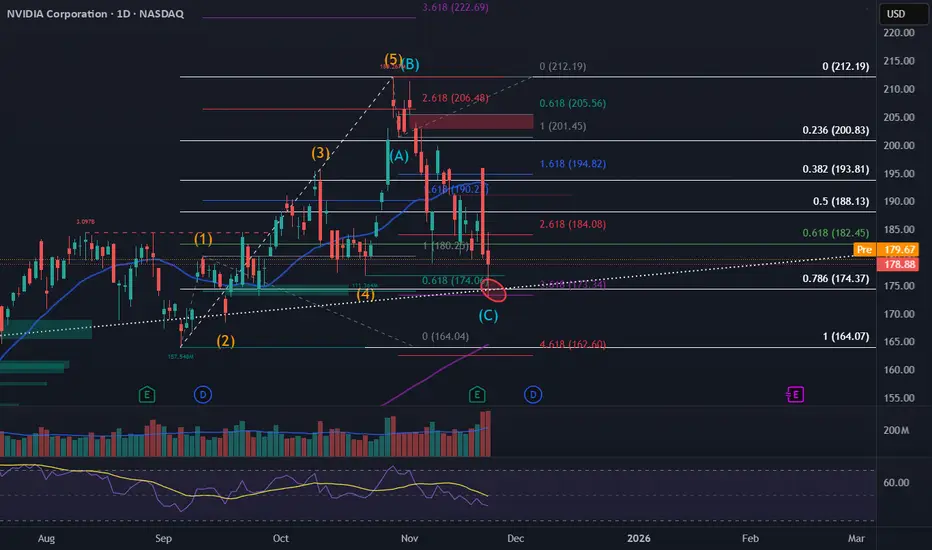
NVDA Corrective Structure Completing? Critical Fib & Trendline CNVIDIA is completing an ABC correction after the recent top. Price is now sitting on a strong support area around 174–177, where multiple Fibonacci levels and a long-term trendline meet.
If this zone holds, NVDA may start a new move up toward 182–194.
If it breaks below 174, deeper levels like 164 become possible.
Watching for a reaction here to confirm the next direction.
NVDA Katy AI Analysis – Neutral, Monitor for BreakoutNVDA QuantSignals Katy 1M Prediction – 2025-11-24
Current Price: $179.09
Final Prediction: $179.64 (+0.30%)
30-min Target: $179.46 (+0.20%)
Trend: NEUTRAL
Confidence: 55%
Volatility: 13.3%
⚠️ Trade Signal:
No trade generated – insufficient confidence and move size
🧠 Analysis Summary:
Katy AI shows minor upside but not enough for actionable entry
Low expected movement implies limited risk/reward opportunity
Traders may monitor for upcoming catalysts or volatility spikes

NVDA buy zone NVDA has had some bearish news recently despite very strong earnings. I believe this was the extent of the pullback and the stock has reached a local weekly demand zone. Given the multi year strength I doubt it pulls back to 130-140 but anything is possible. If I enter the trade here I’d be net long.

UIA Lite – Trend Structure Preview Release|Full Explanation of T⭐ UIA Lite – Trend Structure Preview Release|Full Explanation of T / E / H / X (Free Preview)
Hello everyone, this is UIA Institute.
We focus on developing clean, systematic, and repeatable market structure tools based on pure price action.
Today, we are releasing the UIA Lite – Trend Engine (Free Preview).
This preview showcases the four core structural events used in the UIA Trend Engine.
These four events form the “structural backbone” of a trend.
🔵 The Four UIA Structural Events (T / E / H / X)
T — Trend Start
Marks the beginning of a trend.
Price transitions from consolidation into a directional move.
E — Trend Extension
Confirms that the trend is healthy and continuing.
Often appears after a controlled pullback or continuation pattern.
H — Structural High / Low
Key swing points formed during the trend.
These are commonly used for scaling out or tightening risk.
X — Trend Exit / Reversal
Indicates that the trend has completed and the market may shift into
either sideways consolidation or a reversal phase.
These four events together define the life cycle of a trend.
🔵 What’s included in the Free Preview
To help more traders understand UIA’s structure-based methodology,
this Preview version focuses on:
Clean labeling of T / E / H / X
Minimal parameters
No prediction, no signals
100% price-action-based logic
Simple, transparent structural rules
The full version of UIA Lite will include additional filters,
higher-precision logic, and more stable structural mapping.
🔵 UIA Lite – Free Preview indicator link:
👉
Feel free to add it to your chart and experiment with it.
🔵 About UIA Institute
We are developing a complete structural analysis framework:
UIA Trend Engine (Trend Structure)
UIA Wave Engine (Swing Structure)
UIA TSX Engine (Early-Structure Signals)
Our philosophy is simple:
No prediction, no emotional trading, no over-indicator setups.
Only structure, rhythm, and repeatability.
**We welcome English-speaking users to join the discussion.
More UIA content will be released soon.**
Stocks Worth Your AttentionI wanted to share a list of high growth, high margin stocks that are worth looking into. This is where I pull a lot of my core positions from.
HIMS is noteworthy as it's also one of the most heavily shorted stocks at the moment and THE best performer on my ranking.
These stocks are essentially cash cows dominating their space. Please do look into each one carefully. This list is algo generated and not combed through by me yet. So make sure the stock's earnings and trend are to your liking.
Enjoy and good luck!

NVDA Weekly CALL Alert: Bullish Momentum + Extreme Options FlowNVDA QuantSignals V3 Weekly 2025-11-25
Ticker: NVDA
Signal Type: Weekly Options Setup (Expiry: 2025‑11‑28)
Direction: BUY CALLS
Confidence: 65% (Medium conviction)
Strike Focus: $177.50
Entry Range: ~$2.55
Target 1: ~$4.08
Stop Loss: ~$1.53
Weekly Momentum: Neutral (+0.59% 1W)
Options Flow / PCR: Bullish (PCR ~0.37)
Risk Level: Moderate — trending strength plus overbought indicators
🧠 Key Technical & Chart Insights
According to TradingView’s technical ratings, NVDA is currently neutral, with short‑term signals mixed and the 1‑week rating showing a prevailing buy trend.
TradingView
On the chart:
Price is trading around ~$176.71 in your system, above a recent support at ~$174.05.
Weekly momentum is neutral but 2‑week trend is bullish (+2.91%), suggesting underlying upward drift.
RSI is elevated (~72.1) and strength regime ~94.4%, which suggests trend heredity but also risk of pullback.
Key resistance zone near ~$184.56, and support near ~$174.05.
From published trade ideas on TradingView:
NVDA has faced a major resistance around ~$183‑185 region; a breakout above that could propel price higher, while failures may lead to pullbacks toward ~$165‑$175 zone.
TradingView
+1
Fundamental metrics show strong valuation: price‑to‑sales ~27.05 and EV/EBITDA ~45.58.
TradingView
+1
News & flow context: Despite some caution in sentiment (concerns about overvaluation, AI regulatory risk), the options flow (low PCR) signals institutional bullish bets.
🎯 Trade Rationale
The combination of strong trending regime + bullish options flow offers an edge for an upside trade.
Entry at $177.50 allows participation in breakout potential toward ~$183‑184, aligning with your target ~$4.08 (roughly +60% return) if the move plays.
Stop at ~$1.53 (~40% loss) balances risk/reward given moderate confidence.
The trade is time‑limited (3‑day expiry) — so timing and volatility matter.
⚠️ Key Risks & Watchpoints
RSI overbought and technical structure near resistance means upside is not guaranteed and may be limited if breakout fails.
If NVDA fails to hold support near ~$174, downside risk increases — especially given prior resistance around ~$183‑185.
The 3‑day expiry means time decay and implied vol shifts will heavily impact option premium.
News or sector rotation (e.g., semiconductor weakness, AI regulation) could trigger sharp reversal.
The neutral weekly momentum suggests strength, but not overwhelming strength — cautious size is warranted.