NVDA Swing Trade Today✅ Positives / Bull Case
Strong recent earnings + guidance: NVIDIA beat in Q3 and the commentary is upbeat for Q4 (“crazy good” according to CEO Jensen Huang).
StockAnalysis
+4
Fox Business
+4
Investors
+4
Wall-Street bullish consensus: Analyst average target ~$243 from current ~$185-$195, suggesting ~30% upside in the medium term.
TipRanks
+1
Strong fundamental backdrop: Dominance in AI chips, data-centers, large TAM (total addressable market) etc. Makes for a good “momentum” swing candidate if you believe the thesis.
⚠️ Risks / Bear Case
Valuation & expectations are already very high: With consensus expecting big growth, there’s little margin for error. If guidance disappoints or general tech/macro weakens, it could pull back.
Sector/market risk: AI stocks are in “expectation land” to a large extent. Some analysts caution about a possible bubble.
MarketWatch
+1
Very volatile: As a swing trade you’ll need good risk control. Big moves both ways possible.
Short-term catalysts may be thin: Some notes (e.g., Goldman Sachs) suggest lack of new catalysts for near term.
Business Insider
🎯 Setup for a Swing Trade
Here’s how you might structure a swing trade given your approach:
Entry
Current price ~ US$195.67 (per latest)
You could wait for a pullback into a support zone (for example around US$180-190) to improve risk/reward.
Or if momentum is strong and you want to ride it you could enter near current levels—but expect higher risk.
Stop-Loss
For example, a stop could be placed just below a recent support: say US$175-180 zone (depending on your risk tolerance).
Given high volatility, a tighter stop may lead to getting whipsawed.
Target
Given the ~30% upside to ~$243 (consensus target) you could set a medium swing target around US$235-250. That gives about +20-30% upside.
Alternatively, for a shorter swing you may aim for +10-15% (US$215-225) and then re-evaluate.
Time Horizon
Since you said “swing trade”, perhaps 1-4 weeks depending on catalyst flow.
If using until next earnings/guidance or sector move, keep flexible.
Risk/Reward
Suppose you enter at US$195, stop at US$175 (≈10% risk) and target US$235 (≈20% reward) → ~2:1 R/R, decent.
But if you enter higher, risk increases quickly.
Market/Context Conditions
Ensure broad market tech/AI risk isn’t spiking down (i.e., avoid entering if tech is breaking down).
Watch for macro/interest-rate cues, since growth stocks are sensitive.
Keep an eye on news related to export rules (China), chip supply constraints, large customer guidance — any negative shock could hit.
🔍 My Verdict
I like NVDA as a swing trade candidate if you:
enter with risk control (stop in place),
accept the volatility,
have conviction in the AI/data-centre tailwinds.
However, I’d be somewhat cautious on entering right at the high unless you see a fresh catalyst or a strong pullback to reduce risk. If you’re more conservative, waiting for a retest of support or slight consolidation might be wiser.
If I were making a call today: enter around current levels or after a modest pull-back, stop-loss at ~$175-180, target ~$235 for the swing, and be ready to adjust if market tech sentiment weakens.
Trade ideas

NVDA: The Bubble Beneath the Brilliance A deep dive into Nvidia’s AI-fueled rally — and the cracks forming under the surface.
🐺 Hello Traders 🐺
Nvidia’s been the poster child of the AI revolution — no doubt about it.
But every time a narrative gets “too perfect,” I hit pause… and zoom out.
Because NVDA’s been here before.
And every time, the chart whispered the truth long before the headlines caught up.
So let’s ask the real question:
Not “Is Nvidia a great company?” — we already know it is.
But rather:
“Are we pricing in a future that might not arrive fast enough?”
That’s where things get interesting.
🔹 The Hidden Cost of the AI Boom
AI is revolutionary — but it’s also a cash furnace.
Training, inference, datacenters, energy, hardware… it all comes with a brutal price tag.
And if returns don’t scale fast enough, guess where the market cuts first?
Hardware.
Which puts NVDA right at the heart of the risk zone.
Great company ≠ infinite valuation.
🔹 NVDA’s History of Hype & Hangovers
Let’s zoom out and look at the cycles:
1️⃣ Dot-Com Era (2000–2002)
Nvidia rode the internet wave hard.
Then the bubble popped — and NVDA got crushed.
Narrative > fundamentals… until reality showed up.
2️⃣ 2006–2007 GPU Mania
Gaming hype sent NVDA vertical.
Then came 2008 — and wiped the slate clean.
3️⃣ 2015–2018: Growth Meets Hype
This one was different.
Real growth + real hype.
Drivers included:
- 4K gaming and esports explosion
- AI research adoption
- Tesla’s self-driving push
- Crypto mining boom
- Datacenter demand
- Explosive revenue and margin growth
Outcome? A solid run with a mini-bubble at the tail end — which corrected during the crypto winter.
4️⃣ 2018 Crypto Crash
Mining demand collapsed.
NVDA dropped over 50%.
5️⃣ 2023–2024 AI Supercycle
The biggest rally in NVDA’s history.
Parabolic. Vertical. Narrative-fueled.
But here’s the thing:
Every vertical move in history cools off when expectations outrun execution.
🔹 Why This Cycle Feels Fragile
This isn’t just hype — it’s built on massive capex from Big Tech.
But capex isn’t infinite.
And the ROI of AI? Still foggy.
Here’s what’s brewing beneath the surface:
- Monetization is early
- Margins could shrink
- Custom chips are rising
- Spending could slow
And when it does, NVDA feels it first.
That’s why calling this an “unstoppable cycle” is dangerous.
🔹 My Technical View
I treat parabolic charts with caution — always.
- Strong trend ≠ invincible
- Steeper slope = weaker base
- Euphoria = warning sign
- Breaks are rarely gentle
NVDA still looks bullish long-term…
But no parabolic trend lasts forever.
I’m watching:
The price is currently reacting very well to the parabolic curves. Every time it hits the top, a downtrend begins, and the price crashes hard before retesting the support curve!
If AI spending slows even a little, NVDA will be the first domino.
🔹 Final Takeaways
Nvidia isn’t in trouble.
It’s one of the strongest tech players on the planet.
But history doesn’t care about greatness — it cares about gravity.
And every time NVDA flew too close to the sun, it came back down hard.
This cycle checks all the bubble boxes:
- Parabolic price
- Euphoric narrative
- Crowded positioning
- Sky-high expectations
- Capex dependence
As long as the slope holds, momentum traders run the show.
But when it breaks… it breaks fast.
That’s the bubble beneath the brilliance.
🎯 Why This Post Matters
Because most traders only see the surface.
They chase hype.
They follow headlines.
But they ignore the deeper forces — the ones that actually move the chart.
This post is a reminder:
Stay sharp.
Stay skeptical.
And never treat any narrative — even AI — as invincible.
🐺 Discipline is rarely enjoyable, but almost always profitable 🐺
🐺 KIU_COIN 🐺

Indices in the Global MarketWhat Is a Market Index?
A market index is a statistical measure that represents the value of a group of stocks. These stocks are chosen based on specific criteria such as industry, market capitalization, liquidity, or sectoral allocation. The purpose of an index is to track the performance of a market segment over time.
Indices provide:
A benchmark for investors to compare their portfolios.
A snapshot of market conditions.
A tool for passive investing through index funds and ETFs.
A reference point for derivative products like index futures and options.
Global indices summarize the performance of economies worldwide, making them vital for understanding international trends.
Types of Global Market Indices
Global indices can be categorized based on their scope and underlying composition. Here are the major types:
**1. Country-Specific Indices
These indices track the performance of a particular country’s stock market.
Examples:
United States:
S&P 500
Dow Jones Industrial Average (DJIA)
Nasdaq Composite
India:
Nifty 50
Sensex 30
Japan:
Nikkei 225
TOPIX
China:
Shanghai Composite
Hang Seng (Hong Kong market)
These indices reflect the economic condition of the respective nation, investor confidence, and market trends.
**2. Regional Indices
These track the combined markets of specific geographic regions.
Examples:
STOXX Europe 600 — represents Europe
FTSE Europe Index — major companies across Europe
S&P Asia 50 — top companies across Asian countries
Latin America 40 (LATAM 40) — top Latin American stocks
Regional indices help investors understand broader continental trends rather than country-level movements.
**3. Global Indices
These reflect the performance of companies worldwide.
Examples:
MSCI World Index — covers developed countries globally
MSCI Emerging Markets Index — tracks emerging economies
FTSE All-World Index — combines developed + emerging markets
Global indices are useful for gauging the health of the worldwide equity market.
**4. Sector-Specific Indices
These track particular industries such as technology, finance, energy, or healthcare.
Examples:
NASDAQ-100 Technology Index — tech-oriented companies
S&P Global Clean Energy Index
MSCI Global Financials Index
These help investors diversify or focus on high-growth sectors.
5. Weighted Indices (Price-Weighted, Market Cap-Weighted, Equal-Weighted)
Most global indices use one of the following methods:
Market Cap Weighted
Larger companies have more influence.
Examples: S&P 500, MSCI World.
Price Weighted
Stocks with higher prices have more influence.
Example: Dow Jones Industrial Average.
Equal Weighted
All stocks contribute equally regardless of size.
Why Global Indices Matter
Indices are more than just numbers—they drive major financial decisions.
1. Indicators of Economic Health
Indices reflect how well sectors or economies are performing.
A rising index generally signals economic expansion, while a falling one indicates slowdown.
For example:
When the S&P 500 rises consistently, it often signals strong U.S. corporate earnings.
When the Nikkei 225 falls sharply, it may indicate issues in Japan's industrial or export sectors.
2. Benchmarks for Portfolio Performance
Investors compare their returns to indices:
If a portfolio grows 10% while the S&P 500 grows 15%, the portfolio underperformed.
Fund managers aim to outperform benchmarks.
3. Underlie Passive Investment Products
Indices form the foundation for:
Index mutual funds
ETFs
Index futures
Index options
This allows investors to gain exposure to entire markets with ease.
4. Tools for Global Diversification
Investors use indices to diversify across:
Countries
Regions
Sectors
Market capitalizations
For example, someone in India can invest in global indices like Nasdaq 100 to gain exposure to U.S. technology giants.
Major Global Market Indices Explained
Below are some of the most influential indices across the world:
1. S&P 500 (USA)
Tracks the top 500 publicly traded U.S. companies.
Considered the most accurate representation of the U.S. economy.
Covers about 80% of U.S. market capitalization.
2. Dow Jones Industrial Average (USA)
Oldest U.S. index.
Tracks 30 large blue-chip companies.
Price-weighted.
3. Nasdaq Composite (USA)
Tech-heavy.
Includes over 3,000 stocks.
Reflects innovation and growth sectors.
4. Nikkei 225 (Japan)
Price-weighted index of 225 major Japanese companies.
Represents Asia’s most influential market.
5. FTSE 100 (UK)
Top 100 companies listed on the London Stock Exchange.
A key benchmark for the UK economy.
6. DAX 40 (Germany)
Tracks Germany's top 40 blue-chip companies.
Represents the powerhouse of the European Union.
7. Hang Seng (Hong Kong)
Represents Hong Kong’s free-market financial hub.
Strong exposure to Chinese companies.
8. Shanghai Composite (China)
Includes all stocks listed on Shanghai Stock Exchange.
Represents China’s domestic economic health.
9. Nifty 50 & Sensex (India)
Nifty 50: Top 50 companies by market cap.
Sensex: 30 large companies.
Both reflect India’s fast-growing economy.
How Global Indices Influence Each Other
In today’s interconnected economy, movements in one major index affect others.
Example:
If U.S. indices crash, Asian and European markets often fall the next day.
When China reports weak economic data, indices like Hang Seng, Nikkei, and even DAX may decline.
Global indices move in a chain reaction due to:
Trade relations
Currency fluctuations
Global risk sentiment
Monetary policy decisions
Indices as Tools for Traders
Global indices are widely used for:
1. Technical Analysis
Price trends, support/resistance levels, and chart patterns influence trading decisions.
2. Futures and Options Trading
Indices like Nifty, Dow, and Nasdaq have liquid derivative markets.
3. Hedging
Investors hedge their equity portfolios using index derivatives.
Conclusion
Global market indices are essential components of the financial ecosystem. They summarize economic performance, guide investment strategies, influence global capital flow, and provide transparent benchmarks for evaluating market trends. Understanding these indices gives traders and investors the ability to make informed decisions, diversify globally, and interpret the broader financial landscape. Whether you follow the S&P 500, Nikkei 225, FTSE 100, or Nifty 50, each index tells a story about its economy, sector, and global interconnectedness—making indices indispensable tools for navigating the world of finance.

NVDA — WEEK 49 TREND REPORT | 12/03/2025NVDA — WEEK 49 TREND REPORT | 12/03/2025
Ticker: NASDAQ:NVDA
Timeframe: WEEKLY
This is a reactive structural classification of NVIDIA based on the weekly chart as of this timestamp. Price conditions are evaluated as they stand — nothing here is predictive or forward-assumptive.
⸻
1) Current Trend Condition [ Numbers to Watch ]
• Current Price @ 180.26$
• Trend Duration: +31 weeks (Bullish)
• Trend Reversal Level (Bullish): 190.87$
• Trend Reversal Level (Bearish Confirmation): 176.52$
• Pullback Support : 167.75$
• Correction Support : 132.86$
⸻
2) Structure Health
• Retracement Phase:
Pullback (approaching 78.6%)
• Position Status:
Caution (interacting with structural layers)
⸻
3) Temperature :
Cooling Phase
⸻
4) Momentum :
Coiling
⸻
5) Market Sentiment
Bullish
⸻
Author’s Note
This analysis is fully reactive, not predictive. Market conditions, trend structure, and behavior are classified as they appear in real time. The objective is to identify where directional shifts first occurred, where structural integrity remains intact, and where it would begin to weaken if key levels were breached.
Predictive analysis projects outcomes that do not exist yet. Without price confirmation, prediction is built on baseless assumptions. This framework avoids that entirely by responding only to verified structural changes and live conditions.
The levels shown simply identify where the current trend structure first shifted and where it would begin to lose integrity if breached. Recognizing these boundaries allows for clearer interpretation of market behavior without relying on forward guarantees, speculative projections, or unsupported assumptions.
⸻
Methodology Overview
This classification framework evaluates directional conditions using internal trend-interpretation logic that references price behavior relative to its structural layers. These relationships are used to identify when price movement aligns with the framework’s criteria for directional phases, transition points, or regime shifts. Visual elements or structural labels reflect these internal interpretations, rather than explicit trading signals or preset indicator crossovers. This framework is observational only and does not imply future outcomes.

Forex Trading Secrets1. Price Action Is the Real King (Not Indicators)
Most beginners clutter their charts with dozens of indicators hoping to find a perfect buy–sell formula. Professionals know the truth: price itself gives the most reliable information. Indicators lag because they represent past price data, not current market intent.
What professionals focus on:
Support and resistance zones
Market structure (higher highs, lower lows)
Liquidity levels (areas where stop-loss clusters exist)
Candlestick strength (rejection wicks, engulfing candles)
When a trader learns to read price action—how candles react to zones, how momentum builds or fades—they can trade profitably even with a clean chart. Indicators become secondary confirmation tools, not primary decision drivers.
2. Liquidity Is What Moves the Market
Here’s a hidden truth: forex markets move to fill liquidity, not because of random price swings. Big players like banks and institutional traders execute massive orders, and they need liquidity to fill those orders efficiently. That means:
Price hunts stop-loss clusters
Price sweeps highs and lows before reversing
Spikes occur to capture pending orders
This is why you often get stopped out right before the market moves in your favor. Understanding liquidity behavior gives traders a powerful edge.
Liquidity concepts include:
Stop hunts
Fake breakouts
Order block zones
Liquidity grabs
Smart traders expect these moves and position themselves accordingly.
3. The Trend Is Stronger Than Your Analysis
One of the biggest secrets is deceptively simple: Trading with the trend dramatically increases win probability. Many traders try to catch tops and bottoms, but institutional players rarely fight the trend—they ride it.
Characteristics of trend-following success:
Higher time-frame confirmation
Entering on pullbacks, not chasing
Using simple trend continuation patterns
Keeping trades open longer during strong trends
The trend holds more weight than any indicator or news event. Fighting the trend is one of the fastest ways to blow up an account.
4. Risk Management Is the Most Guarded Secret
Ask any long-term successful trader their biggest edge, and the answer won’t be a strategy—it will be risk management.
Key risk management secrets:
Never risk more than 1–2% per trade
Position sizing is more important than entries
A trader with moderate accuracy and strong risk rules often outperforms a trader with high accuracy but poor risk control
Understanding when not to trade is also a powerful risk strategy. Not trading low-quality setups protects your capital and mental energy.
5. Trading Psychology Outweighs Strategy
This is the hardest secret for beginners to accept: Your mindset determines your results more than your system.
The psychological traits professionals share:
Patience to wait for ideal setups
Discipline to follow rules consistently
Neutrality—no emotional attachment to wins or losses
Resilience after a losing streak
Confidence built on data, not hope
A trader can have the world’s best strategy, but fear, greed, revenge trading, and impulsiveness will destroy the account. This is why psychology books are more valuable than indicator tutorials.
6. Higher Time Frames Reduce Noise and Increase Accuracy
A hidden secret among consistently profitable traders is that they rely heavily on higher time frames like the daily or 4-hour.
Why higher time frames work:
Clearer market structure
Stronger trend visibility
Fewer false signals
Trades require less screen monitoring
Better risk-to-reward setups
Scalping looks attractive, but it magnifies emotions and often leads to over-trading. Higher time-frame trading reduces mental stress and increases consistency.
7. Fundamental Catalysts Drive Major Moves
Forex is deeply influenced by macroeconomic factors. Professionals use fundamentals to understand why the market is trending and where major volatility will occur.
Major catalysts include:
Central bank interest rate decisions
Inflation data (CPI, PCE)
Employment data (NFP, unemployment rates)
GDP figures
Geopolitical events
Fiscal policies
Ignoring fundamentals means ignoring the very forces that create trends.
But the secret is: You don’t need to be an economist—just know when news is happening and how it affects risk.
8. Smart Money Concept (SMC) Edge
Institutional-style concepts, once hidden from retail traders, are now increasingly discussed. These include:
Order blocks
Fair value gaps (FVG)
Market structure shifts (MSS)
Imbalance zones
Buy-side and sell-side liquidity
These concepts explain how institutions accumulate and distribute positions. Traders who master SMC often experience a major breakthrough in accuracy.
9. Consistency Beats Intensity
This secret is rarely acknowledged.
Successful traders:
Follow a structured routine
Practice the same strategy repeatedly
Keep a trading journal
Backtest regularly
Set trading sessions and stick to them
Failure in forex often comes from randomness—random indicators, random entries, random time frames. Success comes from consistency, not constant experimentation.
10. Forex Is a Business, Not Gambling
Treating forex like a business means:
Maintaining a trading plan
Logging trades
Tracking performance metrics
Identifying weak areas
Improving process instead of chasing profits
Traders who approach forex like gambling lose money. Traders who approach it like a business grow gradually and sustainably.
Conclusion: The “Secrets” Are Not Hidden—They Are Underrated
The real secrets of forex trading are not magic formulas or mysterious tools. They are principles that professionals use every day but beginners often overlook in search of shortcuts.
To summarize:
Price action matters most
Liquidity drives the market
Trend-following improves probability
Risk management is the true edge
Psychology determines consistency
Higher time frames simplify trading
Fundamentals guide long-term trends
SMC offers an advanced structural view
Consistency builds mastery
Treating trading as a business ensures longevity
Mastering these secrets takes time, discipline, and patience. But once internalized, they form the foundation of sustainable forex success.
Case Studies of High-Growth Emerging EconomiesIntroduction
Emerging economies play a pivotal role in shaping global economic dynamics. Characterized by rapid industrialization, increasing integration into global markets, and significant socio-economic transformation, these countries often exhibit higher growth rates compared to developed economies. Understanding their trajectories offers critical insights into developmental strategies, policy formulation, and investment opportunities. This case study analysis focuses on select high-growth emerging economies, examining the factors that fueled their rise, challenges they faced, and lessons that can inform other countries.
1. China: The Manufacturing Giant
Economic Transformation:
China’s growth story is one of the most studied among emerging economies. Since the late 1970s, China transitioned from a centrally planned economy to a market-oriented one. Reforms, such as the establishment of Special Economic Zones (SEZs) and liberalization of trade, catalyzed manufacturing and exports, positioning China as the “world’s factory.”
Key Growth Drivers:
Export-Led Growth: China leveraged low-cost labor and improved infrastructure to dominate global manufacturing.
Investment in Infrastructure: Massive investments in roads, ports, and energy supported industrial expansion.
Technology Adoption: China strategically invested in technology transfer, innovation, and R&D, gradually moving from low-end manufacturing to high-tech industries.
Challenges:
Environmental degradation due to rapid industrialization.
Rising labor costs leading to the relocation of manufacturing to other emerging markets.
Increasing reliance on debt-financed infrastructure projects.
Lessons Learned:
China’s model illustrates the effectiveness of phased liberalization, export-driven strategies, and strategic government intervention in catalyzing rapid growth.
2. India: Services-Led Growth
Economic Transformation:
India represents a contrasting high-growth model driven predominantly by services rather than manufacturing. Since economic liberalization in 1991, India’s GDP has grown steadily, propelled by information technology (IT), software services, and business process outsourcing (BPO).
Key Growth Drivers:
Human Capital: A large, young, and English-speaking workforce facilitated the IT and services boom.
Policy Reforms: Liberalization, privatization, and deregulation attracted foreign investments and promoted entrepreneurship.
Global Integration: India leveraged globalization to become a hub for IT exports, serving international markets.
Challenges:
Infrastructure bottlenecks, particularly in transport and energy, limit manufacturing growth.
Income inequality and regional disparities pose social and political challenges.
Dependence on global demand for IT services makes the economy vulnerable to international shocks.
Lessons Learned:
India’s case underscores the potential of services-led growth and the importance of investing in human capital and digital infrastructure.
3. Vietnam: Export-Oriented Manufacturing
Economic Transformation:
Vietnam’s growth trajectory has been remarkable, with GDP expanding rapidly over the past two decades. Economic reforms under Đổi Mới in 1986 shifted Vietnam from a centrally planned to a market-oriented economy, stimulating private enterprise, foreign investment, and export-led manufacturing.
Key Growth Drivers:
Foreign Direct Investment (FDI): Incentives and trade agreements attracted global manufacturers in electronics, textiles, and footwear.
Competitive Labor Costs: Vietnam’s young workforce and low wages made it a preferred alternative to China for global supply chains.
Trade Liberalization: Membership in the World Trade Organization (WTO) and bilateral trade deals integrated Vietnam into global markets.
Challenges:
Overreliance on FDI and exports exposes the economy to external shocks.
Environmental concerns due to industrialization and urban expansion.
Need for skilled labor and innovation to move up the value chain.
Lessons Learned:
Vietnam highlights the effectiveness of combining market reforms with targeted FDI policies to achieve rapid industrial growth.
4. Ethiopia: Agriculture and Industrial Parks
Economic Transformation:
Ethiopia’s growth story differs from East Asian models, as it relies heavily on agriculture and government-led industrialization. Over the past decade, Ethiopia has been one of Africa’s fastest-growing economies, with infrastructure projects and industrial parks driving development.
Key Growth Drivers:
Agricultural Reforms: Modernizing agriculture through irrigation, mechanization, and value-chain development.
Industrial Parks: Establishment of textile and garment industrial parks attracted foreign investment.
Infrastructure Development: Roads, energy projects, and telecom expansion improved productivity and connectivity.
Challenges:
Political instability and regional conflicts have hampered sustained growth.
Heavy reliance on donor funding and external loans poses debt sustainability risks.
Climate vulnerability affects agricultural output.
Lessons Learned:
Ethiopia demonstrates how strategic public investment in infrastructure and industrial policy can drive growth, even in low-income economies, but highlights the importance of political stability.
5. Brazil: Resource-Led Growth and Diversification
Economic Transformation:
Brazil’s growth has been fueled by abundant natural resources, agricultural exports, and a diversified industrial base. The country emerged as a key player in commodities such as soybeans, iron ore, and oil.
Key Growth Drivers:
Natural Resources: Exploitation of oil, minerals, and agricultural commodities drove export revenues.
Social Programs: Initiatives like Bolsa Família improved human development indicators, supporting domestic consumption.
Industrial Diversification: Investment in automotive, aerospace, and manufacturing sectors reduced dependency on raw materials.
Challenges:
Volatile commodity prices exposed the economy to global shocks.
Political corruption and policy inconsistency hindered long-term growth.
Structural inequality and inflationary pressures remained persistent challenges.
Lessons Learned:
Brazil’s experience underscores the importance of diversifying growth drivers and managing the resource curse through effective policies.
Comparative Analysis
Across these case studies, several common patterns emerge:
Policy Reforms Matter: Successful emerging economies implemented liberalization, trade openness, and regulatory reforms to attract investment.
Human Capital is Key: Education, skill development, and labor force quality are crucial for sustaining growth.
Infrastructure Investment: Physical and digital infrastructure accelerates industrialization and trade integration.
Global Integration: Leveraging globalization through exports and FDI is a consistent growth enabler.
Challenges Remain: Environmental sustainability, inequality, and political stability are recurring constraints that need continuous attention.
While the paths differ—China’s manufacturing-led growth, India’s service-led expansion, Vietnam’s FDI-driven industrialization, Ethiopia’s public-sector infrastructure model, and Brazil’s resource-led diversification—they all highlight that a combination of strategic policies, investments in human and physical capital, and integration into global markets drives high growth.
Conclusion
High-growth emerging economies offer valuable lessons in economic transformation. Their experiences demonstrate that while growth strategies can differ based on comparative advantages, consistent factors such as policy reforms, human capital development, infrastructure investment, and global engagement are universally critical. However, challenges such as inequality, environmental sustainability, and political stability must be addressed to ensure long-term, inclusive growth.
Understanding these cases equips policymakers, investors, and scholars with insights on how emerging economies can navigate the complexities of globalization, industrialization, and socio-economic development, while providing a roadmap for other developing nations aspiring for rapid and sustainable growth.

Nvidia’s Momentum Faces Its First TestFor much of the past decade, Nvidia has stood at the centre of a profound technological shift. Its chips underpin the modern artificial-intelligence ecosystem, and the company has become one of the most influential constituents of global equity markets. Yet after an extraordinary run, a combination of technical signals and slowing market dynamics suggests the stock may be approaching a period of consolidation.
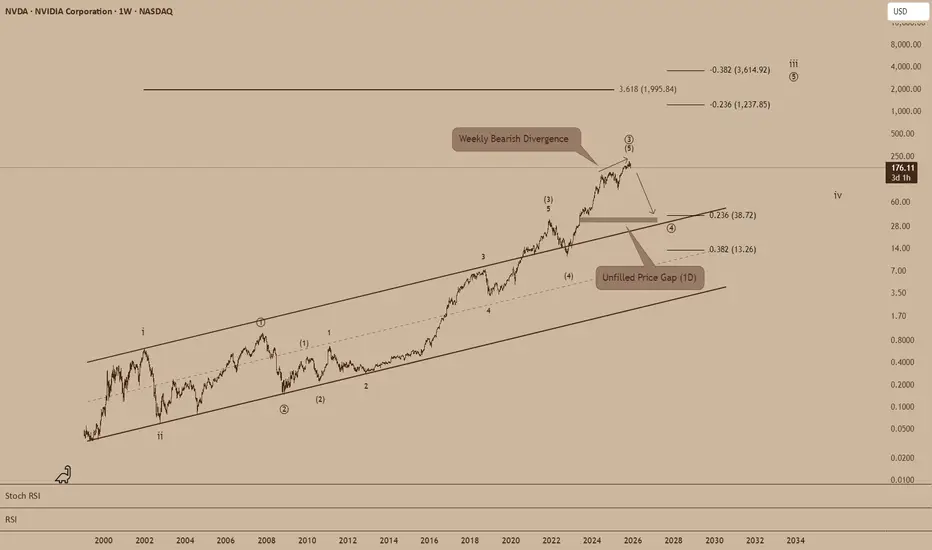
Long-term price analysis shows Nvidia’s shares have risen within a broad upward channel since the early 2000s, a structure that has guided each major expansion and subsequent correction. The most recent advance fuelled by unprecedented demand for AI-related hardware has carried the stock to the upper edge of this decades-long formation.
A Mature Price Structure Meets Waning Momentum
Technical readings indicate the current rally may be nearing exhaustion. The share price has formed a completed five-wave structure at the upper boundary of its long-term channel, accompanied by a notable bearish divergence on weekly momentum indicators. Such developments are typically associated with the late stages of a major trend.
If this marks the completion of a long-running impulsive phase, the stock may be entering a corrective chapter. The first substantial support appears near $38, aligning with earlier congestion zones and a shallow retracement level. A deeper drawdown could expose the gap left by previous trading and a secondary support area closer to $13, where the lower channel boundary intersects longer-term Fibonacci projections.
This would be consistent with the type of multi-quarter pause usually seen between major structural waves in extended growth cycles.
Underlying Strength, but With Signs of Normalisation
Despite these technical signals, Nvidia’s business remains fundamentally strong. Demand for AI accelerators continues to drive high revenue and margin levels, and the company retains a dominant position in the market for large-scale compute.
However, several trends suggest that the exceptional conditions of recent years are beginning to moderate.
Valuations and Expectations
Nvidia trades at valuations well above its historical norms. Consensus estimates still point to healthy growth, but some analysts question whether current multiples fully account for the natural deceleration that follows rapid capacity build-outs among cloud providers.
A More Balanced AI Investment Environment
The initial wave of infrastructure spending by hyperscale operators has eased, shifting from aggressive expansion towards more measured investment cycles. While the long-term trajectory for AI remains constructive, the sector’s near-term capital intensity appears to be flattening.
Emerging Competitive Pressures
Rivals such as AMD are gaining traction in certain segments, while large technology companies continue developing internal AI chips to reduce dependence on external suppliers. Nvidia’s leadership remains intact, though the competitive field is broadening.
Policy and Regulatory Considerations
Export restrictions on high-performance semiconductors and heightened regulatory attention in the US have added another layer of uncertainty. These challenges are not existential, but they contribute to a more complex environment than the one that propelled the company’s recent surge.
A Period of Rebalancing Rather Than Reversal
Taken together, the technical and fundamental perspectives point to a market that may be re-evaluating the pace, not the direction of Nvidia’s long-term story. The company remains one of the key beneficiaries of the AI era, but the alignment of slowing momentum, stretched valuations and maturing investment cycles suggests that the share price may face a period of consolidation.
For investors with a longer horizon, such an adjustment could eventually offer an attractive entry point. For now, the signals imply that Nvidia’s next phase may be characterised less by acceleration and more by moderation.
Are Derivatives Powerful in the Global Trade Market?1. What Are Derivatives?
A derivative is a financial contract whose value is derived from an underlying asset. This asset could be:
Commodities like crude oil, gold, wheat, natural gas
Currencies such as USD, EUR, JPY
Equity indices like Nifty 50, S&P 500
Interest rates such as LIBOR or government bond yields
Credit instruments like corporate bonds
The most common derivatives include:
Futures
Options
Swaps
Forward contracts
In the global trade market, derivatives’ primary purpose is risk transfer, although they are also used for speculation and arbitrage.
2. The Global Influence of Derivatives
Risk Management Backbone of Global Trade
Global trade is full of uncertainties—currency fluctuations, commodity price volatility, geopolitical tensions, supply chain disruptions, and interest rate changes. Derivatives serve as insurance-like tools that allow participants to lock in future prices, hedge risks, or stabilize cash flows.
For example:
An airline company hedges jet fuel futures to protect against rising crude prices.
An importer hedges currency risk using forex forwards to avoid losses if the dollar rises.
Exporters use options to protect against weakening foreign currencies.
Without derivatives, global trade would be significantly more dangerous and unpredictable.
3. Derivatives and Commodity Markets
Commodity derivatives such as oil futures, agricultural futures, and metal contracts are essential in global trade.
Why are commodity derivatives powerful?
Price Discovery
Derivatives markets reflect real-time global supply and demand conditions. Oil prices, for example, are heavily influenced by futures traded on major exchanges.
Stabilizing Prices for Producers and Consumers
Farmers hedge crop prices to secure income; manufacturers lock in raw material prices to control costs.
Enhancing Global Trade Flows
Multinational companies plan procurement and distribution based on futures price signals.
Reducing Market Manipulation
Transparent derivative markets help in curbing cartel behavior and monopolistic pricing.
Thus, commodity derivatives are one of the strongest tools that keep global trade systems efficient and predictable.
4. Currency Derivatives – The Engine of Cross-Border Commerce
In global trade, currency fluctuations can make or break profitability. A stable currency environment is a dream, but not the reality. Hence, forex derivatives are widely used.
How currency derivatives empower global trade?
Hedging exchange rate risks
Importers/exporters use forwards, futures, and options to secure exchange rates.
Supporting multinational operations
Corporations manage exposure across dozens of currencies simultaneously.
Providing liquidity to global markets
Forex derivatives markets are the largest in the world, with trillions traded daily.
Enhancing financial stability
Countries with export-driven economies rely on currency derivatives to prevent economic shocks.
Currency derivatives act as the hidden shield that protects companies and nations from unpredictable foreign exchange swings.
5. Interest Rate Derivatives – The Heart of Financial Stability
Because interest rates influence the cost of borrowing globally, interest rate swaps and futures form the backbone of global financial markets.
Their key powers include:
Helping governments manage debt.
Allowing banks to hedge interest rate exposure.
Enabling corporations to stabilize borrowing costs.
Ensuring smoother global credit flow.
Without interest rate derivatives, global financing would be far riskier, costlier, and more unstable.
6. Derivatives as Speculative and Profit-Making Instruments
While derivatives are risk-management tools, their power also comes from:
Speculation
Traders take positions on future market movements to earn profits. This:
Increases market liquidity
Enhances price discovery
Draws global capital into trade markets
However, speculation can also increase volatility if unchecked.
Arbitrage Opportunities
Derivatives allow traders to exploit price differences in different markets:
Spot vs futures
Domestic vs international exchanges
Currency arbitrage
Commodity pricing discrepancies
Arbitrage ensures that global markets remain efficient and interconnected.
7. How Derivatives Strengthen Global Market Efficiency
Derivatives contribute to global trade in several powerful ways:
A. Increased Liquidity
Markets with high liquidity:
Reduce transaction costs
Facilitate smoother trade
Attract global investors
Improve pricing accuracy
Derivative markets like CME, ICE, NSE, LME, and SGX provide massive liquidity to commodities, currencies, and equities.
B. Better Price Stability
Derivatives reduce sharp price swings, especially in commodities and currencies. This is essential for long-term contracts and procurement.
C. Improved Risk Sharing
Derivatives distribute risks across participants:
Hedgers transfer risk
Speculators accept risk
Arbitrageurs eliminate inefficiencies
This creates a smooth ecosystem for global trade.
D. Facilitation of Global Investments
Investors use derivatives to:
Hedge portfolio risks
Gain exposure to foreign markets
Manage geopolitical risks
This flow of capital boosts global trade volumes.
8. Challenges and Risks of Derivatives
Even though derivatives are powerful, they also have downsides:
1. High leverage risk
Small price movements can cause large profits or losses.
2. Systemic risk
Excessive derivatives trading contributed to crises such as:
2008 Global Financial Crisis
LTCM collapse
Oil futures flash crashes
3. Complexity
Sophisticated instruments like credit default swaps (CDS) are difficult to understand.
4. Counterparty risk
Failure of one party can create a chain reaction.
Despite these risks, regulatory reforms and clearinghouses have made derivative markets safer and more transparent.
9. The Future of Derivatives in Global Trade
Derivatives are becoming more powerful due to:
Digital platforms and electronic trading
AI-driven risk models
Expansion of global markets (India, China, ASEAN)
Growth in commodity and currency volatility
Rise of ESG and carbon credit derivatives
The next decade will see derivatives become even more integrated with global supply chains, energy markets, and financial systems.
Conclusion
Yes, derivatives are extremely powerful in the global trade market. They are not merely financial instruments but essential tools that support world commerce by:
Managing risks
Stabilizing prices
Enhancing liquidity
Improving efficiency
Supporting international investments
Strengthening financial stability
From farmers to oil companies, from banks to governments, derivatives underpin decisions and strategies across the global trade ecosystem. Without them, global markets would be less predictable, less efficient, and far more vulnerable to shocks.
Global Economy Shifts1. Multipolarity and the Rebalancing of Global Power
For decades, the global economy operated under a largely unipolar structure led by the United States and its Western allies. Today, this dominance is fading as new economic blocs rise. Emerging markets—most notably China, India, Southeast Asia, the Middle East, and Africa—are becoming engines of global growth.
Rise of Asia
Asia now contributes more than half of global economic growth. China remains the world’s second-largest economy despite slowing growth, while India is emerging as the fastest-growing major economy, driven by demographics, domestic consumption, and digital infrastructure.
Shift Toward Regional Blocs
Increasing geopolitical tensions between the U.S. and China have accelerated the formation of economic blocs:
BRICS+ expansion has brought new resource-rich members.
Regional trade agreements such as RCEP and CPTPP are reshaping Asia-Pacific integration.
The European Union, despite internal challenges, is investing in strategic autonomy, green energy, and advanced manufacturing.
This move toward multipolarity is redefining investment flows, supply chains, and diplomatic alignments.
2. Technological Transformation and the Digital Economy
Technology is the most powerful force reshaping global economic structures. The accelerating adoption of AI, automation, robotics, and digital platforms is altering productivity, labor markets, and competitive advantages.
Artificial Intelligence as a Growth Catalyst
AI is transforming sectors such as finance, healthcare, logistics, and manufacturing. Countries that invest heavily in AI—like the U.S., China, and South Korea—are gaining competitive edges.
Digital Infrastructure Expansion
Digital connectivity has become the backbone of national competitiveness. Innovations such as:
5G and upcoming 6G networks
Cloud computing
Quantum technologies
Blockchain and digital payments
are enabling new business models. Digital public infrastructure (DPI), led by India’s UPI, Aadhaar, and ONDC, is becoming a blueprint for emerging markets.
Techno-Economic Fragmentation
However, technology is also driving global fragmentation:
Competing semiconductor supply chains
Restrictions on data flows
Tech-related sanctions
Global technology standards may split into competing spheres, creating challenges for multinational corporations.
3. Geopolitical Conflicts and De-Risking of Supply Chains
Conflicts such as the Russia–Ukraine war, Middle East instability, and U.S.–China tensions have triggered a significant rethinking of global supply chains.
From Globalization to “De-Risking”
Countries are not fully de-globalizing, but they are diversifying away from single-source dependencies. This has led to:
Nearshoring (e.g., U.S. companies shifting production to Mexico)
Friendshoring (production moving among geopolitical allies)
China+1 strategy (India, Vietnam, Indonesia as beneficiaries)
Resilience Over Efficiency
Companies are prioritizing:
Multi-location manufacturing
Strategic stockpiling
Strengthening logistics networks
Supply chains are becoming more regional and networked, reducing vulnerability to shocks.
4. Green Transition and the Economics of Climate Change
Climate change is reshaping policymaking and investment decisions. Governments and corporations are transitioning toward low-carbon economies, driving structural changes across energy, transportation, manufacturing, and agriculture.
Shift Toward Clean Energy
Renewables—solar, wind, hydro, hydrogen—are experiencing massive investment. Nations like China lead in solar manufacturing, Europe in wind technology, and the Middle East in green hydrogen.
Electric Vehicle (EV) Transformation
EV adoption is accelerating globally, forcing:
Auto companies to redesign supply chains
Battery manufacturers to secure critical mineral sources
Governments to provide subsidies and carbon regulations
Climate-Resilient Infrastructure
Rising temperatures and extreme weather events require substantial investment in resilient infrastructure, influencing fiscal priorities worldwide.
5. Demographic Changes and Labor Market Evolution
Demographics play a critical role in shaping economic potential.
Aging Economies
Developed nations—Japan, South Korea, much of Europe, and even China—face aging populations, shrinking workforces, and rising healthcare burdens. This leads to:
Lower long-term growth
Higher fiscal pressure
Increased need for automation and immigration
Youthful Economies
In contrast, India, Africa, and parts of Southeast Asia have young populations and rapidly urbanizing societies. These countries will be key drivers of global labor supply and consumer demand in coming decades.
Future of Work
Automation and AI will redefine jobs across sectors. While high-skilled workers benefit from rising productivity, low-skilled jobs face displacement. Upskilling, remote work, and gig economy platforms are altering labor structures.
6. Shifts in Global Trade, Currency, and Finance
Global trade patterns are being reshaped by:
Tariffs and trade barriers
Sanctions
New trade agreements
Carbon border taxes
Changing Currency Dynamics
While the U.S. dollar remains dominant, alternative currency arrangements are gaining traction:
BRICS countries exploring settlement in local currencies
Digital currencies and central bank digital currencies (CBDCs)
Bilateral trade agreements bypassing the dollar
Although the dollar’s dominance will not end soon, its relative share is gradually declining.
Capital Flow Reconfiguration
Investments are moving into:
Resilient supply chains
Green energy
Technology hubs
Emerging markets
Sovereign wealth funds, especially from the Middle East, are playing a major role in global capital allocation.
7. Consumer Behavior and Market Transformations
Consumers are shifting their preferences due to technological access, environmental awareness, and rising incomes.
Key trends include:
Increased digital consumption
Demand for sustainable products
Rapid growth of e-commerce and online services
Preference for personalized and subscription-based models
Emerging market middle classes—especially in India, Indonesia, and Africa—are becoming major contributors to global consumption growth.
Conclusion: A Transformative Decade Ahead
The global economy is transitioning through a period of deep structural change. Multipolarity, technological acceleration, shifting demographics, climate imperatives, and geopolitical tensions are transforming how nations trade, innovate, and grow.
The next decade will be defined by adaptability. Countries and companies that invest in technology, diversify supply chains, embrace sustainability, and harness human capital will emerge as winners. As economic power diffuses and the global order evolves, agility and resilience will shape the new world economy.

NVDA - The Truth About Nvidia's ReversalAfter an impulse wave always comes a correction. Here you see the wave A going down and the wave B going up. The unexpected reversal everyone is talking about is the start of wave C to the downside.
The insane wave B has run its course and hit the ceiling. There's no more room to go. That's why there was a reversal. It has nothing to do with external forces or circumstances. It's the nature of the Elliott Wave.
All the optimism for Nvidia has been factored into wave B. You can easily tell by how long and extended the wave is. High optimism always accelerates the price, which results in longer impulse waves. In other words, all the juice has been squeezed and there's no more juice to squeeze. Nothing lasts forever. It's time for wave C to make an appearance.

NVDA down MVP SYSTEM
MOMENTUM:
RSI Broke down from widening wedge
VOLUME:
to downside
PRICE ACTION:
big red engulfing at the lower border of the widening wedge
I don’t hold positions in NVDA. I use it as a barometer for the market.

Breaking: Nvidia ($NVDA) Crush Q3 Earnings Nvidia ( NASDAQ:NVDA ) stock saw a noteworthy uptick of 5% in early Thursday premarket trading albeit market turmoil. The asset reported earnings yesterday after market close sparking bullish sentiment.
The asset is approaching the $200 resistant as the RSI is at 47 giving room for massive upside.
The Shares of Nvidia popped in premarket trade after the U.S. firm beat expectations in third-quarter results after the closing bell on Wednesday.
Shares were last trading 5.5% higher at 4:15 a.m. ET.
Nvidia topped forecasts for revenue, which jumped 62% to $57.01 billion year-on-year, and issued stronger-than-expected fourth-quarter sales guidance.
“There’s been a lot of talk about an AI bubble,” Nvidia CEO Jensen Huang told investors on an earnings call, as the firm set out its view of the industry. “From our vantage point, we see something very different.”
Financial Performance
In 2024, NVIDIA's revenue was $130.50 billion, an increase of 114.20% compared to the previous year's $60.92 billion. Earnings were $72.88 billion, an increase of 144.89%.
Financial Performance
In 2024, NVIDIA's revenue was $130.50 billion, an increase of 114.20% compared to the previous year's $60.92 billion. Earnings were $72.88 billion, an increase of 144.89%.
About NVDA
NVIDIA Corporation, a computing infrastructure company, provides graphics and compute and networking solutions in the United States, Singapore, Taiwan, China, Hong Kong, and internationally. The Compute & Networking segment includes its Data Centre accelerated computing platforms and artificial intelligence solutions and software; networking; automotive platforms and autonomous and electric vehicle solutions; Jetson for robotics and other embedded platforms; and DGX Cloud computing services.

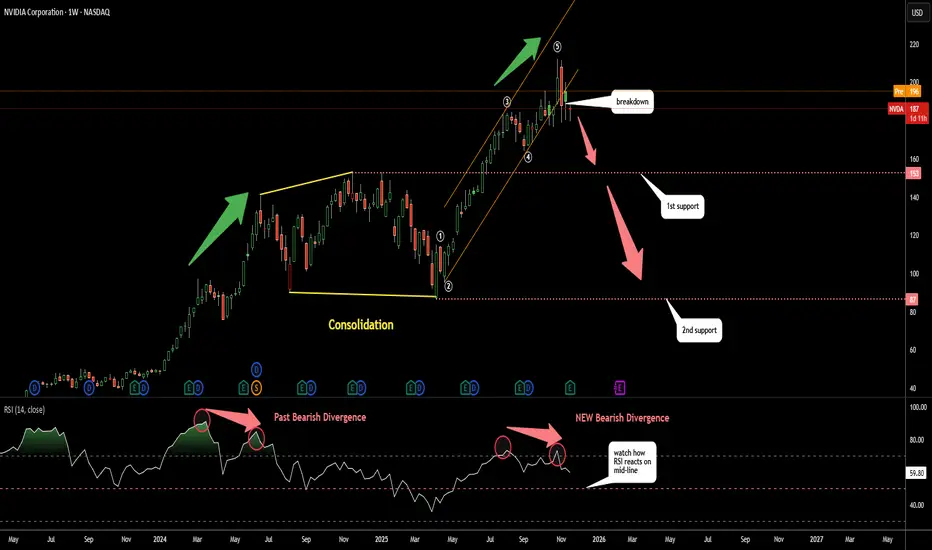
Nvdia (NVDA): How Deep It Can Dip?The RSI is not buying the hype as it shows clear Bearish Divergence
This aligns with the current impulse wave count suggesting the 5 wave structure may now be complete and the orange uptrend has been broken
Last year a similar Bearish Divergence triggered a large consolidation phase marked in yellow
It may repeat again
First support is at 153 the top of the previous consolidation
Second support is at 87 the bottom of that consolidation
Nvidia Earnings Finally Ease Market Jitters. Are AI Bulls Back?It’s confirmed. This is Nvidia’s stock market and we all live in it.
Nvidia NASDAQ:NVDA reported yet another record-breaking quarter, instantly soothing market nerves after a week filled with talks of “AI bubble,” “valuation fever,” and “maybe Michael Burry is right again.” It was the cherry of the earnings season .
The chipmaking giant announced $57 billion in sales during the most recent quarter.
The figure is up 62% year-over-year and way above estimates. In other words, Nvidia didn’t just calm the market. It kicked the door open and shouted: “Get in losers, we’re going shopping.”
CEO Jensen Huang was even more enthusiastic, declaring that “AI is going everywhere, doing everything, all at once.” In classic Huang fashion, you could almost smell the leather jacket.
💽 Data Center Demand: Still Insatiable
Let’s cut to the headline number: $51.2 billion in data-center revenue. Analysts expected $49 billion. Nvidia delivered more.
The company’s new Blackwell GPUs, described by Huang as “off the charts” when it comes to demand, continue to fly off the production line the moment they’re made.
Quarterly net income hit a whopping $31.9 billion, up 65% from the year prior. At a time when most companies celebrate single-digit percentage growth, Nvidia is casually stacking double and triple digits.
📈 Markets Exhale, Futures Soar
The relief was immediate and widespread. You could say that Nvidia’s earnings are not just earnings anymore, but a macro signal.
Here’s what the picture looked like after the release:
CoreWeave NASDAQ:CRWV jumped 10%
Futures tied to the Nasdaq NASDAQ:IXIC climbed 2%
Every Magnificent Seven stock flashing green
Investors had been waiting for confirmation that the AI boom still had room. And Nvidia delivered enough reassurance to light up the entire tech complex.
“Okay. Maybe we don’t need to rotate into utilities just yet,” every tech bro, probably.
😬 The Stakes Were High. Really High.
The reaction, though, must be taken within the current context. Over the past few weeks, tech stocks were hit by deep selloffs as markets fretted over the same question: “Is AI too expensive?”
Between skyrocketing capital expenditures, absurdly ambitious data-center budgets, and the kind of spending plans that would make even sovereign wealth funds blush, investors wondered whether Big Tech was building an AI future or an AI money pit.
Even Michael Burry stepped in, revealing positions betting against Nvidia NASDAQ:NVDA and Palantir NASDAQ:PLTR . That move alone sent pockets of the market into a philosophical crisis.
After all, that’s the guy from “The Big Short” and he’s hedged against your favorite trade.
🤖 So… Are the Bulls Back?
Maybe. For now at least. But with conditions.
Nvidia’s stock more than doubled between April and late October, only to slide in recent weeks as bubble fears thickened. Year to date, the stock is still up about 30%.
Nvidia’s numbers prove that AI spending is still accelerating. But the broader question remains: Can companies actually turn those massive AI investments into profit?
Nvidia’s blowout quarter just reset the narrative:
AI demand is still real
Spending is justified
The cycle is still “virtuous,” in Huang’s words
After this earnings print, the bull case has something it desperately needed: momentum.
And momentum is a powerful thing, especially in a market that had started to doubt its favorite story.
Off to you : Do you still see room for growth in the AI space? Or is that rebound a short-term reflex? Share your views in the comments!

#NVIDIA $NVDA The new leader!Nvidia is the world's number one after passing $MSFT.
-Valuation soars to $3.34 trillion.
Nvidia completed a 10-for-1 stock split on June 7. The chipmaker last month posted yet another blockbuster quarter, noting a 262% increase in revenue and a 462% increase in profits year-over-year.
I'm not going to write to much here. The market sentiment is clearly bullish and here are my projections for $NVDA.
The chart should speak for itself. Targets zone is shown on the chart.
Short term, expect price to consolidate withing the red projection marker based on divergences and anomalies in the relative strength index followed by a continuation of the upwards trend (green projection marker).
Targets: (-128),146,160,200
|----Range-----|
(alfa)
I will take a bullish longer term stand on NASDAQ:NVDA from where we currently sit. Short term, expect a pullback/consolidation at the current level before a possible continuation.
(Can add more intraday targets if requested).

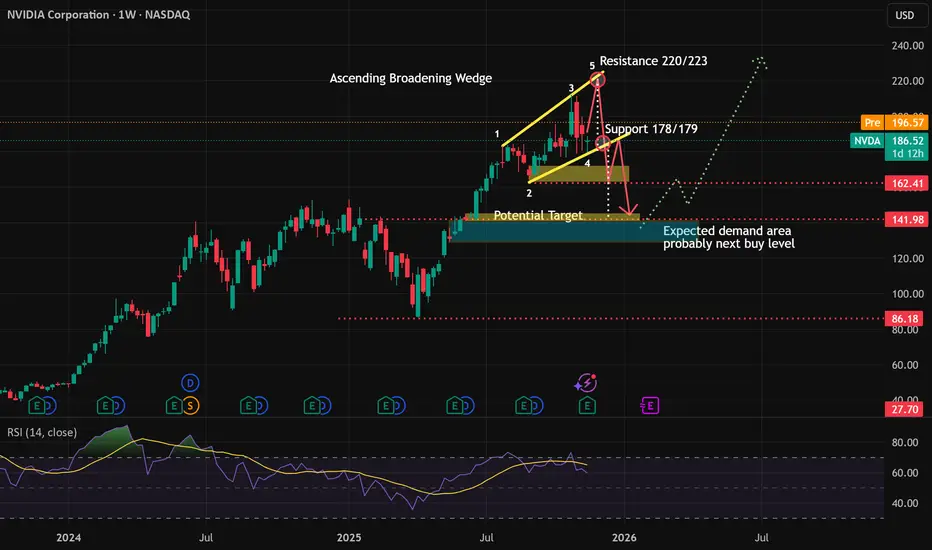
Ascending Broadening Wedge for NVIDIA Weekly ChartThe downtrend probably won't be happen in the near term, but the rebound alson have limited upside. But at least there are 2 possibilities ahead of the price.
I suspect Ascending Broadening Wedge is in process in weekly chart for Nvidia. The concern is the potensial downtrend pressure, especially if support trendline break.
I devide it on 2 scenario :
1. Rebound to 220/223 first. This mean no immediate breakout support anytime soon based on the count. The price will have to raise first with maximum target 220/223 before followed with rejection. But the raise don't have to be exactly 220/223. It can also retest the previous high (3) before rejected and fall.
2. No rebound, support 177/178 immediately broken, the downtren continues to the target area.
There area possibilities to go up first if Santa Claus Rally succeed to push the price above or near resistance, then after the seasonal trade for Santa Claus or January effect will face the profit taking and underpressure through the supportline.
After the pressure, we probably will see some demand on blue area to push the price back on the uptrend..that ofcourse..if no "AI-buble" coming in coming months
DISCLAIMER
Do with your own risk!
This is not suggestion! This is my personal view on the opportunities that could happen to Nvidia.
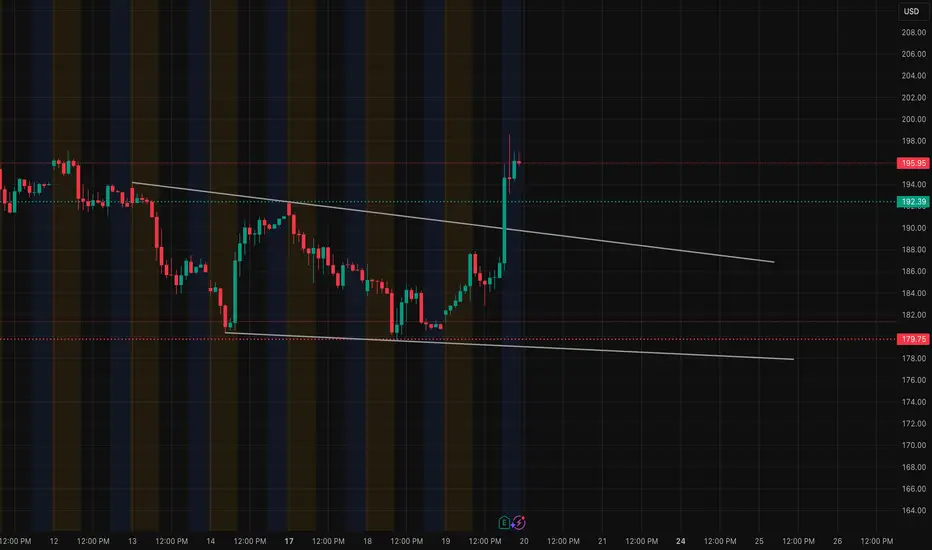
NVDA – Breakout or Pullback Setup? Nov. 20 Trade Plan1-Hour Outlook (Main Bias)
NVDA broke out of a multi-day descending channel and pushed straight into the 195.50–196 zone, which previously acted as heavy resistance on the 1-hour chart. The impulse was strong, reclaiming several key structure levels in one move.
1H Structure
* NVDA printed a strong bullish BOS after breaking the channel trendline.
* Price is currently consolidating near 195.95, right under the 200 psychological level.
* Momentum remains strong, with MACD expanding upward after a fresh crossover.
* Stochastic is elevated but not rolling over yet. Buyers still in control.
1H Key Levels
Breakout trigger: above 196
Upside targets:
* 200.00 (major psychological + GEX resistance)
* 202.50–203 (thin liquidity zone)
Support zone: 187.50–188
Bears gain control only below: 182.80
1H Trading Idea
Bullish scenario:
If NVDA holds above 192.50–193.00 and reclaims 196 cleanly, momentum favors an extension toward the 200–202.50 zone. Break above 200 opens the next leg of gamma pressure.
Bearish scenario:
Valid only if price rejects 196 with a full-body reversal candle. Downside magnets sit at 192 and 188.
15-Minute Outlook (Execution Timeframe)
NVDA is consolidating after a strong vertical impulse. Price formed a BOS on the 15M and is now pulling back slightly into the minor supply zone at 195–196.
15M Structure
* Clean sequence: CHoCH → BOS → impulsive breakout → consolidation.
* EMAs are stacked bullish and acting as dynamic support.
* The recent FVG at 191.50–192.20 held well, confirming bullish continuation structure.
15M Trading Setups
Bullish entry:
* Prefer retrace into 193.80–194.30
* Look for bullish engulfing or a wick rejection
* Targets: 196 → 200
* Stop: below 192.70
Breakout entry:
* Enter on clean break of 196
* Stop below last swing low
* Targets: 198.50 → 200–202
Bearish scalp:
* Only valid if NVDA repeatedly rejects 196
* Target: 193.50
* Invalid if price breaks 196
GEX Confirmation
Based on the NVDA GEX chart:
Bullish Signals
* Highest positive NETGEX sits at 200, creating a natural upside magnet.
* Large call walls at 196, 200, 202.50, supporting upward drift.
* Positive GEX blocks (GEX9, GEX10) align with continuation toward 200–203.
* Put walls are weak above 188 — little downside defense for bears.
Interpretation
GEX strongly favors upside continuation as long as NVDA remains above 192–193.
A break above 196 triggers dealer hedging, pushing price toward 200.
Options Trading Plan (GEX-Based)
Bullish Plan
If price breaks above 196 with momentum:
Contracts to consider:
* 197.5C
* 200C
Targets:
* 198.50 → 200 → 202.50
Reason:
Above 196, market makers are forced to hedge upward, accelerating price toward the strongest GEX cluster at 200.
Bearish Plan
Only valid if NVDA rejects 196 with strong selling:
Contracts to consider:
* 193P
* 190P
Targets:
* 193.50 → 192.00
Reason:
Below 193, GEX becomes lighter and liquidity flows toward 188.
Final Bias for Nov. 20
NVDA is showing strong bullish structure after breaking the descending channel.
As long as price holds above 192–193, the probability of testing 196 and pushing toward 200 remains high.
Bearish setups only activate with a clean rejection at 196.
Disclaimer
This analysis is for educational purposes only and not financial advice. Always perform independent research and manage risk appropriately.
Nvidia (NASDAQ: $NVDA) Smashes Q3 Expectations on AI Demand Nvidia (NASDAQ: NASDAQ:NVDA , XETRA:NVD) posted another blockbuster quarter as its fiscal Q3 results exceeded Wall Street expectations, powered almost entirely by explosive demand for its AI-focused data center chips. Revenue reached $57.01 billion, beating the $55.19 billion consensus and climbing 62% year-over-year. Adjusted EPS came in at $1.30, up 60% from last year and 24% sequentially.
The data center division once again carried the quarter with $51.2 billion in revenue, outperforming analyst estimates of $49.34 billion and rising 66% from a year ago. Nvidia highlighted record demand for its Blackwell platform, which delivers industry-leading performance and 10x throughput per megawatt compared to previous generations. CEO Jensen Huang said AI compute demand continues to accelerate across both training and inference, calling it a “virtuous cycle of AI.”
Other business segments posted mixed results. Gaming revenue grew 30% year-over-year to $4.3 billion but dipped slightly from the previous quarter. Professional visualization revenue increased 56% to $760 million, and automotive revenue rose 32% to $590 million, reflecting steady diversification outside core AI markets.
Nvidia reported adjusted operating income of $37.75 billion and adjusted net income of $31.77 billion, both well above expectations. Free cash flow hit $22.09 billion, and the company returned $37 billion to shareholders through dividends and buybacks in the first nine months of fiscal 2026.
For Q4, Nvidia guided revenue of $65 billion, well above the $61.98 billion consensus, and projected gross margins around 75%. The company expects global AI adoption to accelerate further as more startups, enterprises, and countries ramp up model development.
Shares rose 3.7% in after-hours trading following the earnings release.

Nvidia: Downside Pressure Nvidia has recently faced notable downward pressure, but so far has managed to hold above the support level at $176.21. As a result, we continue to anticipate an imminent rally as part of the beige wave V, which should lift the stock into the now-red Target Zone between $227.38 and $260.60. However, if the stock immediately drops below the $176.21 mark, we would expect a new low for the beige wave alt.IV, with the lower $145.50 level still likely to hold.

NVDA Earnings Trade LevelsThe story of NVIDIA is one of unprecedented growth and valuation for perfection. Analysts forecast earnings of $1.25 per share on revenue of approximately $54.9 billion—a near 60% year-over-year jump. However, simply beating these numbers may not be enough to satisfy the market; the true focus is on the Q4 guidance. The street is looking for guidance above $61.57 billion to fuel the next leg up.
The market is currently expecting a massive post-earnings swing, with options pricing implying the stock could move approximately ±7.7% in either direction. This makes the technical trendlines provided the ultimate risk management map .
Bullish Scenario (The "Beat and Raise"): A significant beat on revenue (above $55 billion) and strong guidance (above $61.57 billion) would confirm the massive multi-year backlog for the Blackwell and Rubin architectures and likely trigger a rally.
Ultimate Target$206 - $221Targeting the Upper light Pink Trend Line and the confluence of recent analyst price targets (ranging from $230 to $275).
Bearish Scenario (The "Disappointment")A miss on guidance or an indication of slowing Data Center demand (which makes up nearly 90% of revenue) could lead to a sharp correction, challenging the current bullish structure.
$186 break below the Pink Trend line Trend Line would indicate a major technical break and might pause at $173 and ultimately go to $148 signaling a high-conviction short position is valid and that the aggressive AI trend may be over.
This is for educational purposes only and is not financial advice. Trading involves substantial risk, and you could lose money. Always consult with a qualified financial professional.

NVDA Earnings Play: Bullish Calls Despite Katy Neutral BiasNVDA QuantSignals V3 — Earnings Play (2025-11-19)
Direction: BUY CALLS
Confidence: 68% (Medium Conviction)
Risk Level: Moderate
🎯 Trade Setup
Strike: $180
Expiry: 2025-11-21
Entry Range: $9.30 – $9.40
Target 1: $18.60
Target 2: $27.90
Stop Loss: $4.65
Position Size: 3%
📈 Key Metrics
Current Price: $185.06
Implied Move: $13.15 (7.1%)
PCR: 0.46 (Bullish)
24h Move: +0.48%
RSI: 31.3
Support: $180.52
🧠 Analysis Snapshot
Katy AI Prediction: Neutral → slight bearish drift toward $183.56–184.20
Technical Indicators: Mixed (MACD bullish, ROC bearish)
News Sentiment: Strongly Bullish
$100B AI infra deal w/ Brookfield
Presidential endorsement
AI chip testing breakthroughs
Options Flow: Heavy call activity; institutional size at higher strikes
Volatility: VIX 23.25 — elevated
⚡ Why This Trade Works
Bullish news + strong call flow overpowers Katy’s neutral/slightly bearish modeling
Earnings volatility + catalysts create a favorable upside skew
0.63 delta strike gives balanced risk/reward
⚠️ Notes
Moderate confidence → consider smaller sizing
Expect heavy volatility due to 7.1% implied earnings move
Low pre-earnings volume → scale entries if possible

Pop and drop part deuxLooks like that is possible, although right now it definitely feels more bullish than not. I think the market will be choppy the next few days at least. Gold is at resistance. VIX looks like an ABC forming. Oil falling but likely a test of the bottom before a rally. BTC could get to 92500 but it will find resistance there. Good luck!

NVIDIA is CISCO 2.0 NVIDIA is a $20-$30 Stock without the Data Centers. There is zero demand for Data Centers. We are seeing the second Dot.com Bubble. NVIDIA is CISCO 2.0. CISCO dropped 80-90% after the Dot.com price discovery happened. This is coming in 2026.
