Oracle (ORCL) Share Price Rebounds Ahead of Earnings ReleaseOracle (ORCL) Share Price Rebounds Ahead of Earnings Release
Oracle is due to publish its quarterly results today after the close of the main trading session. Analysts are expecting solid year-on-year growth compared with the same period last year:
→ Revenue: forecast to rise by around 15% to $16.15–16.2 billion.
→ Earnings per share (EPS): expected at $1.63–1.65, up roughly 11%.
At the same time, the market’s focus will be on the company’s plans in two key areas:
→ Order backlog growth: investors are looking for confirmation that demand for AI infrastructure remains strong. Previously, orders exceeded $500 billion.
→ Debt and capital expenditure (capex): Oracle is spending aggressively on data centres (capex could rise to as much as $25 billion per year) while taking on additional debt. This has raised concerns that costs may be increasing faster than the actual profits generated from AI.
Today’s results are particularly important in light of the market reaction to the previous earnings release.
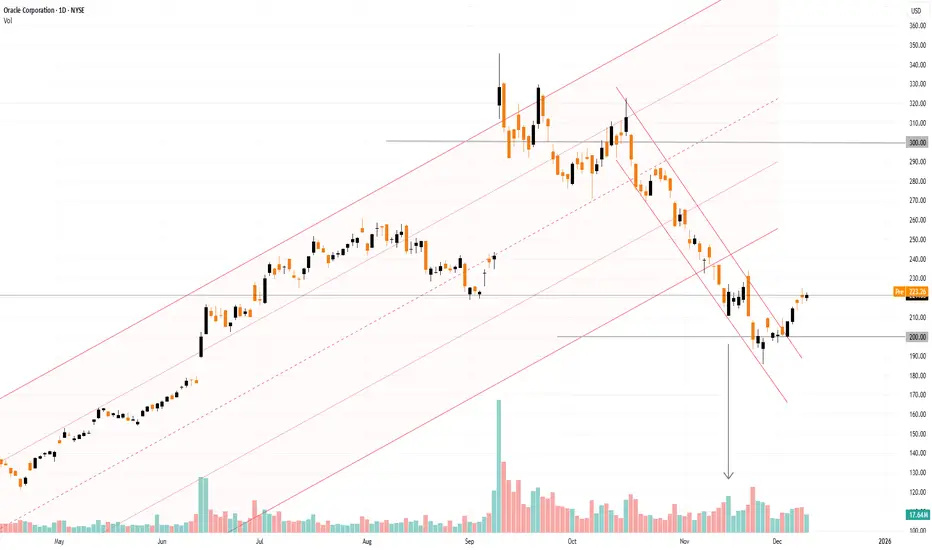
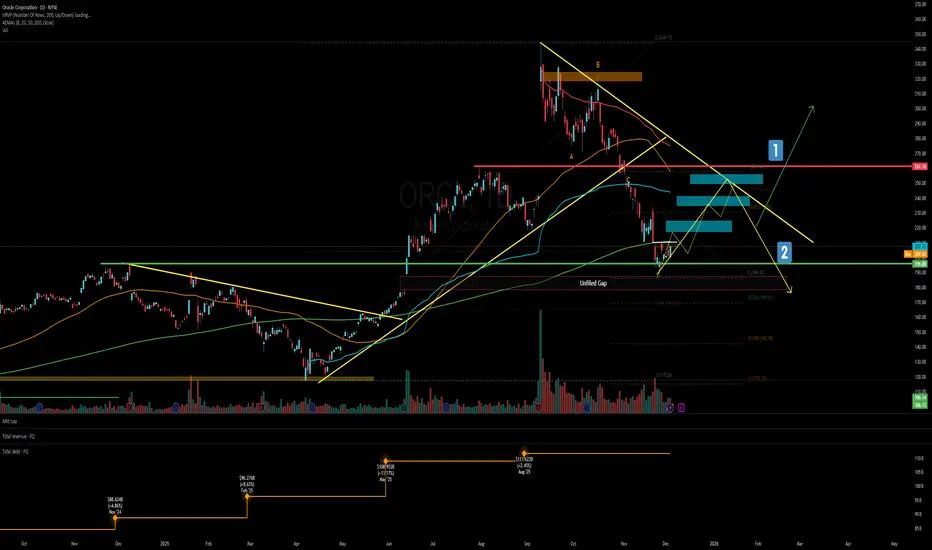
On 15 September, we noted that ORCL shares surged with a bullish gap above the psychological $300 level. Since then, however, the share price has fallen by more than 30%. One possible explanation is that “smart money” used the spike in speculative demand to lock in profits on long positions — a view supported by exceptionally high trading volumes. Once demand faded, the price moved lower within a descending channel.
Within the broader long-term channel (shown in orange), the price briefly broke below the lower boundary but failed to follow through. Meanwhile, the narrowing candle body on 21 November (marked by the arrow), combined with a spike in volume, may suggest that institutional investors were absorbing selling pressure, potentially signalling expectations of higher prices ahead.
Positive signs include:
→ a false bearish break below the psychological $200 level;
→ a break of the red downward trajectory;
→ a rise in ORCL shares in pre-market trading today.
If Oracle’s actual results and management’s outlook impress investors, the ORCL share price could move back into the orange ascending channel.
This article represents the opinion of the Companies operating under the FXOpen brand only. It is not to be construed as an offer, solicitation, or recommendation with respect to products and services provided by the Companies operating under the FXOpen brand, nor is it to be considered financial advice.
Oracle Corporation Shs Cert.Deposito Arg.Repr. 0.3333 Shs
No trades
Market insights
ORCL - From Erections Come CorrectionsORCL is a textbook example of a setup I call: “From Erections Come Corrections.”
1. It also shows why log charts lie to you on the way down.
When you’re evaluating downside risk, remember: every stock is always 100% away from zero.
A linear chart makes the real danger obvious. I don’t even need to measure this one — the drop is roughly 50% staring you in the face.
2. Look at the speed of that drop.
If you’re one of those heroes trying to squeeze an extra 3% at the top and end up wearing a -50% drawdown because you had no exit plan… that’s not bad luck — that’s greed and negligence teaming up to hand you a bag of sh*t.
3. But if you actually respected risk, took profits, and GTFO/STFO with cash in hand?
Now you get to walk back in as a well-refined gentleman or lady, gracefully to start building a position at at a “500% discount,” as Trump would say.
4. Notice anything magical on my chart?0
No algos. No secret indicators. No fairy-tale narratives. Not even candlesticks. Just plain vanilla price action.
That’s proper charting. Keep it simple.
You chose to play this game, so at least play it right.
Lastly, if the market tanks here, ORCL will just keep tanking as well. BUT! you will be getting in with a 50% discount already. That, my friends, is the difference.
THANK YOU for getting me to 5,000 followers! 🙏🔥
Let’s keep climbing.
If you enjoy the work:
👉 Drop a solid comment
Let’s push it to 6,000 and keep building a community grounded in truth, not hype.

Oracle - A very clear buy signal!🚪Oracle ($NASDAQ:ORCL) is just 100% bullish:
🔎Analysis summary:
For the past two decades, Oracle has been in a very strong bullish market. And with the recent -40% correction, this trajectory did not change at all. In fact, we are just witnessing a bullish all time high break and retest so Oracle will create another rally quite soon.
📝Levels to watch:
$200
SwingTraderPhil
SwingTrading.Simplified. | Investing.Simplified. | #LONGTERMVISION

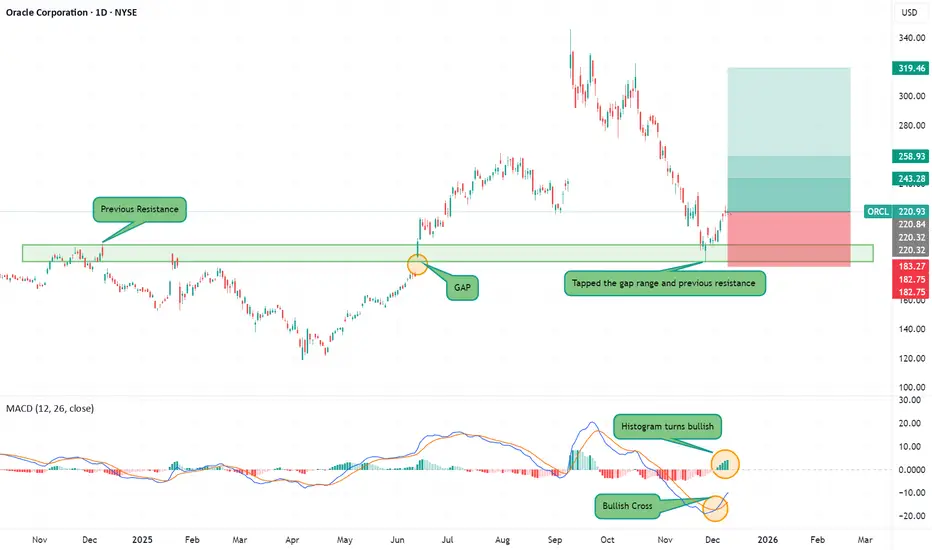
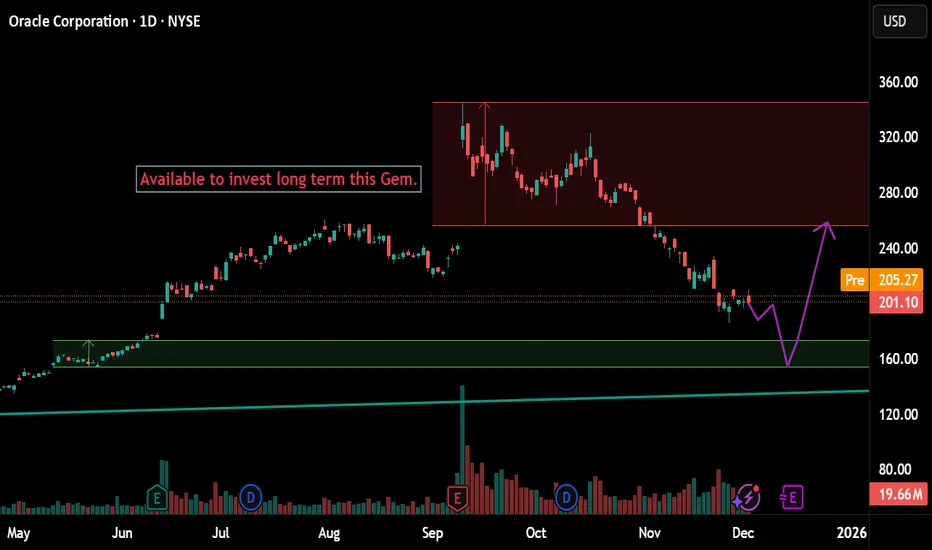
Bullish Setup – Oracle (ORCL) Technical Overview:
Oracle has successfully retested and reclaimed a major former resistance zone, which now acts as a strong support area on the daily chart.
Price recently tapped the gap area and previous resistance, followed by a bullish reaction from support, signaling buyer interest at these levels.
MACD is showing a fresh bullish crossover, while the histogram has turned positive — confirming a potential momentum shift to the upside.
As long as price holds above the reclaimed zone, the structure favors a medium-term bullish continuation.
Fundamental Momentum:
Oracle remains one of the key beneficiaries of the AI and cloud infrastructure boom, with strong demand for its data center and AI-related services.
Its AI partnerships and cloud backlog continue to expand, supporting medium-term revenue visibility.
The recent pullback came amid broader market hesitation and profit-taking, not company-specific weakness — creating a technically attractive dip-buying opportunity.
Upcoming earnings tomorrow ( December 10 ) After Market Close will most likely bring a big movement. It is up to you if you enter today or after earnings , based on your risk tolerance. I am buying shares now and have some money aside to buy again in case of a drop.
Trade Idea – Swing Long Setup
Entry Zone: $218 – $222
Stop Loss: $183 (below the reclaimed support and recent swing structure)
Take Profit Levels:
TP1: $243 → First resistance and local supply zone.
TP2: $259 → Next higher resistance from previous range.
TP3: $319 → Full bullish extension and trend continuation target.
Risk Note:
Oracle is still sensitive to broader tech sentiment, interest rates, and earnings expectations. Partial profit taking at TP1 is recommended, with stop moved to breakeven to protect capital.
Looking for a position to buy ORCLIt's coming off a fairly long bearish correction, and I'm seeing a pullback forming... I'd like to buy at $200.

Oracle Earnings: Medium-High Risk Call Setup(Post-Market Signal)ORCL Earnings Signal | 2025-12-10
Signal: BUY CALLS
Confidence: 65% (Medium)
Expiry: 12/12/2025 (2 days)
Strike: $225.00
Entry Range: $10.30 – $10.45 (mid $10.38)
Target 1: $15.45 (+50%)
Target 2: $20.60 (+100%)
Stop Loss: $7.25 (–30%)
Position Size: 2–3% of portfolio
Risk Level: Medium-High
Katy AI predicts slight bearish trend (-0.58% short-term)
Conflicting signals: LLM = BUY CALLS, Katy = BUY PUTS
High IV (168–176%) → premium expensive, theta decay faster
Historical earnings beat rate: 25% → caution advised
Technical Overview:
Current price $222.50, up +0.77%
4.4× average volume → strong institutional participation
Support: $216.91 | Resistance: $225–230
Momentum near session highs; MACD and multi-timeframe trend confirm bullish regime
Fundamental & News:
“Secret AI Weapon” healthcare data advantage
Mixed sentiment, leaning bullish
Positive earnings guidance and institutional accumulation
Options Flow: Neutral, no unusual activity
Balanced delta selection (0.4–0.6)
PCR neutral
Why This Trade:
Strong bullish composite score (+3.2)
Exceptional volume + revenue growth
Positioned to capture post-earnings momentum
Important Notes:
Conflicts with Katy’s bearish prediction → exercise caution
2-day expiry requires precise timing; consider scaling in
Tight stop loss protects against unexpected moves

$ORCL -0.272 RejectionWhat it dew yall, So NYSE:ORCL -0.272 Rejection says: "it wasnt ready for the -0.618 target". So the price action should find Liquidity in the Levels above (green Boxes) before deciding if its going to continue downward.
Happy Trading, Alerts Set

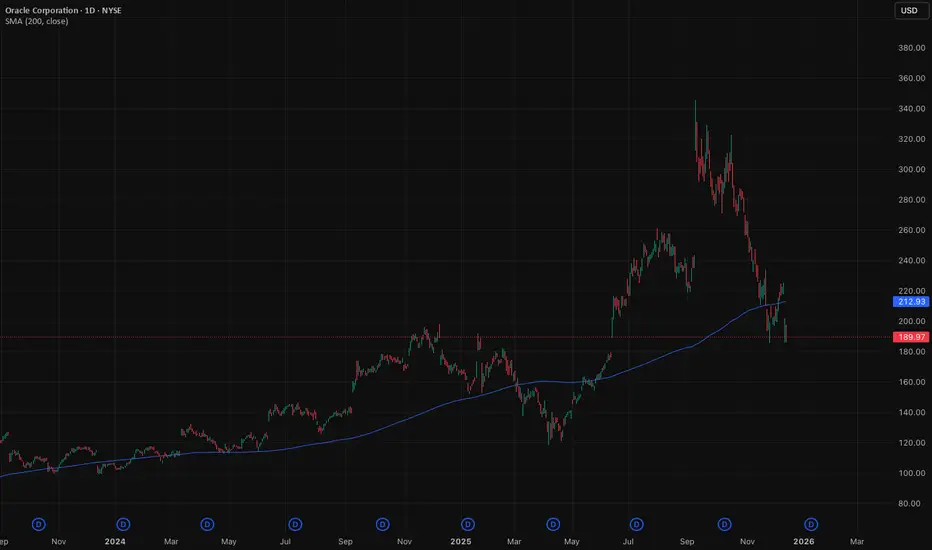
Oracle down, more to comeWe're upgrading our Oracle recommendation and maintaining our Short call. The stock is down around 30% since our initial note in September , and we think there is more downside now that the price is trading sub $200 per share.
If the stock doesn't bounce back above the 200-day moving average, we could see more downside into the mid $100 per share range. Potentially finding support around $120-125 range mark.
The forecasts provided herein are intended for informational purposes only and should not be construed as guarantees of future performance. This is an example only to enhance a consumer's understanding of the strategy being described above and is not to be taken as Blueberry Markets providing personal advice.
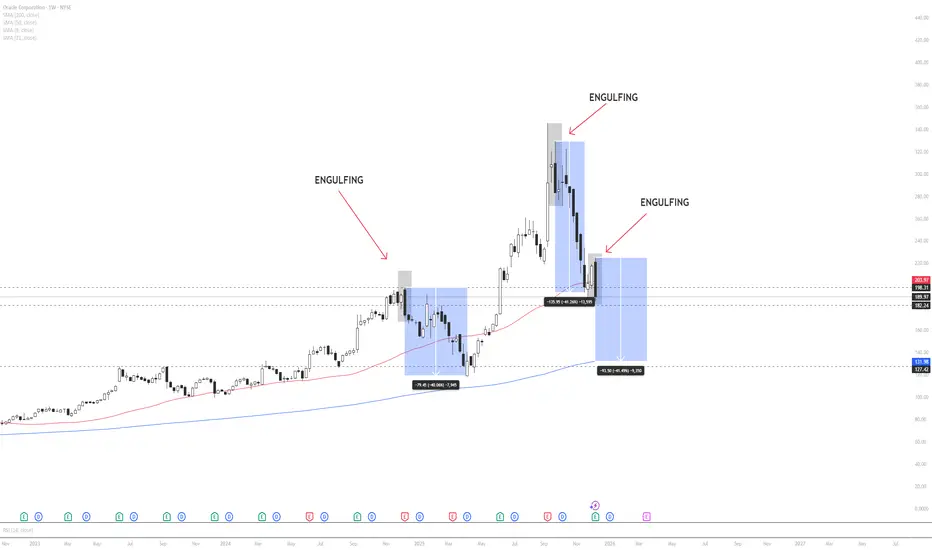
ORCL – Weekly Technical & Historical AnalysisOracle is currently trading in a weekly consolidation (flat) zone, indicating a neutral market structure. However, price has closed below the 50-period moving average , which often signals a shift in medium-term momentum.
A key technical development is the appearance of a weekly bearish engulfing candle, a pattern that historically precedes sharp downside moves in ORCL.
When analyzing previous occurrences of similar engulfing patterns, price declined by approximately 40% in the first instance and showed a nearly identical drawdown in the second instance. If historical behavior repeats , price may continue lower toward the 200-period moving average and the major support zone marked on the chart, which aligns closely with a projected ~40% correction.
Markets often exhibit recurring behavioral patterns, especially in higher timeframes. For this reason, downside risk remains elevated unless price reclaims the 50 MA and invalidates the engulfing structure.
This analysis is based on historical probability and technical structure and is not financial advice. Traders should manage risk accordingly.
Oracle (NYSE: $ORCL) Tanks After Revenue MissOracle Corporation (NYSE: ORCL) suffered a sharp selloff after its latest quarterly earnings report, with shares plunging more than 16% as the market reacted negatively to a revenue miss. The decline erased months of gains and dragged the stock back below levels last seen before its major September rally. Despite the market panic, the underlying fundamentals reveal a more nuanced story.
Oracle’s reported revenue once again fell short of analyst expectations—continuing a trend seen in previous quarters. In Q1, the company also missed both earnings per share and revenue estimates, though optimism around its cloud growth overshadowed the weakness at the time. This quarter, without a headline-grabbing cloud announcement, investors reacted more aggressively to the top-line disappointment.
However, Oracle’s Remaining Performance Obligation (RPO)—a key forward-looking metric reflecting future contracted revenue—beat expectations significantly. The company reported $523 billion in RPO, surpassing the Street’s projection of $500 billion. Analysts, including Wedbush’s Dan Ives, argue that the selloff is overstated and does not reflect the long-term growth trajectory of Oracle’s AI-driven cloud strategy. Oracle remains deeply integrated in AI infrastructure through its massive multi-year deals, including the $300 billion computing partnership with OpenAI.
Technical Analysis
The ORCL chart shows a decisive breakdown from a critical support zone around $210–$215. This level, previously a strong demand area, failed to hold as heavy selling pressure drove the stock into a deeper correction. The breakdown was accompanied by elevated volume, confirming strong bearish participation.
Price is now sitting within a broader weekly support range near $190–$200. A bounce from this zone could trigger a recovery push toward $300 and eventually $345 if sentiment shifts. However, failure to reclaim the demand region leaves the path open for a deeper slide toward $121, where the next major structural support lies.

$ORCL accumulate & hold for the next 2 years- NYSE:ORCL is a buy after 50% decline from the top.
- Accumulating NYSE:ORCL and plan to hold for next 2 years.

Oracle looks very attractive for a longer period investmentsAfter not the most positive data earnings price of Oracle went down and according the charter, I found few important support levels where the price can react and value of this stock to grow.
Not as a trading opportunity and as a longer term investment, price of Oracle seems attractive. At the current support levels I'm planning to buy and buy more If the stock price will go more down according the chart.
In the graphic are showed the levels were the stock price can react

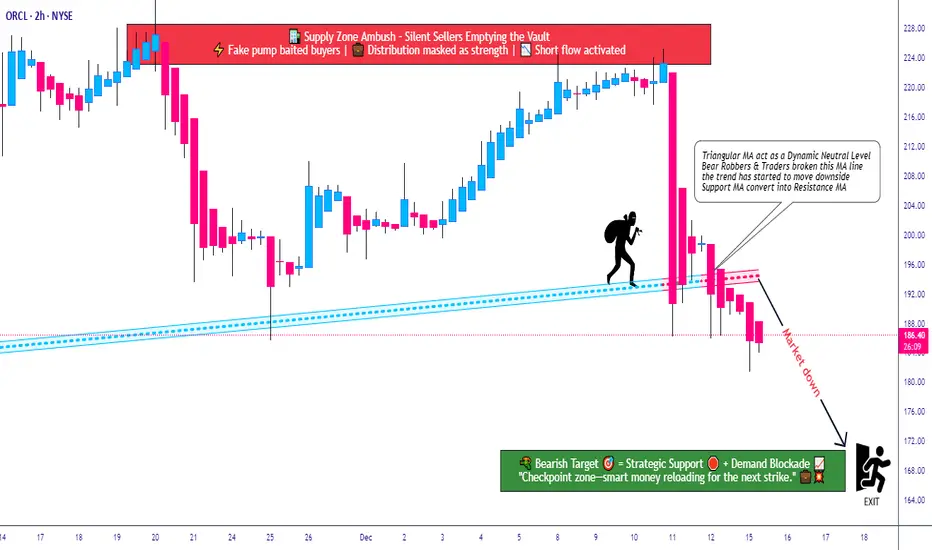
ORCL Breakdown Zone Activated — Downside Pressure Builds!🔻 ORCL Bearish Breakdown Playbook | Smart Money Trap Ahead? 🔻
📌 Asset
ORCL — Oracle Corporation
NYSE Exchange | Stock Market
Trading Style: Swing / Day Trade
📉 Market Bias
Bearish Structure Confirmed
Price action confirms a Triangular Moving Average (TMA) breakdown, signaling momentum exhaustion and increasing downside probability. Sellers remain in control as volatility expands after the structure break ⚠️📊
🎯 Trade Plan (Thief Style – Market Adaptive)
🔹 Entry:
Market-responsive entry — no fixed price level.
(Allow price to confirm direction; avoid emotional entries 🧠)
🔹 Stop Loss:
🛑 Thief SL reference: 205.00
This level is shared for educational context only. Risk management remains fully trader-dependent.
📝 Note:
Dear Ladies & Gentlemen (Thief OG’s), this is not a recommendation to use only this stop loss. You manage risk according to your own strategy and comfort.
🔹 Target Zone:
🎯 170.00
This level aligns with:
✔ Strong historical support
✔ Oversold conditions
✔ Potential liquidity trap
✔ Correlation-based confluence
⚠️ As price approaches this zone, partial or full profit protection is advised. Smart exits matter more than perfect targets.
📝 Note:
Dear Ladies & Gentlemen (Thief OG’s), this target is not mandatory. Adapt your take-profit based on live price behavior and personal risk rules.
🔗 Correlated Markets to Watch 👀
📌 NASDAQ:QQQ – Nasdaq weakness often amplifies downside pressure on ORCL due to tech sector correlation.
📌 NASDAQ:MSFT – Relative weakness here can signal broader enterprise-tech selling.
📌 NASDAQ:AAPL – Risk-off sentiment in mega-caps may accelerate momentum continuation.
📌 TVC:DXY – Dollar strength can pressure equities, supporting bearish follow-through.
➡️ If correlated assets show risk-off behavior, ORCL downside probability increases.
🧠 Key Takeaways
✔ Trend bias favors sellers
✔ Breakdown structure validated
✔ Risk management > prediction
✔ Adapt to price, don’t marry levels
⚠️ Disclaimer
This is a thief-style trading strategy, shared for fun and educational purposes only.
Trading involves risk. You are fully responsible for your decisions and outcomes.
✨ “If you find value in my analysis, a 👍 and 🚀 boost is much appreciated — it helps me share more setups with the community!”
#ORCL #Oracle #BearishSetup #StockMarket #SwingTrading
#DayTrading #TechnicalAnalysis #SmartMoney
#NYSE #TradingView #RiskManagement #ThiefStyle
Is Oracle’s AI Growth Hitting a Structural Wall?Oracle Corporation (ORCL) stands at a defining juncture where aggressive cloud expansion collides with the physical limits of infrastructure scaling. Despite a strategic pivot that has positioned Oracle Cloud Infrastructure (OCI) as a primary engine for artificial intelligence workloads, the stock has retreated approximately 35% from its September peak. This volatility reflects a market grappling with a dual narrative: the immense promise of a $300 billion AI pipeline and the operational fragility of concentrating heavily on a single client, OpenAI.
Geopolitics and Geostrategy: The Sovereign Advantage
Oracle has effectively weaponized data sovereignty as a competitive moat. Unlike hyperscale rivals often viewed with skepticism in Europe and Asia, Oracle’s dual-region sovereign cloud strategy allows governments to retain strict legal control over data residency. This approach insulates a portion of Oracle’s revenue from protectionist policies and US-China trade tensions, positioning OCI as the "neutral" vendor of choice for state-level actors requiring air-gapped security for sensitive workloads.
Industry Trends and Macroeconomics: The Capacity Wall
The macro environment presents a paradox for Oracle. High interest rates have inflated the cost of debt just as the company accelerates capital expenditures (CapEx) to build AI data centers. Simultaneously, the industry faces a hard physical ceiling: power availability. In key markets like Northern Virginia and Silicon Valley, grid connections face multi-year delays. Oracle’s ability to secure gigawatt-scale power for its "Stargate" class projects will be the primary determinant of whether it can convert its record bookings into recognized revenue before 2027.
Business Models: The OpenAI Concentration Risk
Oracle’s shift from license-based legacy software to consumption-based cloud revenue is accelerating, but the quality of this revenue is under scrutiny. Recent disclosures reveal that a significant percentage of the company’s Remaining Performance Obligations (RPO) is tied to OpenAI’s massive infrastructure demands. While this validates OCI’s technical prowess, it introduces binary counterparty risk. If OpenAI faces regulatory headwinds or funding slowdowns, Oracle’s growth narrative could face an abrupt repricing.
Technology, Cyber, and Patent Analysis
Technologically, Oracle differentiates itself through automation. Its Autonomous Database utilizes machine learning to self-patch and self-tune, theoretically reducing the cyber attack surface by eliminating human error—the leading cause of data breaches. Patent analysis suggests Oracle is aggressively protecting this "self-driving" database architecture, aiming to lock in enterprise clients who prioritize security over the raw compute cost advantages offered by generic cloud providers.
Management and Leadership: The Aggressive Pivot
Under the stewardship of Larry Ellison and Safra Catz, Oracle’s culture remains unapologetically aggressive. The leadership has demonstrated a willingness to sacrifice short-term margins for long-term capacity, a strategy reminiscent of Amazon’s early AWS days. However, this high-stakes bet requires flawless execution in supply chain management, particularly in securing Nvidia GPUs amidst global shortages.
Stock Performance and Technical Status
Technically, ORCL is testing critical support zones after its sharp 35% correction. The sell-off was triggered by the realization that bookings growth does not equal immediate cash flow. Investors are currently demanding proof of "broad-based demand"—evidence that OCI is winning enterprise clients beyond the headline-grabbing AI labs. Until this diversification is proven, the stock remains vulnerable to volatility.

sell overnight ralliesWeekly/daily structure = Markdown, Phase E (trend is down; bounces are rallies-in-a-downtrend).
The mid-Nov → early-Dec lift looks like a countertrend rally / LPSY attempt, and this dump is consistent with markdown continuation, not a new accumulation.

Oracle-Time to start buying?Currently at 100 EMA Weekly trend line, forming “handle” at previous ATH Support
Fundamentally strong company, good time to start buying?

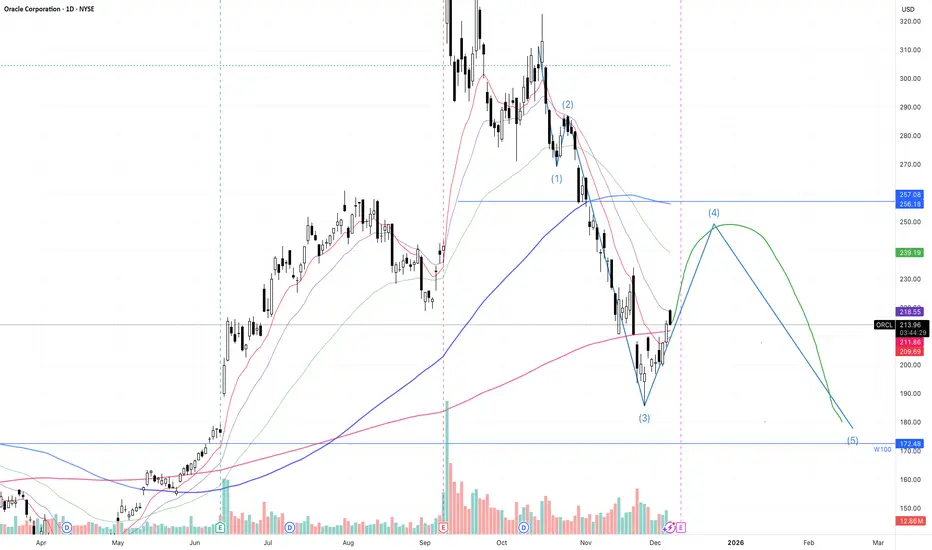
Orcl could be entering a wave 4. Oral looks like it just completed a wave 3. I am expecting a wave 4 bounce from here. It retook the Daily 200, my target for wave 4 is the Daily 100. From there a possible roll over and gap fill, but will have to see what the price action does around the D100.
ORCL QuantSignals V3: Speculative Earnings Call OpportunityORCL QuantSignals V3 – Earnings Signal (2025-12-09)
Direction: BUY CALLS
Confidence: 58% (Low Conviction)
Expiry: 2025-12-12
Strike Focus: $222.50
Entry Range: $11.10
Target 1: $16.50
Stop Loss: $8.25
24h Move: +2.27%
Flow Intel: Neutral
⚠️ High Risk Notice:
This is a high-uncertainty earnings setup with a direction conflict between the LLM model and Katy AI. Use reduced position sizing.
Katy Conflict Warning
LLM Recommendation: BUY CALLS
Katy Price Prediction: -0.88% → Suggests BUY PUTS
Katy Confidence: 50%
Resolution: Models disagree — treat this as a speculative earnings trade only.
Analysis Summary
Katy AI: Neutral overall, but time-series shows most predictions below $220 → slight bearish pressure
Technical Setup:
Price: $221.22, testing resistance at $224.75
Support: $213.62
Volume: 0.8× average
News Sentiment: Mixed but leaning optimistic; extreme YoY revenue spike (17,198%) gives underlying strength
Options Chain:
IV ~147%, Delta 0.508 → balanced probability
Risk: High — ORCL has only 25% past earnings beat rate

ORACLE : Support Level available to invest.Buying Levels :CMP : 201.10
if decline : add. 173-153..
SL : 138
Target : 250, 304, 344+ then review..
Manage Your Risk ...
ORCL - Up Or DownORCL's debt clock ticking and CDS are expensive.
Anyways, it's little bit oversold here. We can see a little bounce here.
Earnings next week can ramp this up a little. Prefer to play via shares rather than options.
Long anywhere here.
Target 1 - 223
Target 2 - 240
Target 3 - 252
Stop loss - 200, can be 180 but it's too wide.
$ORCL - Large correction, time for a reversal now, strong setup.Bought NYSE:ORCL
Large correction, It's time for a reversal now, strong setup.

Oracle Corporation rebound potential from oversold territory
Current Price: $189.97
Direction: LONG
Confidence Level: 62% (Price is testing multi-session support with several traders and X sentiment indicating potential short-term bounce to resistance)
Targets:
- T1 = $195.00
- T2 = $200.00
Stop Levels:
- S1 = $187.00
- S2 = $185.00
**Wisdom of Professional Traders:**
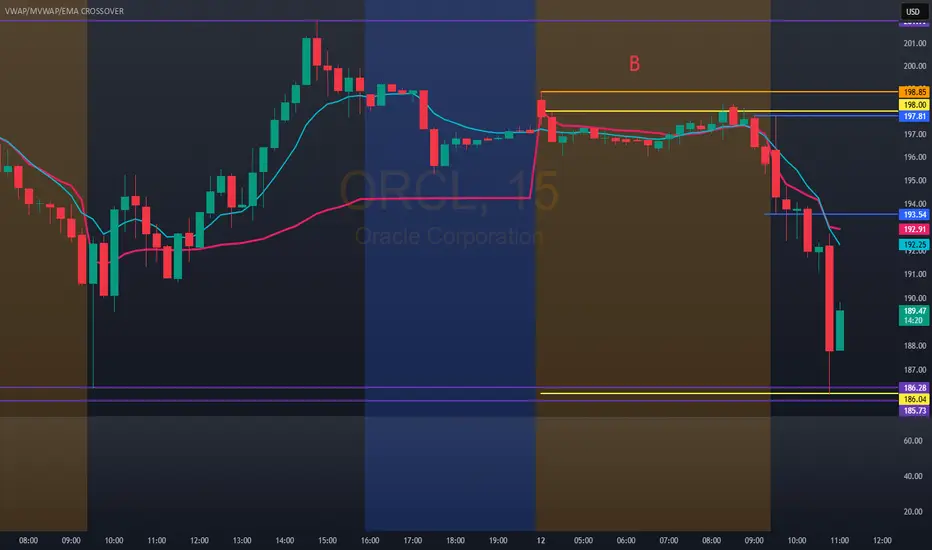
I’m combining the perspectives of many seasoned traders who are closely tracking Oracle’s current setup. The collective view points to the $185 support zone as a critical level that has held despite heavy selling after earnings. Several traders note oversold conditions and early positive MACD signals, which, in their experience, are telltale signs of a relief rally forming. The consensus is to play this as a short‑term LONG swing toward $200, keeping risk tightly defined.
**Key Insights:**
The main driver here is the technical backdrop. Oracle’s price has been in a steep decline from $225 in November, accelerated by an 11% post‑earnings drop. This plunge has pushed RSI to 38 — oversold for a large‑cap tech stock — prompting contrarian buyers to step in. Multiple traders have zeroed in on the 50‑day SMA around $185 as a safety net that has repeatedly attracted buying. A push toward the $195–$200 resistance band is in play this week if support holds.
What’s interesting is that bullish sentiment on X was fueled by “no‑delay” contract headlines, adding a short‑term catalyst amid an otherwise mixed fundamental picture. MACD histogram flips to the positive on shorter timeframes strengthen the case for a bounce despite the bigger trend being down.
**Recent Performance:**
You can see this setup clearly in recent action: Oracle slid from early November highs near $225 to the high $180s last week. On 14 December, volume spiked over 70M shares as price tested $185 intraday but reversed higher — a sign of strong reaction buying. Since then, trading has been in a tight $188–$192 band, indicating consolidation and a potential base for upside movement.
**Expert Analysis:**
Several professional traders I track point to a recurring Oracle pattern: when the stock gaps lower on earnings misses but remains above key support, dip buyers often drive a snapback rally. This week’s trade fits that mold. The first real hurdle is $200, which most agree is the “take profit” zone for a fast swing. They caution against holding beyond that without fresh bullish catalysts, noting the primary chart trend remains bearish. The modest net bullish sentiment seen in X postings lines up with this opportunistic approach.
**News Impact:**
Recent headlines are split — Oracle’s cloud growth is lagging, and AI spending ran hotter than anticipated, which hurt cash flows. On the flip side, management confirmed major contracts are on track, cooling execution fears and giving bulls a talking point. In a market wary of AI buildout delays, that confirmation has enough weight to encourage short‑term buying into a technical bounce.
**Trading Recommendation:**
Here’s my take: enter near $190 with stops just under $187 and a hard stop at $185. Aim for $195 as the first target and $200 if momentum carries through resistance. Keep position sizes modest, as overall trend risks remain. This is a tactical LONG trade — take profits into strength and avoid overstaying if resistance proves stubborn. A decisive break above $195 early in the week could justify holding for $200, but protect gains quickly thereafter.

Hello trader, this is the result for ORCL 192.00 #2www.tradingview.com
In the first part, we had mentioned and marked both the bullish and bearish entry points.