O'Reilly Breaks Down from Double Top + Evening Star Confirmation🧩 Pattern Overview
O'Reilly has broken down from a well-defined Double Top pattern , signaling a potential reversal in trend from bullish to bearish. The breakdown suggests that sellers have regained control after failing to push the price to new highs.
🌇 Candlestick Confirmation
Adding weight to the bearish view, an Evening Star candlestick pattern has formed on the daily chart. This classic reversal pattern indicates exhaustion of buying momentum and the beginning of a downward move.
📊 Technical View
Price has closed below the neckline of the double top formation.
The breakdown structure indicates a shift in sentiment from accumulation to distribution.
Momentum indicators are aligning with the bearish bias, confirming weakness.
🎯 Target Projection
Based on the double top breakdown, the projected downside target is around 98.4 , derived from the measured move of the pattern.
💡 Trading Insight
Traders can watch for a minor pullback or retest towards the breakdown zone as a potential entry opportunity. The combination of a confirmed pattern breakdown and an evening star candlestick provides a strong bearish setup with clear directional bias.
Trade ideas

Bears Crushed at the Pitchfork - Bulls Loading📊 **To view my confluences and linework:**
Step 1️⃣: Grab the chart
Step 2️⃣: Unhide Group 1 in the object tree
Step 3️⃣: Hide and unhide specific confluences one by one
💡 **Pro tip:** Double-click the screen to reveal RSI, MFI, CVD, and OBV indicators alongside divergence markings! 🎯
---
Title: 🎯 ORLY: Bears Crushed at the Pitchfork - Bulls Loading
The Market Participant Battle:
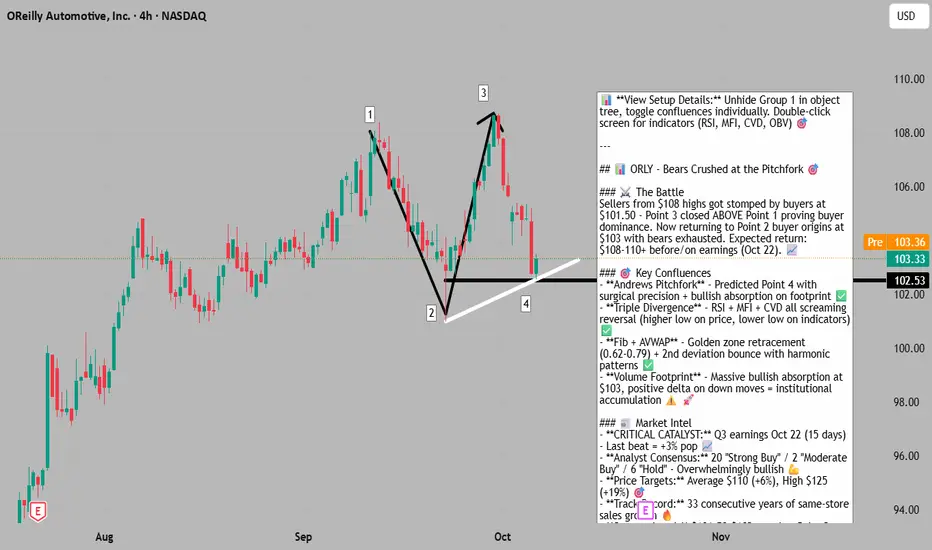
📉 The sellers from point 1 (September highs near $108) threw everything they had at ORLY, driving it down through a vicious downtrend. But here's what they missed: the buyers who stepped in at point 2 (around $101.50 in late September) were stronger. How do we know? Because price closed ABOVE point 1's level at point 3, proving buyer dominance.
Now at point 4 (~$103), we're witnessing the classic return-to-origin play. Price has retraced back to where those powerful point 2 buyers established their position, right at the Andrews Pitchfork median line and the 0.62-0.79 Fibonacci sweet spot. The bears just burned all their ammunition getting here, and the bullish absorption on the footprint shows smart money is quietly accumulating. This is the classic trap: bears think they're winning, but they just helped bulls load up at wholesale prices before earnings. 🎯
Expected Move: Rally back toward $108-110+ over the next 2-3 weeks, with Q3 earnings (October 22) potentially acting as the catalyst. 📈
Confluences:
Confluence 1: Andrews Pitchfork + Volume Footprint Analysis
The 4H chart reveals a textbook Andrews Pitchfork setup anchored at points 1 (September 12 high), 2 (September 24 low), and 3 (October 3 high). The median line of this pitchfork predicted point 4's location with surgical precision - we're talking within a few cents. What makes this extraordinary is the volume footprint at point 4 showing massive bullish absorption: strong buying pressure (green bars) overwhelming selling attempts with positive cumulative delta readings. The delta boxes reveal institutional players stepping in with conviction - 8.2K buy delta, 87.76K total volume on key bars, and negative delta being absorbed without price breakdown. This is NOT retail panic; this is smart money positioning before the Q3 earnings catalyst. The pitchfork's lower parallel also provides additional support just below current levels, creating a high-probability reversal zone. AGREES ✔
Confluence 2: Triple Divergence Stack (RSI + MFI + CVD)
From point 2 to point 4, we have a textbook triple divergence scenario that's screaming reversal. While price made a higher low (point 4 at ~$103 vs point 2 at ~$101.50), THREE critical indicators made lower lows: RSI (oversold and diverging bullishly), MFI (money flow showing accumulation despite price weakness), and CVD (cumulative volume delta declining even as price stabilized). This triple divergence is like having three independent witnesses all testifying to the same thing: selling pressure is exhausted while buying interest is building. The RSI at point 4 is deeply oversold, matching typical pre-reversal conditions. When you stack three divergences together like this, the probability of a reversal jumps significantly - this isn't a maybe, it's a high-conviction setup. AGREES ✔
Confluence 3: Fibonacci Retracement + Anchored VWAP Confluence
The Fibonacci retracement from point 2 to point 3 places point 4 squarely in the golden zone (0.62-0.79 retracement), which is statistically the highest probability reversal area. Simultaneously, the anchored VWAP shows price returning to the 2nd standard deviation - a level where institutional algorithms often defend positions. This double confluence of Fib + AVWAP creates a powerful support magnet. Additionally, the presence of two major harmonic patterns (double bottom structure from points 2 and 4, plus an ascending triangle formation visible on higher timeframes) reinforces the bullish reversal thesis. The trendline analysis across 50-200 bar periods confirms an established uptrend that's merely correcting, not reversing. AGREES ✔
Web Research Findings:
- Technical Analysis: Stock currently at $103-104, down from recent highs of $107-108 (September 11). Key support identified at $101.50-$102 (matches user's point 2 level perfectly). Resistance at $104.97-$105. Mixed technical signals short-term but overall momentum remains bullish with stock up 36% YTD. Some technical sources show sell signals from moving averages, but momentum indicators turning positive.
- Recent News/Earnings: ⚠️ CRITICAL CATALYST: Q3 2025 earnings scheduled for October 22, 2025 (just 15 days away) after market close, with conference call October 23. Last earnings (Q2) beat expectations with $0.78 EPS (vs $0.77 expected) and 5.9% revenue growth YoY to $4.53B. Stock surged 2.9% on that beat. Company has posted 33 consecutive years of same-store sales growth - remarkable consistency. Q1 2025 showed 3.6% comparable store sales growth at high end of expectations.
- Analyst Sentiment: OVERWHELMINGLY BULLISH - 20 "Strong Buy" ratings, 2 "Moderate Buy", 6 "Hold", 0 "Sell" ratings among 28 analysts covering the stock. This is about as bullish as analyst consensus gets. Average price target: $110.20 (6% upside), with high target of $125 (19% upside). Recent analyst upgrades from Wolfe Research (initiated Outperform), multiple price target raises from JPMorgan, UBS, Guggenheim, Citi (raised to $114), Goldman Sachs, Truist, BMO Capital, RBC Capital.
- Data Releases & Economic Calendar: No major economic releases directly impacting ORLY before earnings. However, the October 22 earnings release IS the major catalyst here - it's both the biggest opportunity and the primary risk factor for this trade.
- Interest Rate Impact: Auto parts retail sector relatively insulated from rate concerns compared to auto sales. Consumer spending on maintenance remains resilient even in higher rate environments as people keep cars longer. No immediate Fed decisions affecting trade horizon.
- Sector Outlook: Auto aftermarket parts sector remains strong. O'Reilly operates 6,483 stores across US, Puerto Rico, Mexico, and Canada. Company investing $1.2-$1.3B in capex for 2025 expansion. Some concerns about margin pressure (expected decline from 19.5% to 19.2-19.7% in 2025) due to wage inflation and tech investments, but offset by strong fundamentals and pricing power.
- Valuation Considerations: Stock trading at P/E of 36.7x vs industry average of 17.3x - premium valuation reflecting strong growth and consistency. Some analysts flag overvaluation risk, but this is priced in by market betting on continued execution.
Layman's Summary:
Here's what all this means in simple terms: ORLY is like the kid who gets straight A's every semester (33 years of sales growth!), and the teachers (analysts) are giving them a standing ovation with 20 out of 28 saying "buy it now!" The stock recently fell from $108 to $103, but this is just a healthy pullback before the big test (earnings) on October 22.
Think of it like a coiled spring - the more it compresses (pullback), the more energy it stores for the next move up. The technical setup shows buyers are quietly stepping in right at a mathematically perfect support level ($103), and the footprint data proves big money is accumulating shares while prices are "on sale."
The earnings in 15 days are HUGE - last time they beat estimates, the stock jumped 3% in one day. Analysts expect them to beat again and are setting price targets around $110-125. The risk? If earnings disappoint, this trade fails quickly. But the odds favor continuation of their 33-year winning streak, and the technical setup couldn't be better positioned for a pre-earnings run. This is a high-conviction bullish setup with clear risk/reward. 💪
Machine Derived Information:
- Image 1 (4H Chart - Andrews Pitchfork Setup): Shows ORLY 4H timeframe with Andrews Pitchfork drawn using points 1 (Sept 12 high ~$108), 2 (Sept 24 low ~$101.50), and 3 (Oct 3 high ~$106). Point 4 (current location ~$103) sits precisely on the pitchfork median line. Multiple trendlines show downtrend channel from point 1 to 4, with horizontal support at $102. White support trendline rising from August lows. - Significance: This pitchfork predicted point 4's exact location, demonstrating high mathematical precision. The confluence of pitchfork median + horizontal support + rising trendline creates a triple-bottom support zone. Price action shows rejection of lower prices at point 4 with bullish candle structure forming. - AGREES ✔
- Image 2 (Volume Footprint Analysis - ATR 14): Detailed order flow visualization showing buy/sell volume distribution with delta calculations. Critical observation: At point 4 area, we see bullish absorption pattern with large green volume bars (buy pressure) dominating. Delta readings show +8.2K buy delta on key bars with 87.76K total volume. Earlier weakness at point 2 showed negative delta of -6.88K but significantly lower volume (65.94K total), proving point 4's buying is more aggressive and larger in size. Recent bars show positive delta accumulation (3.84K, 8.41K) even on down moves. - Significance: This footprint proves institutional accumulation at point 4. When you see positive delta on pullback candles, it means buyers are absorbing all selling pressure - classic pre-reversal behavior. The volume increase from point 2 to point 4 with positive delta shift is textbook smart money positioning. - AGREES ✔
Actionable Machine Summary:
The visual analysis confirms an exceptionally high-probability reversal setup. The Andrews Pitchfork mathematical precision (predicting point 4 within cents) combined with bullish absorption on the footprint creates a powerful entry signal. Both images independently arrive at the same conclusion: this is a legitimate technical reversal zone with institutional support. The risk/reward is clearly defined - support at $101.50 (stop loss), with first target $108 (recent highs) and extended target $110-114 (analyst PT zone). The setup quality is enhanced by the proximity to earnings (potential catalyst) and the clean technical structure across both timeframes and volume analysis. This is a professional-grade setup that institutional traders would recognize and respect. 🎯
Conclusion:
Trade Prediction: SUCCESS ✅
Confidence: High (80%)
Key Reasons for Success:
1. **Mathematical Precision of Setup** - The Andrews Pitchfork predicted point 4 with exceptional accuracy, and the Fibonacci 0.62-0.79 retracement alignment creates a high-probability reversal zone that technical traders worldwide will recognize and respect.
2. **Triple Divergence Power** - Having RSI, MFI, and CVD all diverging bullishly simultaneously is rare and powerful. This isn't a single indicator signal - it's a consensus across three independent measures of momentum, money flow, and volume, all screaming "reversal imminent."
3. **Institutional Footprint Confirmation** - The volume footprint analysis shows unambiguous bullish absorption at point 4. Smart money is accumulating while retail sees weakness - this is exactly what you want to see before a reversal. The positive delta on down moves is textbook institutional positioning.
4. **Overwhelming Analyst Support** - 20 "Strong Buy" ratings with average PT of $110 (6% upside) and high PT of $125 (19% upside) provides fundamental validation. When 71% of analysts covering a stock rate it "Strong Buy," that's not noise - that's conviction.
5. **Earnings Catalyst in 15 Days** - Q3 earnings on October 22 provides a clear catalyst for the reversal. Company has 33-year streak of sales growth and beat estimates last quarter, jumping 3% same day. Probability strongly favors another beat, which would validate the bullish technical setup.
6. **Clean Technical Structure** - Support at $101.50 (proven buyer zone), resistance at $108-110 (clear targets), established uptrend over 50-200 bars, and harmonic patterns (double bottom, ascending triangle) all align. This isn't a messy chart - it's a textbook setup.
Key Risks to Monitor:
1. **Earnings Volatility** - October 22 earnings could go either way. If company misses estimates or provides weak guidance, the technical setup won't matter - stock could gap down through support quickly.
2. **Valuation Concerns** - P/E of 36.7x vs industry 17.3x means stock is priced for perfection. Any disappointment could trigger aggressive selling from valuation-conscious investors.
3. **Mixed Near-Term Technicals** - Some technical sources show sell signals from moving averages and MACD. While I believe the divergences override these, it indicates not all technical indicators are aligned.
4. **Margin Pressure** - Company facing expected margin decline from 19.5% to 19.2-19.7% in 2025 due to wage inflation and tech investments. This is priced in but could become a negative narrative if highlighted on earnings call.
5. **Stop Loss Breach Risk** - If price breaks below $101.50 (point 2), the entire thesis is invalidated. This would suggest buyers at point 2 were NOT stronger than sellers from point 1, breaking the core narrative.
Risk/Reward Assessment:
**FAVORABLE** - Entry at $103, stop loss at $101 (2% risk), first target $108 (5% gain = 2.5R), extended target $110 (7% gain = 3.5R). With 15 days to earnings catalyst and strong technical/fundamental alignment, the risk/reward ratio of 2.5-3.5:1 is attractive. ⭐⭐⭐⭐⭐
Final Recommendation:
**TAKE THE TRADE** - This setup combines multiple high-probability technical confluences (Andrews Pitchfork precision, triple divergence, bullish absorption) with strong fundamental support (analyst consensus, earnings track record) to create an exceptional risk/reward opportunity. The upcoming earnings is both your catalyst and your risk, but with 33 years of consistent growth and last quarter's beat, probabilities favor success.
Position sizing should account for earnings volatility - consider taking partial profits at $106-107 before earnings if you want to derisk, while letting a runner position capture the full move to $110-114 if earnings deliver. Stop loss at $101 is non-negotiable - if that breaks, this thesis is wrong and you move on.
This is the kind of setup professional traders wait for: mathematical precision, institutional confirmation, fundamental support, and a clear catalyst on the horizon. Execute with confidence but respect your risk management. 💪🎯
---
ORLY. Huge profit target at these levels. Short Potential. I don't short much because it doesn't fit my strategy as well. But I would really look for shorts in this box if it sets up. Huge major fib levels we are testing for the first time. Looks dumpy.
I always get messages from mods to explain my trades. I often cant. It comes from almost 10 years of looking at charts. I know trend, levels and my proprietary fib pulls. My record shows for itself. I don't believe anyone should ever copy trade me. All my trades are long term holds and heat is expected in the near term.

7/23/25 - $orly - priced for perfection7/23/25 :: VROCKSTAR :: NASDAQ:ORLY
priced for perfection
- hard to not consider this as a hedge to my NYSE:DECK long (into tmr print)
- stock has had series of weak Q's
- google trends remains meh
- stock not cheap at <3% fcf yield (staples closer to 3.5%+)
- IV on the chain seems lazy... not pricing in much move
- i'd sense that the upside is quite limited and the downside is probably 2-3x the upside
- so while it's not a 9/10 idea (like the push i made on say BOATS:FI after the open this morning - which worked very well and now back to a comfy spot w ITM leaps)... it's a nice filler position on the hedge side, i think
- and honestly it's also a situation where we flip the river card and the stock rips on mediocre restuls... and that tired stock chart just wants to flip bearish, even if it's just a temporary pause before heading higher
- i look at this and i know the personalities that own it
- i'll take under, fam
V

And the push to 1400 is on, again!After the fair value gap progressed in three stages, it halted at the first one from the high, retracing, and then continued, giving bulls optimism and the rule of thumb: this isn't over yet!
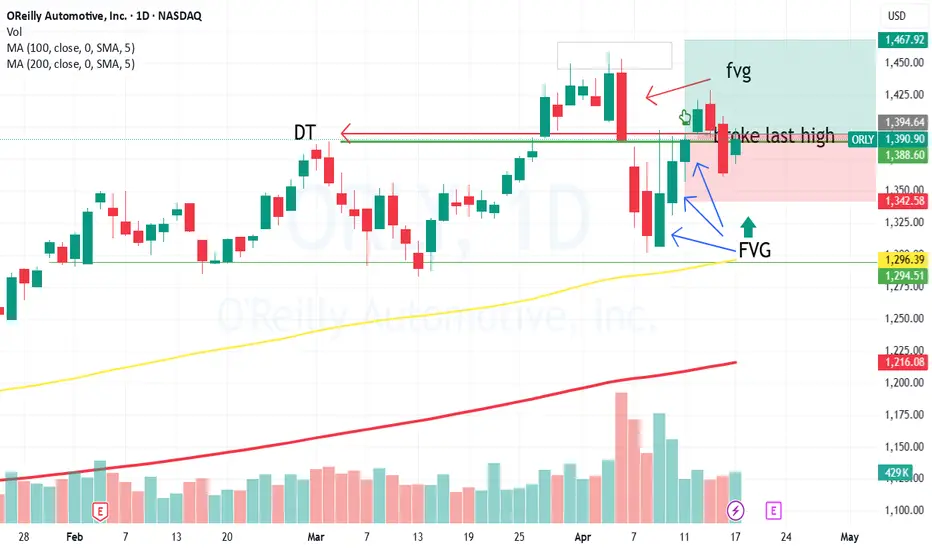
Looks certain to test previous high at 1450 areaAfter a turbulent week, as things start to normalize a bit, the oversold areas are continuing to step up further. The one thing that stands out is the last candle beating the previous high, as pointed out on the arrow, but also testing resistance. This shouldn't be a great area of concern for bulls until it breaks through and retests the 52-week high.

1300 is prime to keep the momo goingStrength has been the lucky star of the ticker, but with the presence surrounding the world of decision-making finances, this might be the bit before the next lucky star.

$ORLY with a bullish outlook following its earnings #StocksThe PEAD projected a bullish outlook for NASDAQ:ORLY after a negative over reaction following its earnings release placing the stock in drift C with an expected accuracy of 77.78%.

OReilly Long!I've entered a long position in $ORLY. Since this US stock reached its high in late July of this year, it has been continuously in a sideways correction, which is very bullish. In the last few trading days, it broke out of this channel to the upside and re-tested it on the last trading day.
The price is currently supported by the 38.2% Fibonacci level, the upper boundary of the broken channel, and the moving averages are catching up.
Let's see if this setup plays out as expected.

O'REALLY (ORLY)NASDAQ:ORLY is the latest stock I bought; a week later, it took off.
That is the power of buying stocks with the best technical analysis strategy for me.
It's up over 8%

O'Reilly Automotive Hit All-Time High In March, Nosedived AprilOn March 21, O'Reilly Automotive ( NASDAQ:ORLY ) stock hit an all-time high at 1169.11. However, in April, the stock nosedived and is currently trading at $1074.27 on Friday's session, down by 0.81%.
Despite the confusion in the auto market, O'Reilly Automotive ( NASDAQ:ORLY ), a leading retailer of auto parts and services, may see sales and profit gains, as auto shoppers may opt to wait and see which way the market wind blows.
O'Reilly Automotive ( NASDAQ:ORLY ) stock has a Relative Strength (RS) Rating of 83, which jumped into the 80-plus percentile with an improvement on Monday. But then the stock Plummeted on Friday's trading session now trading in the oversold territory, with a Relative Strength Index (RSI) of 38.49.

ORLYO’Reilly Automotive, Inc. is an American auto parts retailer that provides automotive aftermarket parts, tools, supplies, equipment, and accessories to professional service providers and do-it-yourself customers.
Potential buy/long on developing bull flag.

RectangleRectangles are a horizontal consolidation pattern and is neutral pattern until broken.
Price is on the support line today.
Recent fall from a bearish Rising Wedge. Both lines slope up narrowing at the apex and represents too much supply within the wedge. This pattern is not valid unless the bottom line is broken. An area of support will usually catch price after a fall from a wedge.
Recent RSI Divergence. Price movement does not match RSI. Bearish divergences are measured on the RSI peaks. A Bullish Divergence is often measured on the valleys.
No recommendation

ORLY Entry, Volume, Target, StopEntry: with price above 964.58
Volume: with volume greater than 343k
Target: 1042 area
Stop: Depending on your risk tolerance; 938.80 gets you 3/1 Reward to Risk Ratio.
This swing trade idea is not trade advice and is strictly based on my ideas and technical analysis. No due diligence or fundamental analysis was performed while evaluating this trade idea. Do not take this trade based on my idea, do not follow anyone blindly, do your own analysis and due diligence. I am not a professional trader.

Be careful with the auto marketWhen was the last time you needed to go to advanced auto parts, auto zone, o Reily ?
Probably only to get a battery.
New cars and most important EVs require minimal maintenance.
NYSE:AAP is good example.

ORLY: some upside potential?A price action above 922 supports a bullish trend direction.
Bullish confirmation for a break above 956.
The target price is set at 984.00 (upper range of the linear regression channel pattern).
The stop-loss is set at 911.
Upside price momentum supports the bullish trend direction.

ORLY Long on Consolidation Break-Out🐂 Trade Idea: Long
🔥 Account Risk: 1.00%
📈 Recommended Product: Knockout
🔍 Entry: +/- 922.00
🐿 DCA: No
😫 Stop-Loss: 877.99 (898.75 for aggressive trade)
🎯 Take-Profit #1: 977.59 (50%)
🎯 Take Profit #2: -
🎯 Trail Rest: Yes
🚨🚨🚨 Important: Don’t forget to always wait for strong confirmation once possible entry zone is reached. Trade ideas don’t work all the time no matter how good they look. Do not get a victim of FOMO, there is always another trade idea waiting. 🚨🚨🚨
If you like what you see don’t forget to leave a comment 💬 or smash that like ❤️ button!
—
ORLY is in an overall uptrend and broke the consolidation trendline with a strong candle going into a bullish consolidation inside a small range. Entry should only be made if the daily candle remains outside the consolidation range (green box) today. If it falls back wait for another break-out and daily close.
—
Disclaimer & Disclosures pursuant to §34b WpHG
The trades shown here related to stocks, cryptos, commodities, ETFs and funds are always subject to risks. All texts as well as the notes and information do not constitute investment advice or recommendations. They have been taken from publicly available sources to the best of our knowledge and belief. All information provided (all thoughts, forecasts, comments, hints, advice, stop loss, take profit, etc.) are for educational and private entertainment purposes only.
Nevertheless, no liability can be assumed for the correctness in each individual case. Should visitors to this site adopt the content provided as their own or follow any advice given, they act on their own responsibility.

ORLY Head and Shoulders SetupBreak below Neckline ($800), this could see a $50 move to the downside. The bearish divergence on the MACD , RSI , and OBV.

ORLYNot a stock that I trade, but one of my followers mentioned it a couple of weeks ago.
Repeating the same pattern as the box area, I think it rallies next week.

ORLY SELL++++ WAY OVERBOUGHT!All technical indicators overbought here on various time frames, options market is thin so, I elected to buy Dec 16 $830 puts. We should retrace to $775 or below in coming days with new moon print.

O'REILLY AUTOMOTIVE, INC bullish, broke the resistance levelComment:
O'REILLY AUTOMOTIVE, INC broke the resistance 753.90 level from August 2022 as well as resistance from of April 2022.
Ichimoku Trend Analysis ( AFOBAY STRATEGY):
- Kumo (Senko span A and B) up
- Kijun sen up
- Tenkan sen up
- Chiko span above candles
Next Scenario:
803.72 level is also a monthly pivot point.

ORLY - bull flag setupWhen the next rally comes, this setup has potential. Set the trap and sight tight.
IQ has always and will always, get all the praise; but discipline gets the job done ~Mark Ritchie
Lose like a pro and keep trading, or lose like a novice and quit ~Mark Ritchie

Sell $ORLY @ $ 724Sell $ORLY @ $ 724
TGT $ 611
TGT $ 697
TGT $665, $ 650
SL $750
Always keep strict SL
