PLTR CAUTION!PLTR is at a key critical area, which has already given a warning shot to bulls.
We have a complete rising wedge structure with 3 waves up and a hook that has already cracked! Within it, we also have a head and shoulders at the top, which is bearish. (H&S not a top is usually a continuation pattern.) AS is always the case, if the overall market is not ready to head south, it will fail as a full-on reversal pattern.
I urge CAUTION!! to PLTR bulls.
For shorts, you need to see a crack, gap fill, plus follow through for a new lower low in a small time frame. You can't have a reversal without lower lows and lower highs.
Thank you ALL FOR getting me up to 5,000 followers!! ))
Click boost, follow, comment nicely for more authentic, no BS, raw analysis. Let's get to 6,000 followers. ))
Trade ideas

Palantir - A devastating -40% drop!🤬Palantir ( NASDAQ:PLTR ) will create a major correction:
🔎Analysis summary:
After a textbook bullish break and retest in mid 2024, we witnessed a parabolic rally on Palantir. During the entire rally, we only witnessed one red candle, which clearly shows some significant overextension. Therefore, Palantir will create a major correction now.
📝Levels to watch:
$200 and $100
Phil - @SwingTraderPhilTV
SwingTrading.Simplified. | Investing.Simplified. | #LONGTERMVISION

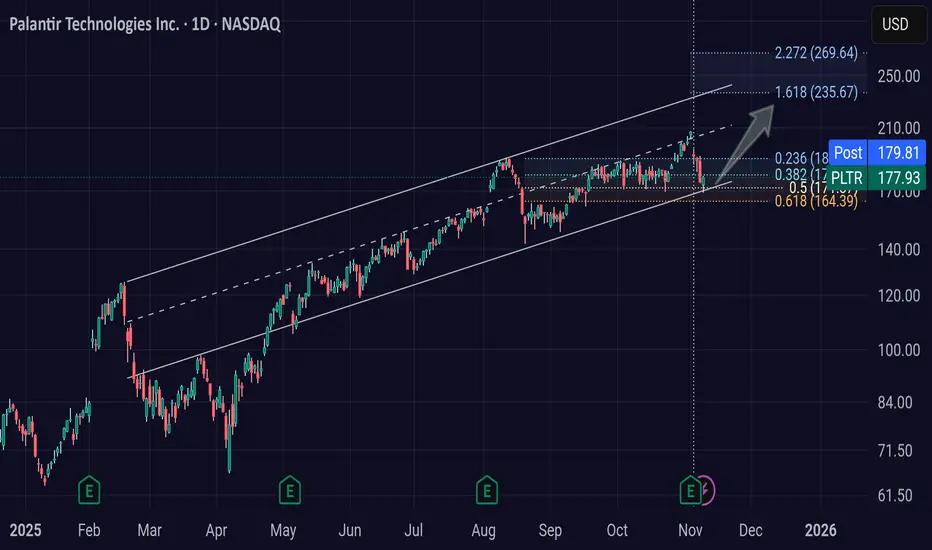
PLTR: staying on track for the time beingBullish channel in tact. Successful rebound on the .5 fib.
I can see a 40%+ move from here in the short-term, and following the trend.
Will it hold? Idk.
I'm a long term holder (10-20 yrs), and don't make any trade advice.
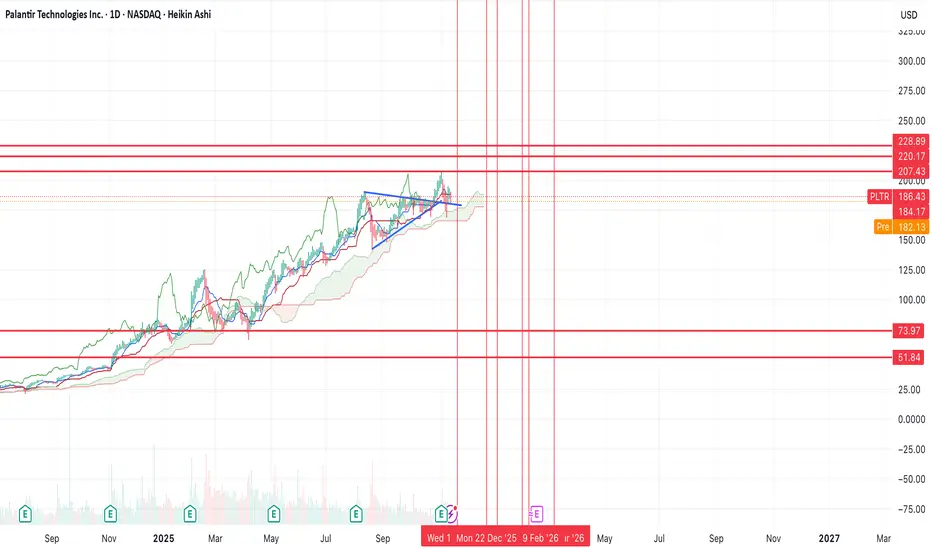
PLTR one more push up before a 70% correction?NASDAQ:PLTR looks like it's on it's last legs here.
If it can push off of this trend line here, then I think we can see one last move higher either into prior resistance, or there's a chance we can break it and form brief new highs. However, after that, I think we'll see a 70% correction back to the lower supports.
We'll either bottom at $74 or $52.
My best guess as to timing is that we bottom before March 2026.
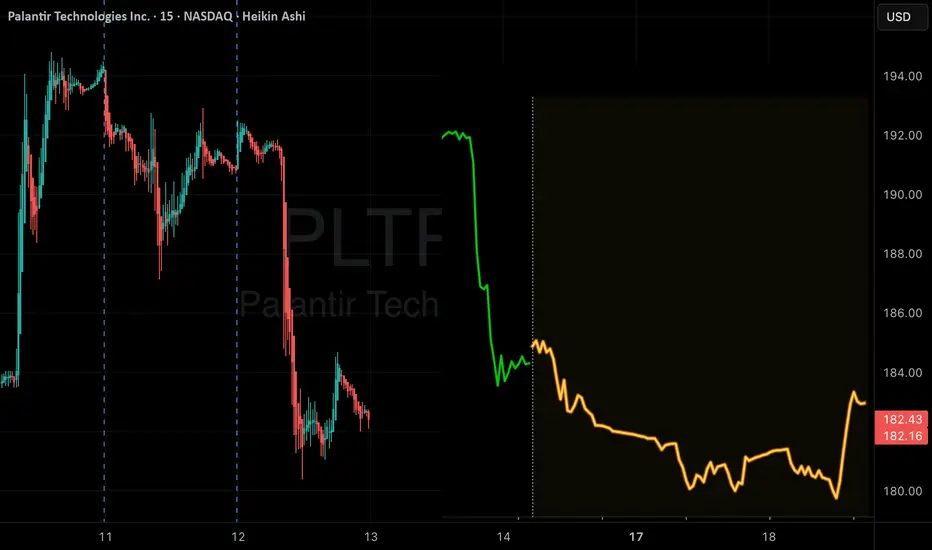
PLTR long daily gap playI already entered too early.
Maybe new entry at the daily gap. would cut the trade when we close below the gap.

PALANTIR GOES READY TO 'WHAKA-WHAKA-WHAKA' ALL-MICHAELS-BURRIESPalantir Technologies has recently announced its Q3 2025 Earnings results.
“114% - our Rule of 40 score!*
These results make undeniable the transformational impact of using AIP to compound AI leverage.
Year-over-year growth in our U.S. business surged to 77%, and year-over-year growth in U.S. commercial climbed to 121%.
We are yet again announcing the highest sequential quarterly revenue growth guide in our company’s history, representing 61% year-over-year growth,” said Alex C. Karp, Co-Founder and Chief Executive Officer of Palantir Technologies.
*Revenue: $1.18 billion vs analyst estimates of $1.09 billion (62.8% year-on-year growth, 8% beat).
Adjusted Operating Income: $600.5 million vs analyst estimates of $501.9 million (50.8% margin, 19.7% beat).
Rule of 40 score total amount : 113.60 points.
Then later, Palantir erased nearly $42b from its market cap a day after Burry-the-Bear' announcement his betting against it.
Despite of all this crap, we still keep focus on further upside development in Palantir's stock, as it explained on the main technical graph.
--
Best 'whaka-whaka-whaka' wishes,
@PandorraResearch Team

PLTR to $150: Overvaluation, AI Hype, Slowing Government Growth If you haven`t bought PLTR at $16:
Palantir has become one of the most crowded trades of the AI boom. While the company is strong fundamentally, the stock price has detached from reality. A move toward $150 (post-split) is not only reasonable — it is structurally likely.
1. Extreme Valuation — PLTR Trades Like a Hyper-Growth AI Leader, But Growth Is Slowing
Palantir’s current valuation assumes:
accelerating revenue growth
massive enterprise AI adoption
long-term dominance in the AI/defense space
But real numbers tell a different story:
government revenue growth has slowed
commercial AI revenue is not scaling as fast as expected
current valuation implies “perfection”
PLTR is priced like Nvidia, but grows closer to a legacy enterprise software company.
That gap must eventually close.
2. Government Contracts Are Growing Much Slower Than Expected
Historically, the Gov segment was Palantir’s growth engine. Now:
U.S. federal agencies face budget constraints
large DoD and DHS contracts are delayed or split among competitors
players like Anduril, C3.ai, and smaller defense tech shops are taking share
geopolitical spending doesn’t translate directly into PLTR revenue
Slowing government growth is a major red flag, because it removes the company’s most stable source of revenue.
3. AI Hype in the Commercial Segment Is Not Converting Into Real Revenue (Yet)
Most of the excitement around PLTR in 2024–2025 comes from:
AIP (Artificial Intelligence Platform)
enterprise copilots
generative AI tools
predictive modeling engines
But the commercial AI pipeline suffers from:
too many POCs (proof-of-concepts)
long implementation timelines (6–24 months)
high customer acquisition costs
conservative corporate spending
The hype is real.
The revenue, not so much.
4. Heavy Insider Selling — A Consistent Bearish Signal
Top insiders have repeatedly sold shares into every major rally:
Alex Karp (CEO)
Shyam Sankar (COO)
multiple VPs and directors
Notice what’s missing:
large insider buying.
Insiders consistently cash out when retail enthusiasm peaks, which historically precedes corrections.
Macro Risk: If AI Capex Slows, PLTR Gets Hit Harder Than NVDA
PLTR is far more sensitive to an AI spending slowdown than hardware leaders like Nvidia, which still enjoy massive chip demand.

PLTR Watching a Major Retest This Week (Nov 10–14)PLTR just pulled back from the top of its multi-month rising channel, and this week is all about whether it can stabilize or whether the sellers are finally stepping in for a deeper reset. Here’s the full multi-timeframe read based on structure, SMC, trendlines, and GEX.
1. Weekly Timeframe (1W)
Macro Structure
PLTR has been one of the cleanest trending names this year. The weekly structure shows a steady series of BOS formations, each creating higher highs and higher lows. Price just tagged the upper boundary of the rising macro channel and rejected sharply — this is the first meaningful red weekly candle in weeks.
Despite the pullback, PLTR is still trading well above its long-term trendline. Weekly demand sits between 150–160, and a deeper demand pocket sits around 129–140, but price hasn’t touched either yet.
Weekly MACD is curling down for the first time since the summer. Stoch RSI is rolling over from overbought. This doesn’t break the trend, but it does confirm momentum cooling at the top of the channel.
Weekly Trade View
As long as PLTR stays above 150–160, the broader trend remains bullish. The pullback could be a reset before another leg up, but momentum needs to cool off more. If the weekly closes below 160 later this month, that’s when the weekly trend comes into question.
Weekly GEX View
There’s heavy positive GEX above 190–200, meaning upside from here can get slower and grindy. Below 175, negative GEX expands quickly and opens the door for sharper moves down. PLTR is currently sitting right at the edge of that zone.
2. Daily Timeframe (1D)\
Daily Trend and Structure
The daily chart gave us a downside CHoCH after failing to hold the breakout above 200. The move down wasn’t just a rejection — PLTR also broke back into the prior range. That confirms short-term weakness.
The 169–176 zone is the major daily support cluster. That’s where PLTR is sitting right now. If buyers don’t show up here, the next zone is 158–160.
Daily MACD is red and widening. Stoch RSI is in oversold territory and still pointing lower. There’s no confirmed reversal yet.
Daily Trade View
Hold 169–176 → PLTR can bounce back toward 185 then 190.
Break 169 → opens 158–160, then 142.
Daily GEX View
Put support sits at 170–172.
Below that, a larger put wall sits at 158.
Call walls near 190 and 200 will act as ceilings unless PLTR regains momentum.
3. 1-Hour Timeframe (1H)
Short-Term Structure
PLTR has been trending inside a clean descending channel. Multiple BOS signals confirmed seller control. But the latest CHoCH printed right near 175, which is the first sign of short-term buyers stepping in.
Price is now testing the 180–181 zone — that’s the short-term pivot.
1H MACD is curling upward with a strong shift in momentum. Stoch RSI is climbing into the mid-range, showing buyers stepping in for the first time since Nov 5.
1H Trade View
Reject 180–181 → continuation lower into 175 then 169.
Break above 181 → opens room into 186, then potentially 191.
This is the level to watch Monday morning.
4. 15-Minute Timeframe (15M)
Intraday View
The 15M structure flipped first:
PLTR broke the intraday downtrend with a clean BOS and a follow-up CHoCH. The best part is that price is now consolidating above the broken trendline, showing control shifting to buyers on small timeframes.
But the 180–181 line is still the intraday ceiling across all lower timeframes.
MACD on 15M is trending up smoothly. Stoch RSI is elevated but still supportive.
15M Trade View
Above 180–181 → scalp long into 185, then 187–190.
Reject 180–181 → scalp short into 176, then 172.
The structure is clean, and Monday morning’s reaction will decide whether PLTR extends the intraday recovery or rolls back over.
5. GEX Map & Options Strategy
GEX Interpretation for PLTR (This Week)
Positive GEX at 190–200
Negative GEX at 172–175
Major put wall at 170
Strong call wall around 190–192
Highest call resistance around 200
What that means:
Upside slows sharply near 190–200
Downside picks up under 175
170 is a key support magnet this week
If 170 breaks, volatility will expand quickly to the downside
Options Strategy
If PLTR fails at 180–181:
Short-dated puts toward 175 or 170 are clean.
If PLTR breaks above 181 and holds:
Short-dated calls toward 185 or 190 make sense.
Avoid chasing calls above 200 — that sits inside heavy positive GEX and tends to stall.
My Thought
PLTR is coming off a major rejection at the top of its macro channel. The larger trend is still bullish, but the daily and intraday signals clearly show short-term weakness. Everything this week depends on how PLTR behaves around the 180–181 zone.
Rejecting that area keeps momentum toward 175 and 169.
Breaking above it shifts structure bullish again with room to recover toward 185 and 190.
This is a level-driven week. Let the reaction at 180–181 lead the trade.
Disclaimer
This analysis is for educational purposes only and not financial advice. Always manage your risk. If you want any other ticker covered with the same structure, just let me know.

PALANTIR HIGH PROBABILITY SETUPS SOON!!!🚨 PLTR HIGH PROBABILITY BUY/SELL SETUPS 🚨
* Here We Can See Clearly The Next Potential Moves For PALANTIR Coming Hours/Days.
* Keep Your Eyes Close On Your Trading Positions.
* Happy PIP Hunting Traders.
FXKILLA.

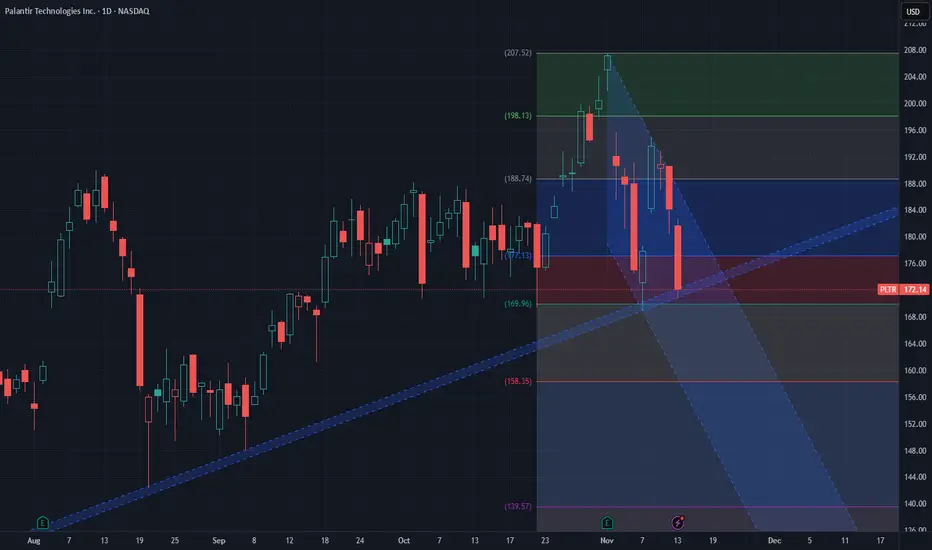
Short PalantirTrading Fam,
This will be only the second short I have taken since implementing my new indicator. We are up 250%+ pending exits in just over a year; however, during that time, I have taken long entries only. Now, it's time to test accuracy on the short side.
On my NASDAQ:TSLA short (my first ever short entry), we are already comfortably in profits. More to come on that.
As far as NASDAQ:PLTR goes, my signal gave me a SELL at $195. As I have been in the habit of waiting for confirmation, I did not enter immediately. Yesterday and today, I believe I have been given the chance for a decent entry. I've entered short at a price of $190 and will shoot for that 200-day SMA at somewhere around $145 for a 2.37 rrr.
Let's see how this goes.
✌️Stew

Act Fast: PLTR Weekly Puts Signal Rapid Profit Potential!PLTR Weekly Options Signal 2025-11-12
Current Price: $183.04
Trend: Neutral (slight bearish bias)
Weekly Momentum: Bearish (-4.76% 1W)
Confidence: 65% | Conviction: Balanced
Expiry: 2025-11-14 (2 days)
Recommended Strike: $177.50
Trade Signal:
Direction: Buy Puts
Entry Range: $1.48–$1.53
Target 1: $3.00 (+100%)
Target 2: $4.50 (+200%)
Stop Loss: $0.75 (-50%)
Position Size: 2.5% of portfolio
Options Flow:
Bearish, PCR 1.33 → heavy put buying
Unusual activity at $250 put suggests institutional hedging
High gamma risk favors short-term directional trades
Insight:
Katy AI predicts a modest downward trajectory (-3.01% over 3 days)
Strong bearish momentum and bearish options flow suggest potential downside
Moderate risk → precise timing and small position size recommended
⚠️ Risk Warning:
Short timeframe with high gamma risk → trade carefully
Educational commentary for QS Premium members only; not financial advice
Michael Burry is right about Palantir$PLTR. I have said it before, Michael Burry is right about Palantir.
Expect something like this:

PLTR at Decision Point: Price, Liquidity and Powerful GEX ShiftPLTR has been trading like a stock waiting for permission to move. Every time it dips, the structure holds. Every time it pushes, momentum fades. It’s the classic pre-breakout compression you see when GEX pressure is reshaping the entire chart behind the scenes.
If you look closely, PLTR isn’t reacting to random levels — it’s reacting to gamma shelves, neutral pockets, and hedging clusters.
And price is sitting right inside a pocket where the next move tends to be sharp, not slow.
4H — The Structural Story
On the 4H chart, PLTR keeps retesting the same liquidity band near 182–184 — the same region where prior BOS and CHoCH levels formed. This zone is acting like a quiet anchor.
It’s not just technical support.
It’s also where GEX flips from neutral to mildly positive, which naturally slows down selling pressure.
Every bounce from this zone feels controlled, not emotional.
That’s usually a sign of accumulation — or at least defense — by larger players.
1H — Short-Term Calm, Big Potential Energy
On the 1H chart, PLTR is pressing against a thin demand layer. The candles look indifferent, the volume is mild, and sellers don’t have the same force they had earlier in the week.
Why?
Because PLTR is sitting right inside a neutral GEX pocket.
Neutral pockets do one thing extremely well:
They store energy and then release it in one clean direction.
When price leaves a neutral pocket, it usually accelerates — either into the positive GEX shelf above or the negative zone below.
That’s the entire battleground.
GEX Data — The Heart of PLTR’s Setup
(Refer to screenshot below)
This GEX landscape is crystal clear:
🔹 A major positive GEX cluster sits at 190–195
This is the “gravity zone” above current price.
When PLTR enters this zone, hedging flows stabilize the move — often creating controlled bullish structure.
🔹 Neutral GEX pocket between 182–188
This is where PLTR is trapped now.
Price doesn’t accelerate much here, which is why it feels like the stock is “stuck.”
🔹 Negative GEX zone below 182
This is where things get dangerous fast.
If PLTR breaks here, dealer hedging flips and selling accelerates.
This is why I rely heavily on GEX:
It maps out the path of least resistance in a way pure price action cannot.
🔥 Trading Suggestions Based on Structure + GEX
📌 Bullish Setup (Higher Probability)
Price must hold 182–184 and show even a small reclaim of 186–187.
Entry:
185–187 on confirmation (strong 1H candle or liquidity sweep + reject)
Target 1: 190.00 (first positive GEX shelf)
Target 2: 192.50 (clustered gamma resistance)
Target 3: 195.00 (major GEX wall)
Stop-Loss:
Below 181.50 (the moment price enters the negative GEX zone)
This play works because the moment PLTR pushes above the neutral pocket, GEX flow shifts toward the magnet at 190–195.
📌 Bearish Setup (Only if 182 breaks)
This is a fast-move scenario.
Entry:
Break and hold below 181.80
Target 1: 178
Target 2: 175
Target 3: 169 (deep negative GEX liquidity)
Stop-Loss:
Above 184
If price enters negative GEX territory, dealer hedging accelerates the decline, which is why downside can be clean.
🔥 Options Trading Suggestions Based on GEX
📌 Bullish Options Play (Higher Probability)
IF PLTR stays above 182–184 and begins pushing toward 188–190:
Buy:
PLTR 190C or 195C 1–2 weeks out
(These lie directly in the positive GEX shelf)
Reason:
Positive GEX shelves slow volatility and create controlled upside — perfect for directional call plays.
More Conservative Play:
Debit Call Spread: 185/195
(Great R/R inside a rising GEX environment.)
📌 Bearish Options Play (Only if 182 Breaks)
IF PLTR breaks and holds under 182:
Buy:
PLTR 175P or 170P
Reason:
Once PLTR enters the negative GEX zone, dealers must short into the move → downside accelerates, and puts expand in value quickly.
Safer Bearish Play:
Put Debit Spread: 182/175
📌 Neutral/Compression Play
IF PLTR stays inside 182–188 neutral pocket:
Sell Premium Strategy:
Iron Condor or Short Strangles (experienced traders only)
Reason:
Neutral pockets = low volatility = premium decay accelerates.
This is the zone where nothing meaningful happens until a breakout.
My Thought
PLTR is in a rare moment where technical structure and GEX are telling the exact same story:
* Price is compressing
* Liquidity is tightening
* GEX shelves are defining the entire battlefield
* And the breakout direction will be very clean once price exits this pocket
If PLTR holds 182–184 → the path toward 190–195 opens fast.
Lose 182 → price slides into negative gamma and accelerates lower.
Either way, GEX already shows the zones where the real move will unlock.
This outlook is for educational purposes only and not financial advice. Always manage your risk and trade your plan.
Palantir PLTR Potential 25% momentum?Can Palantir PLTR continue to rocket to the moon? Price has been respecting the moving averages. Palantir has been strong for several months. Is it over or will it continue to crush shorts?

Game Theory & Prices/Options?I posted this before a long time, how crowd in markets always think of the same price.
Here I dont know how this works (but from market behaviors i can assume...), how options influence market? ie NASDAQ:PLTR breaking above the 100$, with enough strength... it has to clear the 150$ and next target is 200$. Because market makers are forced to buy the stock, when unlikely before this period anyone would buy 200$ options. Just a theory.

PLTR - Bars Pattern PredictionsUsing the bars pattern tool on this daily chart for PLTR to see if there will be a retest of a lower trend line before continuation upward
The lowest trend line probably will not be hit but i leave it there
See if future price action looks anything at ALL like this
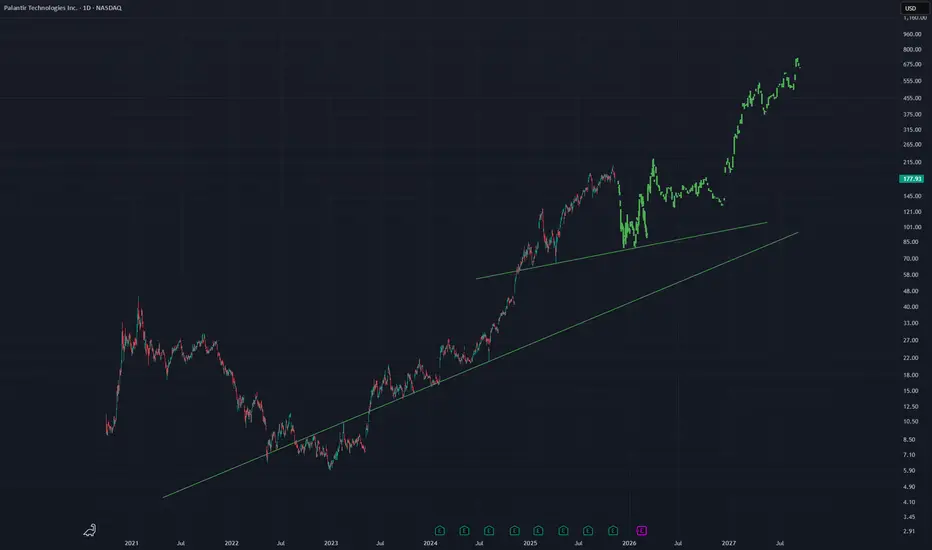
PLTR - wave [4]PLTR completed the wave at $207.52.
The current decline is probably a wave .
In terms of duration, this wave may be proportional to wave , that is ~ 2 years.
So I expect the end of the wave in October 2027.

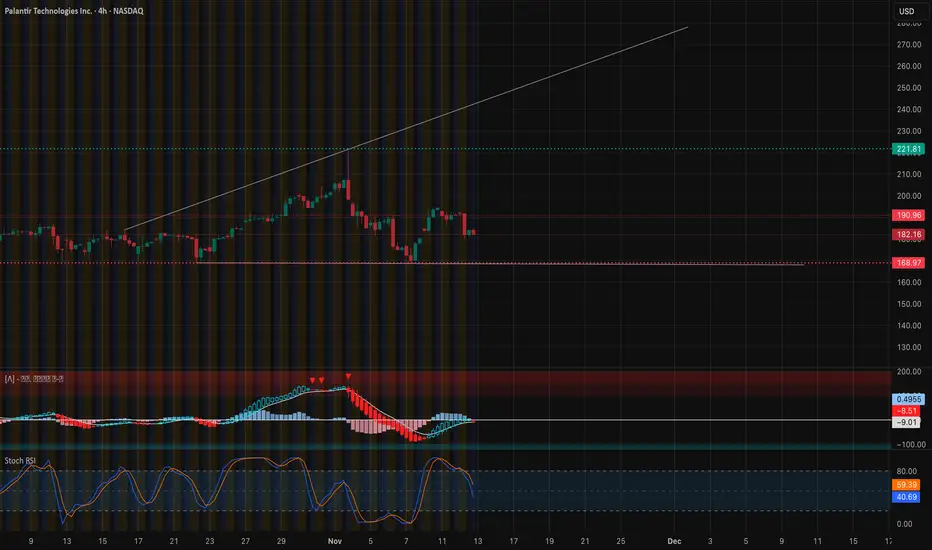
A Risk of Deeper Pullback in PLTRThe trend on daily/time-short frames is weak, momentum is bearish, the chart shows a likely distribution phase entering mark-down.
Its Longer term trend is still positive but fading.
I’d lean bearish to neutral in the near‐term with a risk of deeper pullback .
PLTR Weekly Bounce Alert — Don’t Miss This AI SignalPLTR QuantSignals V3 Weekly 2025-11-14
Ticker: PLTR
Current Price: $165.24
Trend: Mixed / Oversold
Confidence: 60%
Expiry: 2025-11-21 (7D)
Strike: $165.00
📈 AI & Technical Forecast
Katy AI Target: $187.16 (+13.3% upside)
Detailed Time-Series: Uptrend toward $190+ by mid-week
RSI: 9.9 → deeply oversold, strong mean-reversion potential
Weekly Range Position: 2.8% → near capitulation
EMA / MACD: Bearish alignment → but sets up rebound opportunity
Insights:
Contrarian setup: heavy institutional put accumulation (PCR 3.12) signals potential upside squeeze
Mixed news: CEO bullish commentary vs. defensive sentiment from hedge fund activity
Low volume (0.1× average) → price may move sharply on small flows
🎯 Trade Setup
Parameter Value
Direction CALL
Strike $165.00
Entry $10.96
Target 1 $16.40 (+49.6%)
Stop Loss $7.65 (–30.3%)
Expiry 2025-11-21
Position Size Moderate (consider 2–3% portfolio)
⚡ Key Advantages
Oversold RSI + AI bullish trajectory → potential rebound squeeze
Contrarian against institutional put-heavy positioning
Deep ITM strike limits extrinsic decay and provides high delta exposure
Timing Edge:
Friday expiration allows discount on premium ahead of expected mid-week momentum
Potential upside acceleration if put-heavy positions unwind
🚨 Risk Notes
Expiration week → elevated gamma and theta risk
Low liquidity and volume → choppy price action possible
Stop loss should be strictly followed due to high-risk setup
Conflicting market signals → manage position size carefully
Summary
PLTR weekly call offers medium-conviction, contrarian upside potential, combining AI bullish trajectory, oversold RSI, and institutional positioning for a 7-day horizon.
PLTR --> $85?I'm thinking Mike Burry going to post some kind of Heisenburg type tweet that justifies his PLTR short. Not too long ago was this in the $80s before yet another double of the market cap. Karp videos looking a little sketchy lately after Burry posted the short and Karp defended... I'm thinking Nov 25, 2026+ PLTR will fall hard. Market profile $85 is the next support on a big drop... wild to think... but the chart from $5 is wild in and of itself... makes sense for the smart investors to have taken their 3000% gains and look for greener pastures.

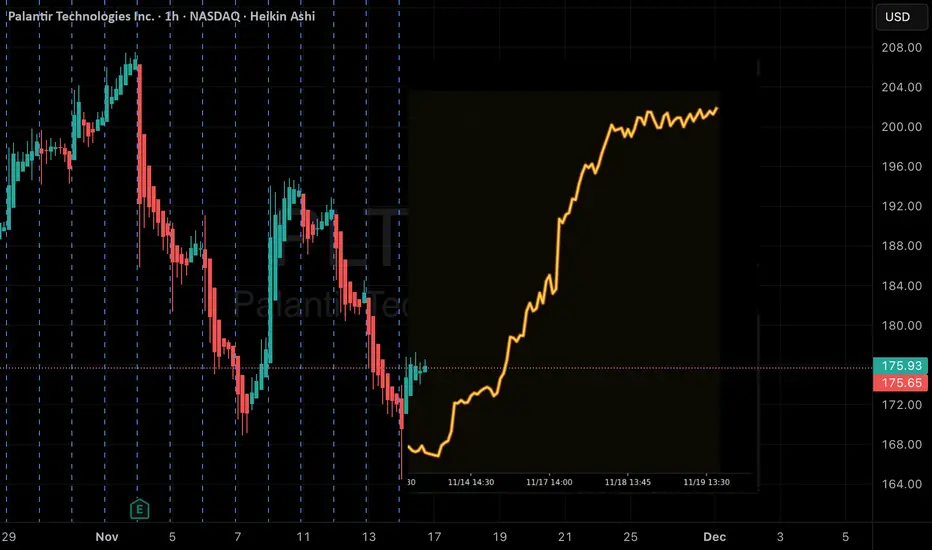
PalantirPrice looks to have finally finished its initial a wave lower. We have yet to get confirming data, however, it maintained pos div (barely) and has moved up with a little bit of strength. Looking at the overnights, price has started out up over 3%. This is all good news for b to have finally begun. If it has indeed kicked off, then we should be headed to the target box above. This is between the 0.618-0.786 per the standard move higher. As you should know by now, the standard move will be a 3-wave pattern/structure. Of course, it is a b wave, and they can become very complex. For all we know this thing could form into a triangle. We just have to be patient and watch what unfolds.
The turquoise count suggesting that cycle I isn't yet complete remains on the chart and will stay there until we can get some confirming data that it is in fact over. I do think that it is over, but I could also be wrong. There also remains the possibility that this initial a wave is yet to complete. These are just things to keep in the back of your mind in case this thing goes against what we think will happen. That way if it does go against expectations, we don't have to quickly figure out what is going on.

Palantir technologies Technical outlook
the stocks will reject 195-193.88 supply roof zone
the current support at 169.54 demand floor is valid and will lead buyers into 195-193.88.however the break and close of this supply roof will be a new wave into 200-230$
break and close 169.54$ will retest 133.75-130 and could come to lower level.
the weekly SMA200 also confirms 169.54 demand floor for a buy
Key Reasons for Palantir’s Stock Drop
High Valuation Concerns: Palantir's stock trades at an extremely high forward price-to-earnings (P/E) ratio of about 220, which many investors view as disconnected from fundamentals. This lofty valuation raises concerns about sustainability and growth expectations.
Short Selling Pressure: Notably, influential hedge fund manager Michael Burry, famous for his bets prior to the 2008 crisis, has taken a significant short position against Palantir. This adds selling pressure and can spook other investors.
Mixed Market Sentiment: Despite beating earnings and revenue expectations with strong growth (Q3 revenue up 63%, raised full-year guidance to over $4.4 billion), the stock dropped post-earnings as investors digested the high valuation and some caution on sequential growth.
Macro and Sector Volatility: Broader tech sector pullbacks and concerns around government spending delays (affecting contract flows) in the current environment weigh on the stock.
CEO Response: Palantir CEO Alex Karp has publicly criticized short sellers and expressed confidence in the company’s strategic direction and partnerships.ala
Palantir Technologies' focuses on advanced data integration, analytics, and AI-powered decision-making platforms for government and commercial clients. The company transforms vast, complex data into actionable insights that enhance operational efficiency, security, and strategic decision-making.
Core Business Model and Platforms:
Palantir Gotham: Initially developed for government intelligence and defense sectors, focusing on counterterrorism, law enforcement analytics, cybersecurity, and risk detection.
Palantir Foundry: A commercial data integration platform enabling enterprises across industries (finance, healthcare, energy, manufacturing) to unify data, build customized applications, and optimize operations.
Palantir Artificial Intelligence Platform (AIP): The latest platform embedding AI and machine learning directly into workflows to enable predictive analytics, automation, and integration of large language models for enhanced enterprise intelligence.
Revenue Model:
Revenue primarily comes from long-term contracts with government agencies and enterprise clients, often customized and high-value deployments.
Palantir invests heavily in R&D, especially in AI, machine learning, and cybersecurity technologies, to sustain its platform leadership.
Clients pay for software licenses, deployment, ongoing support, and customization services.
Fundamental Strengths:
Strong growth with revenues surpassing $4 billion in 2025, driven by expanding commercial adoption.
Strategic partnerships with governments and Fortune 500 companies provide recurring revenue and market credibility.
Demonstrated success in critical use cases such as pandemic vaccine distribution, supply chain resilience, and financial risk management.
Emphasis on data security and privacy compliance builds client trust.
Future Outlook:
Increasing integration of generative AI and autonomous workflows.
Expansion into mid-sized businesses and new verticals.
Focus on sustainability analytics and ethical AI governance.
Summary
Palantir is an enterprise AI and data analytics company providing advanced platforms (Gotham, Foundry, AIP) that help governments and companies harness data efficiently. Its business model relies on high-value, long-term contracts with heavy R&D investment. Palantir aims to be a key enabler of AI-powered enterprise transformation across industries.
#ai #stocks

Palantir Technologies (PLTR) Shares Fall Despite Strong EarningsPalantir Technologies (PLTR) Shares Fall Despite Strong Earnings
Palantir Technologies (PLTR), a company specialising in big data analytics software, released a strong quarterly report this week:
→ Earnings per share: actual = $0.21, expected = $0.17
→ Revenue: actual = $1.181 billion (up 63% year-on-year), forecast = $1.09 billion
Palantir thus reaffirmed its status as a leader in the field of artificial intelligence. Yet, despite the impressive results, PLTR shares fell following the release. Why?
It is likely that much of the optimism had already been priced in during the company’s 150% rally earlier this year. In other words, the drop in PLTR’s share price appears to have been driven purely by market sentiment and overly high expectations, rather than any weakness in the company’s fundamentals.
Technical Analysis of Palantir Technologies (PLTR)
Back in August, when analysing PLTR’s price movements, we:
→ confirmed the relevance of the ascending channel (shown in blue) and highlighted support around the psychological level of $150;
→ suggested that, following a spike in volatility, the price could resume its upward trend.
As the chart’s arrow indicates, this scenario indeed played out – the lower boundary of the channel acted as strong support. Building on that level, the bulls demonstrated conviction, pushing the price through key resistance zones at $160 and $170.
In October, the price broke out of a Bullish Flag (marked by an arrow) and subsequently rose above the psychological barrier of $200.
However, the chart has since taken on a more bearish tone because:
→ the price failed to hold above $200 – creating what looks like a FOMO bull trap;
→ the median line of the channel acted as resistance;
→ following the earnings release, a bearish gap appeared in the $190–200 zone, which may now serve as future resistance.
For the bulls, much depends on whether support at the lower boundary of the channel can hold. Based on the current setup, that task looks more challenging than it was in August.
This article represents the opinion of the Companies operating under the FXOpen brand only. It is not to be construed as an offer, solicitation, or recommendation with respect to products and services provided by the Companies operating under the FXOpen brand, nor is it to be considered financial advice.
