$PLTRPalantir Technologies Inc. (NYSE: PLTR) presents a compelling case for a cautiously bullish outlook following its rebound from November lows. For traders seeking to capitalize on potential stability or upside while managing defined risk, a bull put spread strategy offers a structured approach.
Mark
0.1 USD
410.52 M USD
2.55 B USD
About Palantir Technologies Inc.
Sector
Industry
CEO
Alexander Caedmon Karp
Website
Headquarters
Denver
Founded
2003
ISIN
AR0132889822
Palantir Technologies, Inc. engages in the business of building and deploying software platforms that serve as the central operating systems for its customers. It operates through the Commercial and Government segments. The Commercial segment focuses on customers working in non-government industries. The Government segment is involved in providing services to customers that are the United States government and non-United States government agencies. Its platforms are widely used in areas such as defense, intelligence, healthcare, energy, and financial services, supporting data integration, large-scale analytics, and operational decision-making. The company was founded by Alexander Ceadmon Karp, Peter Andreas Thiel, Stephen Cohen, Joseph Lonsdale, and Nathan Dale Gettings in 2003 and is headquartered in Denver, CO.
Related stocks

Palantir $230 soon...Palantir has had a huge year, running from the low-80s in January to a peak around 207 in early November before a sharp post-earnings flush into the 150s.
The recent selloff looks more like a high-volume reset in a strong primary uptrend than the start of a full top. I’m looking for a reclaim of 20

PLTR — [2D] WEEK 49 TREND REPORT | 12/04/2025PLTR — WEEK 49 TREND REPORT | 12/04/2025
Ticker: NASDAQ:PLTR
Timeframe: 2D
This is a reactive structural classification of PLTR based on the weekly chart as of this timestamp. Price conditions are evaluated as they stand — nothing here is predictive or forward-assumptive.
⸻
1) Curren

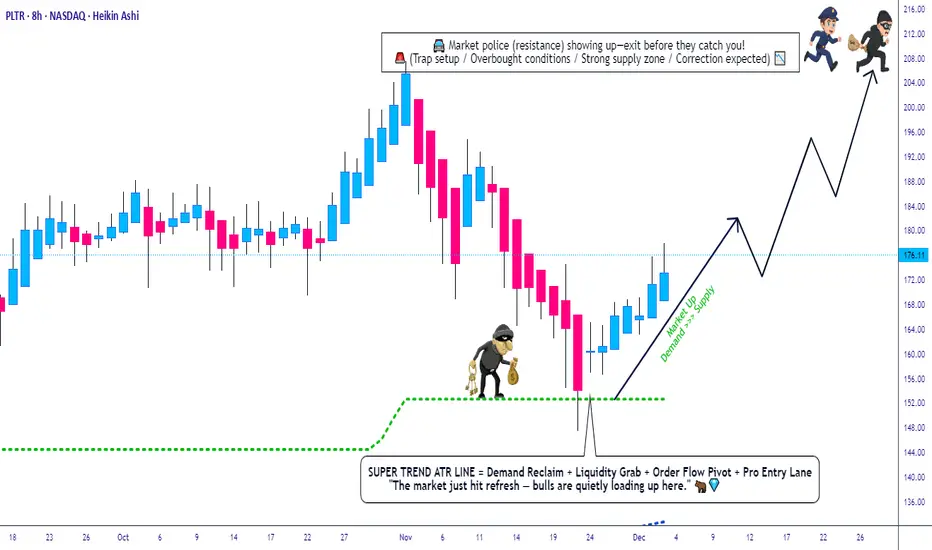
PLTR Swing Map: Heikin Reversal + ATR Push + Trend Confirmation*📈 PLTR — Palantir Technologies Inc. | NASDAQ
Swing Trade Profit Playbook (Bullish Edition) 🔥🕶️**
🔍 Trade Thesis (Polished & TradingView-Safe Version)
PLTR is showing a bullish continuation setup, supported by:
✅ SuperTrend Buy Signal confirming upside momentum
✅ ATR expansion showing strong volat
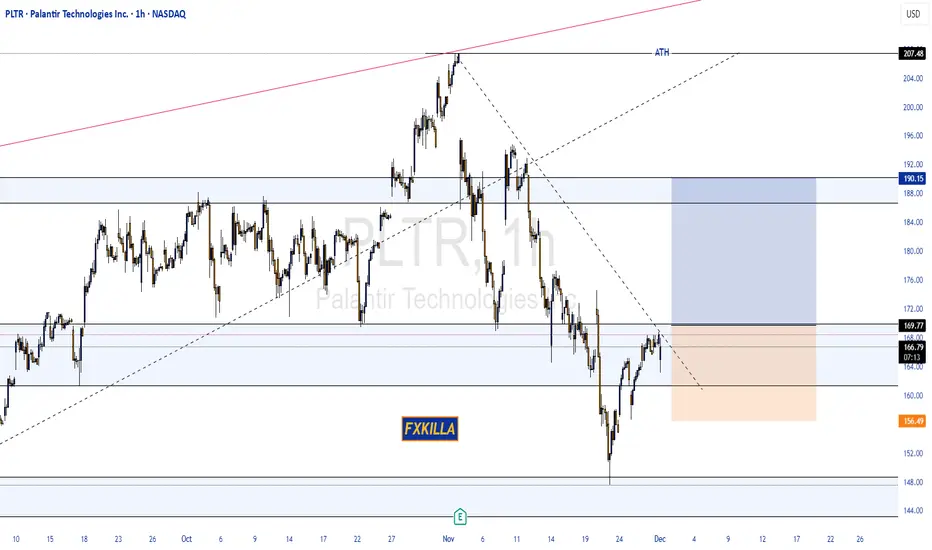
PALANTIR HIGH PROBABILITY BUY SETUP SOON!!!🚨 PALANTIR HIGH PROBABILITY BUY SETUP 🚨
* Here We Can See Clearly The Next Potential Moves For PLTR Coming Hours/Days.
* Keep Your Eyes Close On Your Trading Positions.
* Happy PIP Hunting Traders.
FXKILLA.
PLTR to $150: Overvaluation, AI Hype, Slowing Government Growth If you haven`t bought PLTR at $16:
Palantir has become one of the most crowded trades of the AI boom. While the company is strong fundamentally, the stock price has detached from reality. A move toward $150 (post-split) is not only reasonable — it is structurally likely.
1. Extreme Valuation — PL

Palantir - A devastating -40% drop!🤬Palantir ( NASDAQ:PLTR ) will create a major correction:
🔎Analysis summary:
After a textbook bullish break and retest in mid 2024, we witnessed a parabolic rally on Palantir. During the entire rally, we only witnessed one red candle, which clearly shows some significant overextension. Theref

PALANTIR Is there time to reach $250 before Bear Cycle begins?Palantir (PLTR) has been trading within a multi-year Channel Up throughout this Bull Cycle, which despite the recent correction just above the 1W MA200 (orange trend-line), it still stands.
The last time in fact that we had a similar 1W MA200 approach on such a 1D RSI pattern (RSI reaching 34.00) w

Short PalantirTrading Fam,
This will be only the second short I have taken since implementing my new indicator. We are up 250%+ pending exits in just over a year; however, during that time, I have taken long entries only. Now, it's time to test accuracy on the short side.
On my NASDAQ:TSLA short (my first eve

$PLTR | COVERAGE INITIATED — Personal Position Update [W49]COVERAGE INITIATED — Bullish Classification (Trend Shift Identified)
PLTR — WEEK 49 TREND REPORT | 12/05/2025
Ticker: NASDAQ:PLTR
Timeframe: W
This is a reactive structural classification based on the weekly chart as of this timestamp. Price conditions are evaluated as they stand — nothing

See all ideas
Summarizing what the indicators are suggesting.
Oscillators
Neutral
SellBuy
Strong sellStrong buy
Strong sellSellNeutralBuyStrong buy
Oscillators
Neutral
SellBuy
Strong sellStrong buy
Strong sellSellNeutralBuyStrong buy
Summary
Neutral
SellBuy
Strong sellStrong buy
Strong sellSellNeutralBuyStrong buy
Summary
Neutral
SellBuy
Strong sellStrong buy
Strong sellSellNeutralBuyStrong buy
Summary
Neutral
SellBuy
Strong sellStrong buy
Strong sellSellNeutralBuyStrong buy
Moving Averages
Neutral
SellBuy
Strong sellStrong buy
Strong sellSellNeutralBuyStrong buy
Moving Averages
Neutral
SellBuy
Strong sellStrong buy
Strong sellSellNeutralBuyStrong buy
Displays a symbol's price movements over previous years to identify recurring trends.