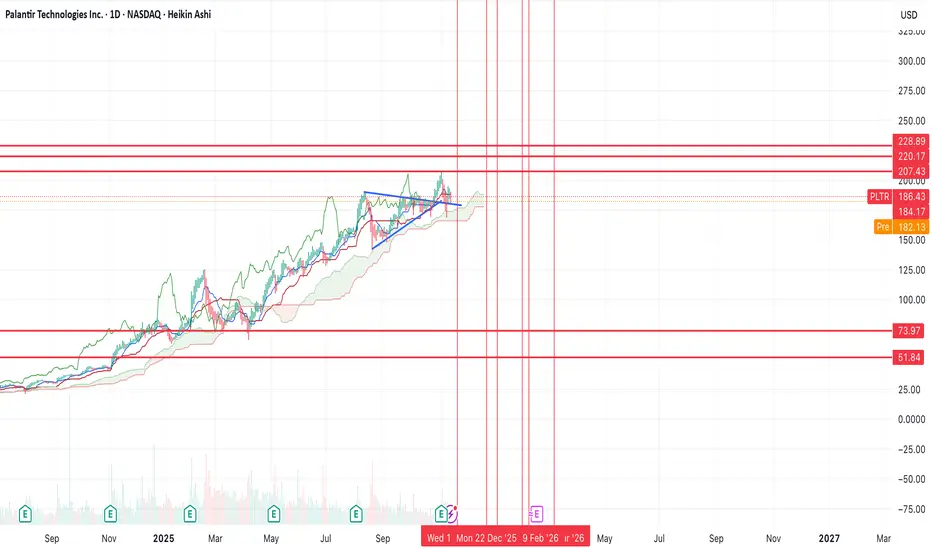
PLTR CAUTION!PLTR is at a key critical area, which has already given a warning shot to bulls.
We have a complete rising wedge structure with 3 waves up and a hook that has already cracked! Within it, we also have a head and shoulders at the top, which is bearish. (H&S not a top is usually a continuation patter
0.1 USD
410.52 M USD
2.55 B USD
About Palantir Technologies Inc.
Sector
Industry
CEO
Alexander Caedmon Karp
Website
Headquarters
Denver
Founded
2003
ISIN
AR0132889822
Palantir Technologies, Inc. engages in the business of building and deploying software platforms that serve as the central operating systems for its customers. It operates through the Commercial and Government segments. The Commercial segment focuses on customers working in non-government industries. The Government segment is involved in providing services to customers that are the United States government and non-United States government agencies. Its platforms are widely used in areas such as defense, intelligence, healthcare, energy, and financial services, supporting data integration, large-scale analytics, and operational decision-making. The company was founded by Alexander Ceadmon Karp, Peter Andreas Thiel, Stephen Cohen, Joseph Lonsdale, and Nathan Dale Gettings in 2003 and is headquartered in Denver, CO.
Related stocks

Palantir - A devastating -40% drop!🤬Palantir ( NASDAQ:PLTR ) will create a major correction:
🔎Analysis summary:
After a textbook bullish break and retest in mid 2024, we witnessed a parabolic rally on Palantir. During the entire rally, we only witnessed one red candle, which clearly shows some significant overextension. Theref

PLTR one more push up before a 70% correction?NASDAQ:PLTR looks like it's on it's last legs here.
If it can push off of this trend line here, then I think we can see one last move higher either into prior resistance, or there's a chance we can break it and form brief new highs. However, after that, I think we'll see a 70% correction back to
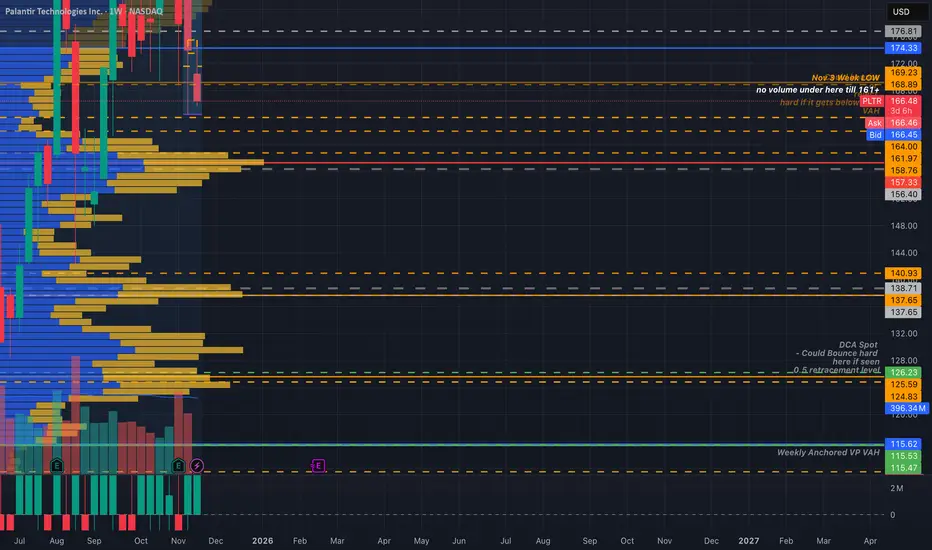
Huntin Wabbits 2.0 - The Doc Sees What's UpPalantir is coming into that death zone if the market doesn't see a recovery soon. If seen, the PA at 161-157(VPOC) will let us know if we dip to $126-$124 again.
Taking a look at this weekly volume profile, the most value for buyers would be at the $115 area.
I'd sell my wife and kids to buy tha
PLTR to $150: Overvaluation, AI Hype, Slowing Government Growth If you haven`t bought PLTR at $16:
Palantir has become one of the most crowded trades of the AI boom. While the company is strong fundamentally, the stock price has detached from reality. A move toward $150 (post-split) is not only reasonable — it is structurally likely.
1. Extreme Valuation — PL

PLTR Weekly Bounce Alert — Don’t Miss This AI SignalPLTR QuantSignals V3 Weekly 2025-11-14
Ticker: PLTR
Current Price: $165.24
Trend: Mixed / Oversold
Confidence: 60%
Expiry: 2025-11-21 (7D)
Strike: $165.00
📈 AI & Technical Forecast
Katy AI Target: $187.16 (+13.3% upside)
Detailed Time-Series: Uptrend toward $190+ by mid-week
RSI: 9.9 → deeply o
Act Fast: PLTR Weekly Puts Signal Rapid Profit Potential!PLTR Weekly Options Signal 2025-11-12
Current Price: $183.04
Trend: Neutral (slight bearish bias)
Weekly Momentum: Bearish (-4.76% 1W)
Confidence: 65% | Conviction: Balanced
Expiry: 2025-11-14 (2 days)
Recommended Strike: $177.50
Trade Signal:
Direction: Buy Puts
Entry Range: $1.48–$1.53
Target 1
PLTR - wave [4]PLTR completed the wave at $207.52.
The current decline is probably a wave .
In terms of duration, this wave may be proportional to wave , that is ~ 2 years.
So I expect the end of the wave in October 2027.

Michael Burry is right about Palantir$PLTR. I have said it before, Michael Burry is right about Palantir.
Expect something like this:

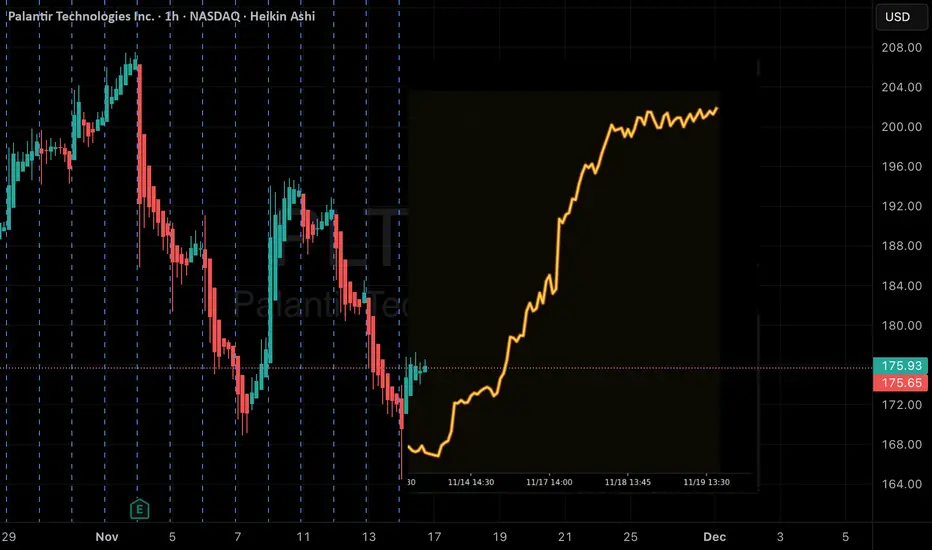
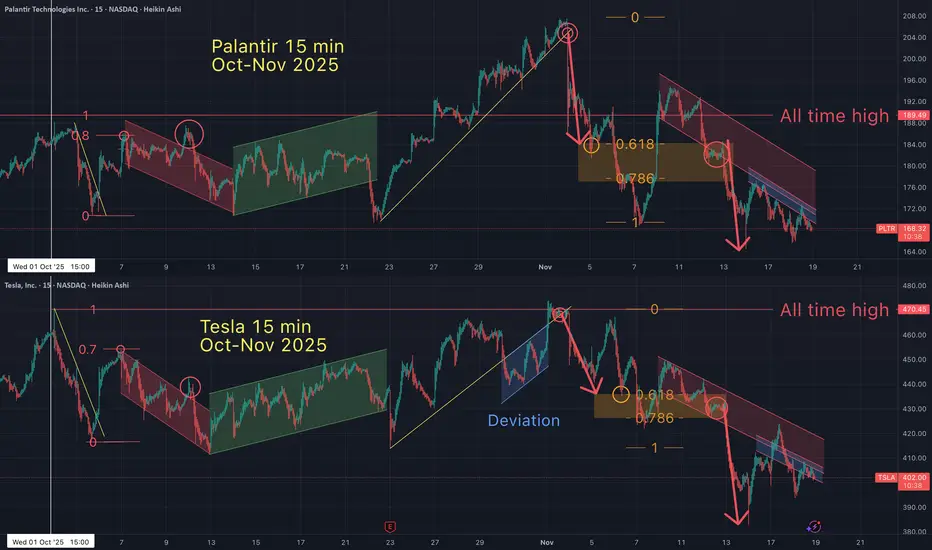
Tesla / Palantir FRACTAL - STILL following for weeks now.So why focus on fractals? I'm driving a point home and I hope you get it. These Tesla/ Palantir "fractal" charts should trigger questions like, "how is it possible for these 2 random assets to basically have the same price action (at the same time) over a 5 week period (on a 15 minute time frame & t
See all ideas
Summarizing what the indicators are suggesting.
Oscillators
Neutral
SellBuy
Strong sellStrong buy
Strong sellSellNeutralBuyStrong buy
Oscillators
Neutral
SellBuy
Strong sellStrong buy
Strong sellSellNeutralBuyStrong buy
Summary
Neutral
SellBuy
Strong sellStrong buy
Strong sellSellNeutralBuyStrong buy
Summary
Neutral
SellBuy
Strong sellStrong buy
Strong sellSellNeutralBuyStrong buy
Summary
Neutral
SellBuy
Strong sellStrong buy
Strong sellSellNeutralBuyStrong buy
Moving Averages
Neutral
SellBuy
Strong sellStrong buy
Strong sellSellNeutralBuyStrong buy
Moving Averages
Neutral
SellBuy
Strong sellStrong buy
Strong sellSellNeutralBuyStrong buy
Displays a symbol's price movements over previous years to identify recurring trends.