PLTR Watching a Major Retest This Week (Nov 10–14)PLTR just pulled back from the top of its multi-month rising channel, and this week is all about whether it can stabilize or whether the sellers are finally stepping in for a deeper reset. Here’s the full multi-timeframe read based on structure, SMC, trendlines, and GEX.
1. Weekly Timeframe (1W)
Macro Structure
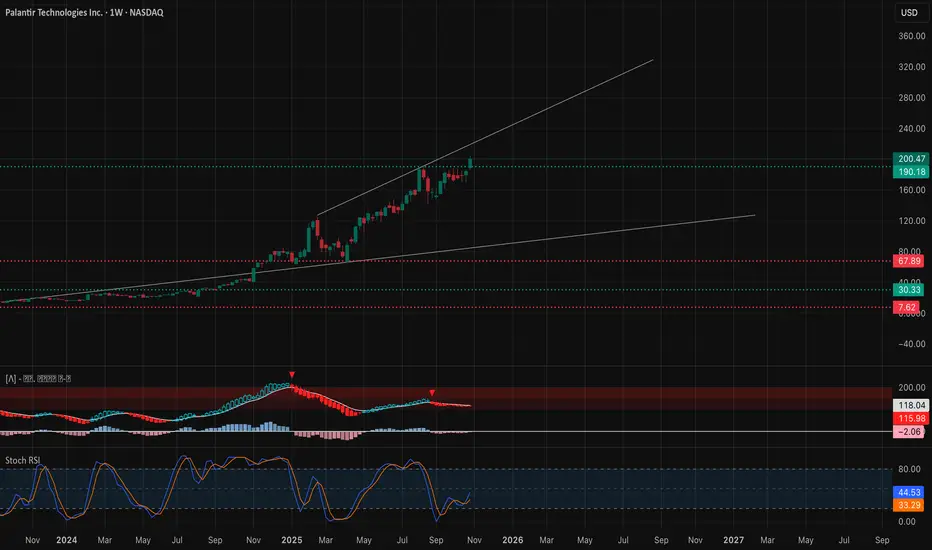
PLTR has been one of the cleanest trending names this year. The weekly structure shows a steady series of BOS formations, each creating higher highs and higher lows. Price just tagged the upper boundary of the rising macro channel and rejected sharply — this is the first meaningful red weekly candle in weeks.
Despite the pullback, PLTR is still trading well above its long-term trendline. Weekly demand sits between 150–160, and a deeper demand pocket sits around 129–140, but price hasn’t touched either yet.
Weekly MACD is curling down for the first time since the summer. Stoch RSI is rolling over from overbought. This doesn’t break the trend, but it does confirm momentum cooling at the top of the channel.
Weekly Trade View
As long as PLTR stays above 150–160, the broader trend remains bullish. The pullback could be a reset before another leg up, but momentum needs to cool off more. If the weekly closes below 160 later this month, that’s when the weekly trend comes into question.
Weekly GEX View
There’s heavy positive GEX above 190–200, meaning upside from here can get slower and grindy. Below 175, negative GEX expands quickly and opens the door for sharper moves down. PLTR is currently sitting right at the edge of that zone.
2. Daily Timeframe (1D)\
Daily Trend and Structure
The daily chart gave us a downside CHoCH after failing to hold the breakout above 200. The move down wasn’t just a rejection — PLTR also broke back into the prior range. That confirms short-term weakness.
The 169–176 zone is the major daily support cluster. That’s where PLTR is sitting right now. If buyers don’t show up here, the next zone is 158–160.
Daily MACD is red and widening. Stoch RSI is in oversold territory and still pointing lower. There’s no confirmed reversal yet.
Daily Trade View
Hold 169–176 → PLTR can bounce back toward 185 then 190.
Break 169 → opens 158–160, then 142.
Daily GEX View
Put support sits at 170–172.
Below that, a larger put wall sits at 158.
Call walls near 190 and 200 will act as ceilings unless PLTR regains momentum.
3. 1-Hour Timeframe (1H)
Short-Term Structure
PLTR has been trending inside a clean descending channel. Multiple BOS signals confirmed seller control. But the latest CHoCH printed right near 175, which is the first sign of short-term buyers stepping in.
Price is now testing the 180–181 zone — that’s the short-term pivot.
1H MACD is curling upward with a strong shift in momentum. Stoch RSI is climbing into the mid-range, showing buyers stepping in for the first time since Nov 5.
1H Trade View
Reject 180–181 → continuation lower into 175 then 169.
Break above 181 → opens room into 186, then potentially 191.
This is the level to watch Monday morning.
4. 15-Minute Timeframe (15M)
Intraday View
The 15M structure flipped first:
PLTR broke the intraday downtrend with a clean BOS and a follow-up CHoCH. The best part is that price is now consolidating above the broken trendline, showing control shifting to buyers on small timeframes.
But the 180–181 line is still the intraday ceiling across all lower timeframes.
MACD on 15M is trending up smoothly. Stoch RSI is elevated but still supportive.
15M Trade View
Above 180–181 → scalp long into 185, then 187–190.
Reject 180–181 → scalp short into 176, then 172.
The structure is clean, and Monday morning’s reaction will decide whether PLTR extends the intraday recovery or rolls back over.
5. GEX Map & Options Strategy
GEX Interpretation for PLTR (This Week)
Positive GEX at 190–200
Negative GEX at 172–175
Major put wall at 170
Strong call wall around 190–192
Highest call resistance around 200
What that means:
Upside slows sharply near 190–200
Downside picks up under 175
170 is a key support magnet this week
If 170 breaks, volatility will expand quickly to the downside
Options Strategy
If PLTR fails at 180–181:
Short-dated puts toward 175 or 170 are clean.
If PLTR breaks above 181 and holds:
Short-dated calls toward 185 or 190 make sense.
Avoid chasing calls above 200 — that sits inside heavy positive GEX and tends to stall.
My Thought
PLTR is coming off a major rejection at the top of its macro channel. The larger trend is still bullish, but the daily and intraday signals clearly show short-term weakness. Everything this week depends on how PLTR behaves around the 180–181 zone.
Rejecting that area keeps momentum toward 175 and 169.
Breaking above it shifts structure bullish again with room to recover toward 185 and 190.
This is a level-driven week. Let the reaction at 180–181 lead the trade.
Disclaimer
This analysis is for educational purposes only and not financial advice. Always manage your risk. If you want any other ticker covered with the same structure, just let me know.
Palantir Technologies Inc. Shs Cert Deposito Arg Repr 0.3333333333 Sh
No trades
Trade ideas

PalantirPrice looks to have finally finished its initial a wave lower. We have yet to get confirming data, however, it maintained pos div (barely) and has moved up with a little bit of strength. Looking at the overnights, price has started out up over 3%. This is all good news for b to have finally begun. If it has indeed kicked off, then we should be headed to the target box above. This is between the 0.618-0.786 per the standard move higher. As you should know by now, the standard move will be a 3-wave pattern/structure. Of course, it is a b wave, and they can become very complex. For all we know this thing could form into a triangle. We just have to be patient and watch what unfolds.
The turquoise count suggesting that cycle I isn't yet complete remains on the chart and will stay there until we can get some confirming data that it is in fact over. I do think that it is over, but I could also be wrong. There also remains the possibility that this initial a wave is yet to complete. These are just things to keep in the back of your mind in case this thing goes against what we think will happen. That way if it does go against expectations, we don't have to quickly figure out what is going on.

Palantir technologies Technical outlook
the stocks will reject 195-193.88 supply roof zone
the current support at 169.54 demand floor is valid and will lead buyers into 195-193.88.however the break and close of this supply roof will be a new wave into 200-230$
break and close 169.54$ will retest 133.75-130 and could come to lower level.
the weekly SMA200 also confirms 169.54 demand floor for a buy
Key Reasons for Palantir’s Stock Drop
High Valuation Concerns: Palantir's stock trades at an extremely high forward price-to-earnings (P/E) ratio of about 220, which many investors view as disconnected from fundamentals. This lofty valuation raises concerns about sustainability and growth expectations.
Short Selling Pressure: Notably, influential hedge fund manager Michael Burry, famous for his bets prior to the 2008 crisis, has taken a significant short position against Palantir. This adds selling pressure and can spook other investors.
Mixed Market Sentiment: Despite beating earnings and revenue expectations with strong growth (Q3 revenue up 63%, raised full-year guidance to over $4.4 billion), the stock dropped post-earnings as investors digested the high valuation and some caution on sequential growth.
Macro and Sector Volatility: Broader tech sector pullbacks and concerns around government spending delays (affecting contract flows) in the current environment weigh on the stock.
CEO Response: Palantir CEO Alex Karp has publicly criticized short sellers and expressed confidence in the company’s strategic direction and partnerships.ala
Palantir Technologies' focuses on advanced data integration, analytics, and AI-powered decision-making platforms for government and commercial clients. The company transforms vast, complex data into actionable insights that enhance operational efficiency, security, and strategic decision-making.
Core Business Model and Platforms:
Palantir Gotham: Initially developed for government intelligence and defense sectors, focusing on counterterrorism, law enforcement analytics, cybersecurity, and risk detection.
Palantir Foundry: A commercial data integration platform enabling enterprises across industries (finance, healthcare, energy, manufacturing) to unify data, build customized applications, and optimize operations.
Palantir Artificial Intelligence Platform (AIP): The latest platform embedding AI and machine learning directly into workflows to enable predictive analytics, automation, and integration of large language models for enhanced enterprise intelligence.
Revenue Model:
Revenue primarily comes from long-term contracts with government agencies and enterprise clients, often customized and high-value deployments.
Palantir invests heavily in R&D, especially in AI, machine learning, and cybersecurity technologies, to sustain its platform leadership.
Clients pay for software licenses, deployment, ongoing support, and customization services.
Fundamental Strengths:
Strong growth with revenues surpassing $4 billion in 2025, driven by expanding commercial adoption.
Strategic partnerships with governments and Fortune 500 companies provide recurring revenue and market credibility.
Demonstrated success in critical use cases such as pandemic vaccine distribution, supply chain resilience, and financial risk management.
Emphasis on data security and privacy compliance builds client trust.
Future Outlook:
Increasing integration of generative AI and autonomous workflows.
Expansion into mid-sized businesses and new verticals.
Focus on sustainability analytics and ethical AI governance.
Summary
Palantir is an enterprise AI and data analytics company providing advanced platforms (Gotham, Foundry, AIP) that help governments and companies harness data efficiently. Its business model relies on high-value, long-term contracts with heavy R&D investment. Palantir aims to be a key enabler of AI-powered enterprise transformation across industries.
#ai #stocks

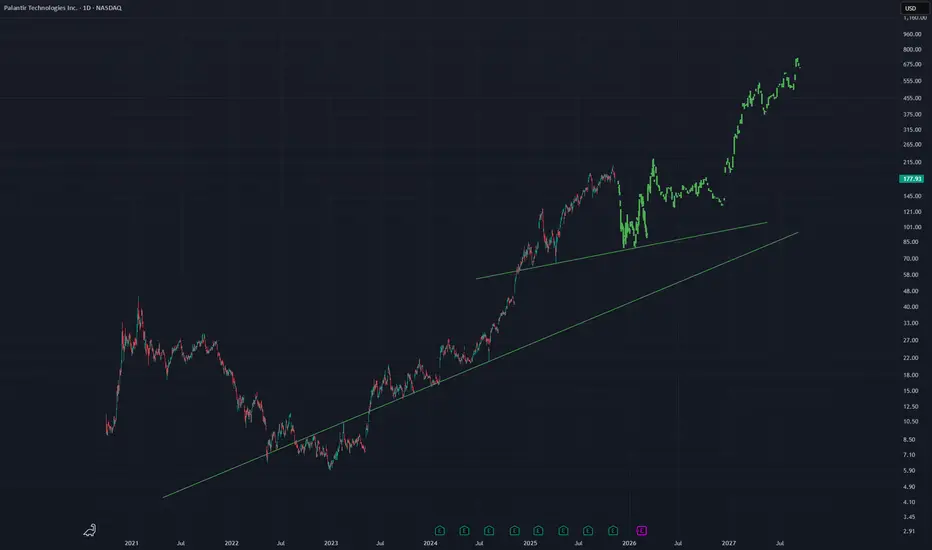
PLTR - Bars Pattern PredictionsUsing the bars pattern tool on this daily chart for PLTR to see if there will be a retest of a lower trend line before continuation upward
The lowest trend line probably will not be hit but i leave it there
See if future price action looks anything at ALL like this
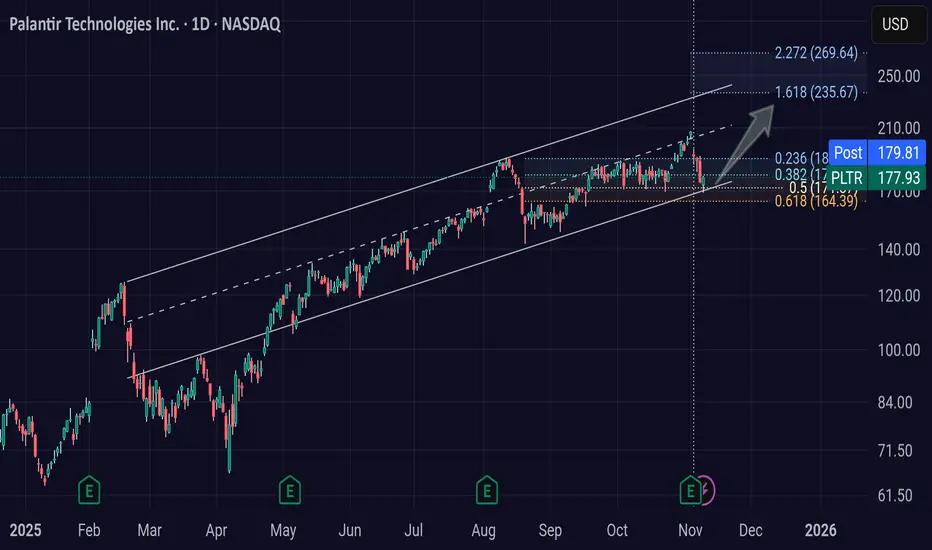
PLTR: staying on track for the time beingBullish channel in tact. Successful rebound on the .5 fib.
I can see a 40%+ move from here in the short-term, and following the trend.
Will it hold? Idk.
I'm a long term holder (10-20 yrs), and don't make any trade advice.
PALANTIR HIGH PROBABILITY SETUPS SOON!!!🚨 PLTR HIGH PROBABILITY BUY/SELL SETUPS 🚨
* Here We Can See Clearly The Next Potential Moves For PALANTIR Coming Hours/Days.
* Keep Your Eyes Close On Your Trading Positions.
* Happy PIP Hunting Traders.
FXKILLA.

PALANTIR GOES READY TO 'WHAKA-WHAKA-WHAKA' ALL-MICHAELS-BURRIESPalantir Technologies has recently announced its Q3 2025 Earnings results.
“114% - our Rule of 40 score!*
These results make undeniable the transformational impact of using AIP to compound AI leverage.
Year-over-year growth in our U.S. business surged to 77%, and year-over-year growth in U.S. commercial climbed to 121%.
We are yet again announcing the highest sequential quarterly revenue growth guide in our company’s history, representing 61% year-over-year growth,” said Alex C. Karp, Co-Founder and Chief Executive Officer of Palantir Technologies.
*Revenue: $1.18 billion vs analyst estimates of $1.09 billion (62.8% year-on-year growth, 8% beat).
Adjusted Operating Income: $600.5 million vs analyst estimates of $501.9 million (50.8% margin, 19.7% beat).
Rule of 40 score total amount : 113.60 points.
Then later, Palantir erased nearly $42b from its market cap a day after Burry-the-Bear' announcement his betting against it.
Despite of all this crap, we still keep focus on further upside development in Palantir's stock, as it explained on the main technical graph.
--
Best 'whaka-whaka-whaka' wishes,
@PandorraResearch Team

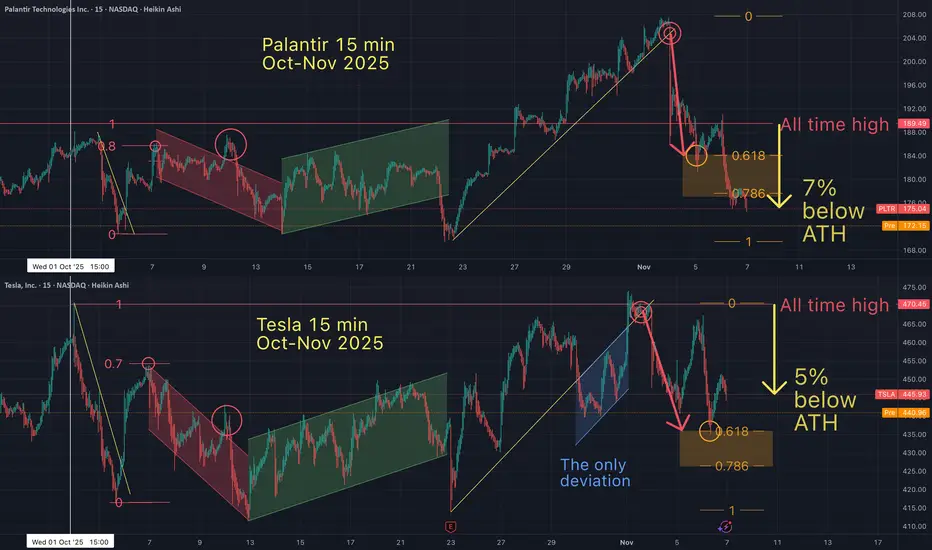
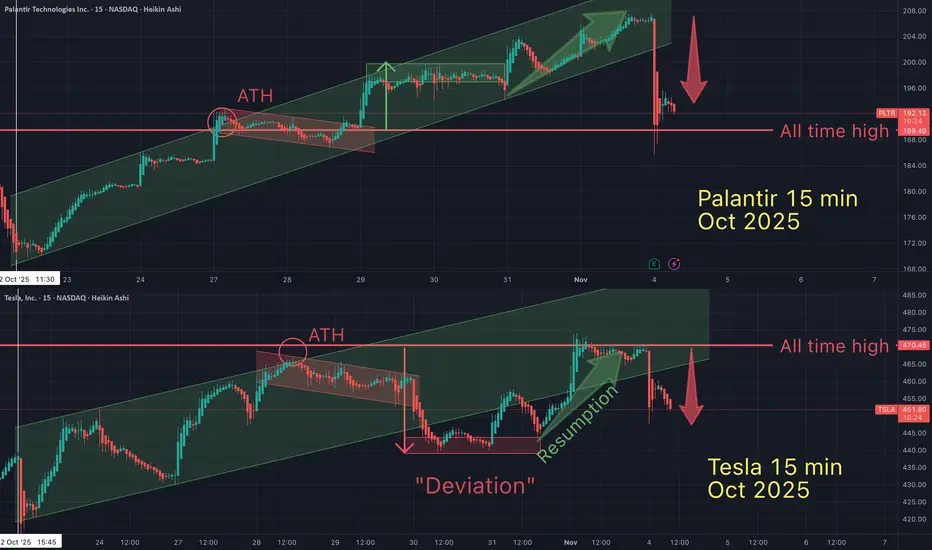
After 30 Days- Telsa is STill following Palantir fractal
On Oct 7th (30 days ago) I suggested that Tesla and palantir were in a "fractal" pattern.
Oct 7th - macro look
On Oct 27th - I wrote: "Fractals are a mathmatical anomaly, if you understand linear equations (and believe the market is "random"). All assets are doing the same patterns over and over, on all time frames. You just need to see it for what it is.
Oct 28th - "What is a fractal mathmatically?"
All asset charts are graphs, governed by coordinates on an x-axis and y-axis "chart". Where there exist trendlines that price action "respects". These trendlines and ratios are dictated by equations with several variables. If variables were by definition "random", then what would be the chance of 1 fractal appearing in a random assortment of buyers and sellers, in all different time zones (and countries)... all buyin in different amounts...at different times...
*Regardless the fractal seems to remain intact.
Oct 29th - "On Oct 7th I suggested that Palantir & Tesla were in a very bullish long term pattern and were both about to *soon break out into new all time highs (ATH). Palantir just did...is Tesla next?
Oct 29th - macro look "What do you think? Is Tesla primed for an all time high (soon)...and a blow off top?"
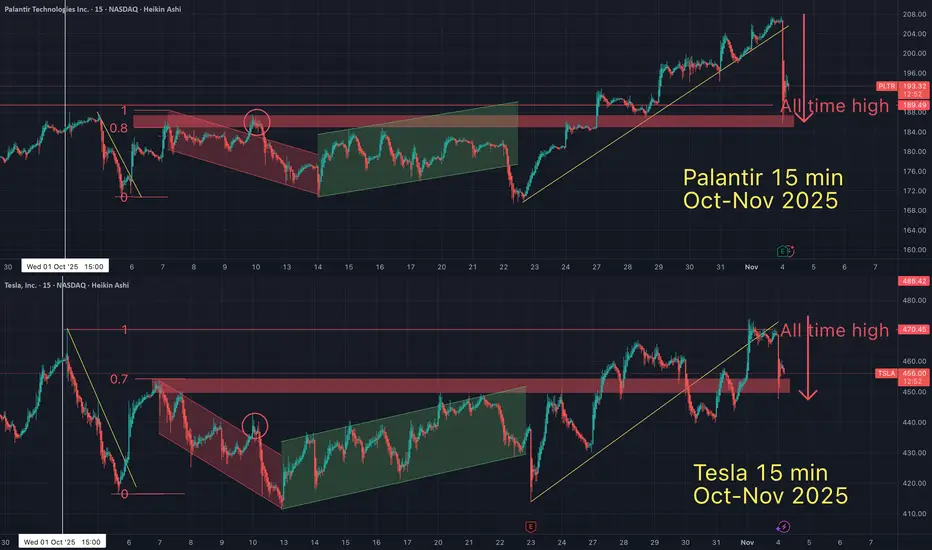
Nov 4th - "On Oct 7th I suggested the Palantir / Tesla "fractal" would lead them both to an all time high. Fast forward to today (1 month later), Palantir has recently hit a new ATH and Tesla is still following the fractal closely. I believe Tesla is days or weeks away from an ATH.
Tesla will move very quickly in 3rd angle fashion, once it breaks ATH & holds support.
If the fractals continues at this pace, how soon do you think Tesla will HOLD SUPPORT above ATH?"
Nov 4th - A different way of looking at this fractal. I wrote "Even when there is a 'deviation' from the pattern, the overall agenda prevails. There's no stoping this moving train. Hopefully you're on board...and know when to get off.
PLTR - Is that a top?Perhaps one of the clearer counts on offer at the moment suggesting that we might be due a correction at least in a number of US tech stocks and especially this one. Again, some decent fib extensions here and a nice inverse hammer candle before price headed down.

Palantir Technologies (PLTR) Shares Fall Despite Strong EarningsPalantir Technologies (PLTR) Shares Fall Despite Strong Earnings
Palantir Technologies (PLTR), a company specialising in big data analytics software, released a strong quarterly report this week:
→ Earnings per share: actual = $0.21, expected = $0.17
→ Revenue: actual = $1.181 billion (up 63% year-on-year), forecast = $1.09 billion
Palantir thus reaffirmed its status as a leader in the field of artificial intelligence. Yet, despite the impressive results, PLTR shares fell following the release. Why?
It is likely that much of the optimism had already been priced in during the company’s 150% rally earlier this year. In other words, the drop in PLTR’s share price appears to have been driven purely by market sentiment and overly high expectations, rather than any weakness in the company’s fundamentals.
Technical Analysis of Palantir Technologies (PLTR)
Back in August, when analysing PLTR’s price movements, we:
→ confirmed the relevance of the ascending channel (shown in blue) and highlighted support around the psychological level of $150;
→ suggested that, following a spike in volatility, the price could resume its upward trend.
As the chart’s arrow indicates, this scenario indeed played out – the lower boundary of the channel acted as strong support. Building on that level, the bulls demonstrated conviction, pushing the price through key resistance zones at $160 and $170.
In October, the price broke out of a Bullish Flag (marked by an arrow) and subsequently rose above the psychological barrier of $200.
However, the chart has since taken on a more bearish tone because:
→ the price failed to hold above $200 – creating what looks like a FOMO bull trap;
→ the median line of the channel acted as resistance;
→ following the earnings release, a bearish gap appeared in the $190–200 zone, which may now serve as future resistance.
For the bulls, much depends on whether support at the lower boundary of the channel can hold. Based on the current setup, that task looks more challenging than it was in August.
This article represents the opinion of the Companies operating under the FXOpen brand only. It is not to be construed as an offer, solicitation, or recommendation with respect to products and services provided by the Companies operating under the FXOpen brand, nor is it to be considered financial advice.

Palantir is nowhere NEAR DONE - I see $255 soon. "AI's Exponential Dawn: Why Burry's Bears Are -ERRONEOUSLY- Shorting the Future of 7.8 Billion Lives"
November 5, 2025
AI's Exponential Dawn: Why Bears Like Burry Are Betting Against the Future of 7.8 Billion Civilization.
Amid growing concerns of a market peak, skeptics are increasingly targeting the cornerstone of tomorrow's economic expansion: artificial intelligence. Yet, as I've emphasized, AI stands as the unassailable pillar driving a profound transformation in infrastructure capacity and construction—much of it already financed and underway. This restructuring of industrial organization is not merely national or regional; it is profoundly global, dwarfing any prior industrial cycle in scope and ambition. For the first time in world history, this cycle will encompass 7.8 billion people across more than 150 countries, weaving AI into the fabric of economies from Silicon Valley to Shenzhen and beyond.
It would be both short sighted and unconscionable to permit a cadre of short-sellers to undermine this momentum.I view figures like Michael Burry and his cohort as mere irritants—a fly in the ointment—against the backdrop of the Trump administration's vested interest, with trillions upon trillions at stake. Their resources dwarf anything Burry could marshal, ensuring AI's inexorable advance.Take Palantir (PLTR): Its elevated forward P/E ratio belies the unparalleled optimization efficiencies its platform will deliver, a factor markets have yet to fully price in. To illuminate this, let's quantify the sector's explosive growth and reverse-engineer future revenues for PLTR, NVIDIA (NVDA), and the broader AI ecosystem. What emerges is not speculation, but a structural imperative.Quantifying the Global Scale: 7.8 Billion People, 150+ Countries, and Trillion-Dollar Trade FlowsTo dissect this unprecedented engagement, consider the AI ecosystem's projected footprint: By 2030, the global AI market will swell to $4.8 trillion (a 25-fold surge from $189 billion in 2023, per UNCTAD), directly fueling $19.9 trillion in cumulative economic value (IDC).
This isn't siloed innovation—it's a trade engine reorienting supply chains, semiconductors, and software exports across borders, with AI-related goods and services comprising up to 10% of global merchandise trade by decade's end (WTO World Trade Report 2025).
Engagement spans demographics and geographies: AI tools will reach 729 million direct users by 2030 (up from 116 million in 2020, Bureau Works), but indirect touchpoints—via productivity boosts, job transformations, and embedded applications—will permeate 40-50% of the global workforce, affecting over 3 billion people (IMF estimates). In 150+ countries (spanning Anthropic's Claude. ai adoption data), legislative AI mentions have surged ninefold since 2016 (Stanford AI Index 2025), signaling policy alignment from G7 hubs to emerging BRICS economies. Here's a regional breakdown of projected 2030 impacts, highlighting GDP uplift, population exposure, and AI-driven trade activity (synthesized from McKinsey, PwC, and UNCTAD models; assumes 29% CAGR for AI market):
North America: Population Covered: 0.6B (% of Global Pop.: 8%); Projected GDP Uplift: $3.5T; AI Trade Volume Est.: $1,200B; Key Drivers: Innovation hubs; 14.5% GDP boost (ETA); chip exports dominate.
Europe: Population Covered: 0.7B (% of Global Pop.: 9%); Projected GDP Uplift: $2.8T; AI Trade Volume Est.: $900B; Key Drivers: Regulatory frameworks; software/services trade surges 20% YoY.
Asia-Pacific: Population Covered: 4.7B (% of Global Pop.: 60%); Projected GDP Uplift: $7.2T; AI Trade Volume Est.: $1,800B; Key Drivers: Manufacturing scale (China/India); 50% of global AI hardware trade.
Latin America & Africa: Population Covered: 1.8B (% of Global Pop.: 23%); Projected GDP Uplift: $3.0T; AI Trade Volume Est.: $600B; Key Drivers: Leapfrog adoption; emerging data center investments double trade flows.
Middle East & Others: Population Covered: 0.0B (residual, % of Global Pop.: <1%); Projected GDP Uplift: $0.4T; AI Trade Volume Est.: $300B; Key Drivers: Energy-AI nexus; sovereign funds fuel cross-border deals.
Global Total: Population Covered: 7.8B (% of Global Pop.: 100%); Projected GDP Uplift: $16.9T; AI Trade Volume Est.: $4,800B; Key Drivers: $15.7T cumulative GDP add (PwC); $4.60 ROI per $1 AI spend (IDC).
This matrix underscores the trade multiplier: Every $1 billion in AI infrastructure spend generates $4-5 billion in downstream commerce—semiconductors from Taiwan to hyperscalers in the U.S., optimization platforms like PLTR streamlining ops in 100+ countries, and NVDA's GPUs powering clusters from São Paulo to Seoul. Developing nations risk commoditization without adoption (World Bank), but with $670 billion in annual data center capex by 2025 scaling to $1.67 trillion (McKinsey), the flywheel accelerates inclusive growth.
In sum, this isn't a cycle—it's a paradigm, with AI trade volumes rivaling oil today and touching every citizen through enhanced efficiencies. Markets undervalue this universality; forward thinkers will capitalize.
Projecting Revenue Gains from AI Adopters:
Real-World Transformations in Logistics, Fraud Detection, and Autonomous MobilityBuilding on our exploration of AI's global paradigm shift, let's zoom in on tangible revenue uplift for early adopters. These aren't hypotheticals—AI delivers measurable efficiencies that cascade into bottom-line gains, often 20-50%+ in targeted verticals. We'll dissect three pillars: logistics optimization, fraud detection (spotlighting American Express's playbook), and electric autonomous mobility (with Tesla Semi as the benchmark). Projections draw from industry benchmarks, assuming 2025-2030 adoption ramps at 20-40% CAGR, turning cost savings into revenue via pricing power, volume growth, and margin expansion.1. Logistics Efficiency: Unlocking $1T+ in Global Supply Chain ValueAI streamlines routing, inventory, and predictive maintenance, slashing operational costs by 15-25% while boosting delivery speeds 20-30%—translating to 8-15% revenue gains through customer retention and premium services. For a mid-tier logistics firm (e.g., $10B annual revenue like DHL subsets), this means:
2025 Projection: $800M-$1.2B uplift from AI-driven demand forecasting (reducing stockouts by 40%) and autonomous robots cutting warehouse labor 30%.
2030 Cumulative: $5-7B per adopter, as the $306B AI logistics market (42% CAGR) fuels ecosystem trade—e.g., PLTR's AIP optimizing routes for 121% U.S. commercial growth. Net: Adopters like UPS could see EBITDA margins swell 5-7 pts, compounding to 50%+ revenue equivalence over five years.
2. Fraud Detection: American Express's Margin-Doubling MasterclassAI's real-time anomaly detection has revolutionized payments, with false positives down 45-60% and fraud losses curbed 20-38%—directly inflating margins without headcount hikes. Amex exemplifies: Their ML models (deployed since 2014) boosted fraud resolution 100%, maintaining industry-lowest rates for 14 years and enabling 60% fraud reduction—effectively doubling profit margins (ex-expansion) via reclaimed revenue and lower provisions ($1-2B annual savings on $60B+ charge volume).
2025 Projection: For a $50B fintech (e.g., Visa peers), 50% fraud drop yields $500M-$1B margin boost, equating to 10-20% revenue proxy via trust-driven card spend.
2030 Cumulative: $10-15B per major player, as AI fraud tools scale to $50B market subset—PLTR's ontology-driven detection could amplify this 2x for enterprise clients. This isn't cost-cutting; it's revenue alchemy—fraud savings recycle into growth investments.
3. Electric Autonomous Mobility: Tesla Semi's $200K+/Truck Savings FlywheelAutonomous electric semis (e.g., Tesla's) merge 70-84% fuel savings with 90%+ labor reductions, retrofitting special lanes for driverless ops unlocking 20-30% fleet utilization gains. Baseline: Diesel semis cost $0.45/mile (fuel + driver ~$0.20 each); Tesla Semi drops to $0.13/mile electric + scaled labor.
Fuel (10% Base + Efficiency): 70% cut yields $0.03/mile savings (conservative; real 84% = $0.04+). For 100k miles/year/truck: $3k-$4k annual gain.
Driver (1 per 10 Trucks): $50k avg. U.S. salary = $5k/truck/year savings; full autonomous (lanes retrofitted) = $50k/truck elimination.
2025 Projection: Per fleet of 100 Teslas: $800k fuel + $500k labor = $1.3M total (~$13k/truck), or 20% revenue uplift via lower rates/higher loads—$200k/truck over 3 years per Tesla claims.
2030 Cumulative: $50-70M for 500-truck operator (18% fuel cut industry-wide for AVs), scaling to $500B global trucking savings as NVDA-powered autonomy proliferates. Special lanes (e.g., U.S. interstate pilots) could double this by enabling 24/7 driverless runs, turning capex into 40%+ margin expansion.
Across these, adopters capture 15-30% revenue equivalence from AI efficiencies, compounding the $16.9T global GDP uplift we charted. PLTR and NVDA aren't just enablers—they're the multipliers. Skeptics, take note: This is adoption economics at warp speed.
In Closing:
Exponential Revenues Unfolding Now, Fueling Enterprise Transformation
Article content
These projected revenues are not distant mirages but colossal forces accruing in real time—AI's software essence ensures exponential compounding, with adoption accelerating across enterprises, governments, and infrastructures today. From Palantir's AIP platform already powering 500+ deals in Q3 2025 to NVIDIA's Blackwell GPUs shipping at scale amid $670B data center capex this year, the flywheel spins at warp speed. Markets may undervalue the immediacy, but for corporate leaders, this signals a profound operational shift:
Software like Palantir's isn't just a tool—it's the accelerator for your own revenue trajectories, embedding intelligence into every workflow for immediate, scalable gains.Consider Palantir as a prime example of this software-driven momentum. As a pure-play AI optimization platform, its revenue trajectory exemplifies the rapid mushrooming potential available to adopters.
Drawing from the last three quarters (Q1 FY2025: $880M; Q2: $1,004M; Q3: $1,180M), we've seen sequential growth accelerating from 14% to 17.5%—a clear sign of exponential uptake in commercial and government segments. Projecting forward at an averaged 15.8% quarter-over-quarter growth (conservative, given the upward trend and software's low marginal costs), here's the quarter-by-quarter outlook for the next five:
Q4 FY2025 (Oct-Dec 2025): $1,366M (+16% QoQ) – Early signs of tripling annualized run-rate from Q1 levels, as AIP bootcamps convert pilots to full deployments overnight.
Q1 FY2026 (Jan-Mar 2026): $1,582M (+16% QoQ) – U.S. commercial surges could push this 80%+ YoY, mirroring the 121% Q3 clip.
Q2 FY2026 (Apr-Jun 2026): $1,832M (+16% QoQ) – Global enterprise wins stack, with software scalability enabling 50%+ margins on new logos.
Q3 FY2026 (Jul-Sep 2026): $2,121M (+16% QoQ) – Cross-border optimization deals proliferate, potentially doubling from Q3 2025.
Q4 FY2026 (Oct-Dec 2026): $2,456M (+16% QoQ) – Cumulative FY2026 could exceed $9B, a near-tripling from FY2025's $4.4B guide, underscoring software's viral adoption curve.
This isn't linear scaling—it's software at work: Zero-capex marginal revenue from each new user, compounding efficiencies in logistics, fraud prevention, and beyond. Imagine applying similar velocity to your P&L: A 16% QoQ lift in your core ops could mean double-digit revenue mushrooms within a year, all without proportional headcount bloat. Enter Michael Burry: Yet another fool wagering unethically against humanity's most transformative industrial process to date—a global reconfiguration touching 7.8 billion souls. History will judge such shorts not as visionaries, but as footnotes in progress.
The imperative for managers ? Pilot AI software now—before competitors claim the edge.
#AI #DigitalTransformation #EnterpriseTech #Leadership

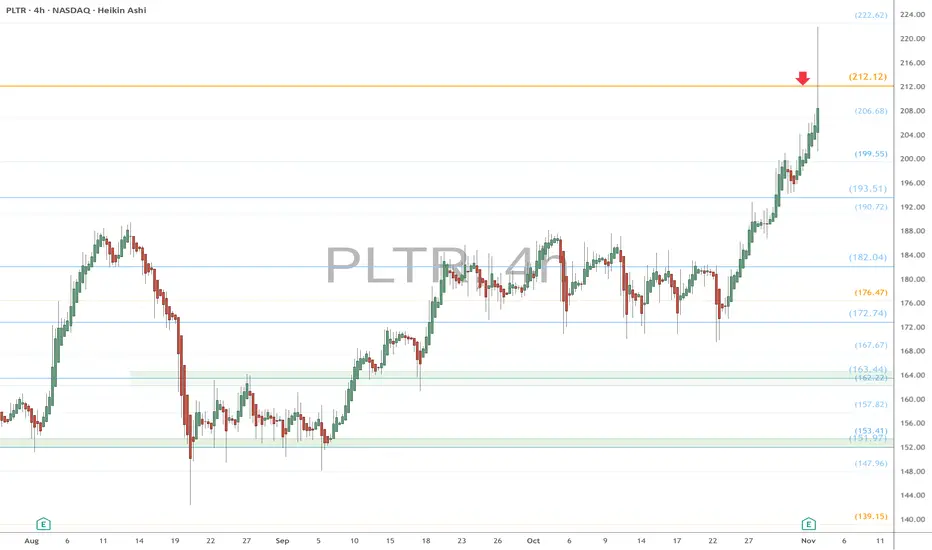
PLTR eyes on $212.12: Golden Genesis fib could mark a TOP PLTR has been slowing its ascent before earnings.
About to test a Golden Genesis fib at $212.12
Reaction here will give clues about its strength.
It is PROBABLE that we orbit this fib a few times.
It is POSSIBLE a Break-n-Retest continues uptrend.
It is PLAUSIBLE that we have topped for a while.
.
See "Related Publications" for previous plots such as this BOTTOM CALL:
Hit BOOST and FOLLOW for more such PRECISE and TIMELY charts.
========================================================
PLTR: potential mid-term top formation Price have reached key mid-term resistance zone outlined in May idea:
As long as price remains below the Nov 3 highs, I’ll be operating under the main assumption that the mid-term top is in, anticipating more downside in the coming weeks and months.
A 1–3 day bounce to potentially close the gap could provide a good delayed-reaction short setup.
Chart:
Macro support ideal for this correction: 120–85.
Macro view:

PLTR: Potential for Further Upside in H2 2025Price is showing a constructive, low-volume pullback into rising EMAs - a healthy sign within an ongoing uptrend as long as price is holding above 118-110 support zone.
Daily trend structure:
Macro trend structure (Weekly):
Thank you for your attention and I wish you successful trading decisions!

SHORTS WINNING TODAY (ʘ‿ʘ)Michael Burry is once again betting against the market. For Nvidia, he bought puts covering about 1 million shares worth approximately $187 million. For Palantir the exposure is puts on roughly 5 million shares valued at about $912 million
Palantir, which has gained over 170% this year, but is currently down 8.8% on Tuesday after its latest quarterly results (which were good) were eclipsed by Burry and a general risk-off shift in the market. Palantir CEO, Alex Karp has called Burry out for market manipulation even though most analysts might call Palantir “overvalued”.
In crypto markets, Bitcoin has been hovering near the key $100,000 level, a price it hasn’t dropped below since June 23. If it breaks lower, traders could be watching $98,240 and then $96,975 as the next major support levels.
Ether tumbled as much as 9% on Monday, breaking below the $3,600 support after hackers stole more than $100 million from a major DeFi protocol. The decline leaves Ethereum about 25% below its August peak of $4,885.

Tesla / Palantir "fractal" - Why do fractals exist?Even when there is a "deviation" from the pattern, the overall agenda prevails. There's no stoping this moving train. Hopefully you're on board...and know when to get off.
May the trends be with you.
FRACTALS are like maps. This one is STILL working.On Oct 7th I suggested the Palantir / Tesla "fractal" would lead them both to an all time high. Fast forward to today (1 month later), Palantir has recently hit a new ATH and Tesla is still following the fractal closely. I believe Tesla is days or weeks away from an ATH.
Here was the 15min chart at that time:
Tesla will move very quickly in 3rd angle fashion, once it breaks ATH & holds support.
If the fractals continues at this pace, how soon do you think Tesla will HOLD SUPPORT above ATH?
PLTR No wonder why that man bought puts rsi is over 95 in the monthly . Scam needs a retrace before going higher . Also everything is showing bulls losing momentum I think the market will retrace here for the coming days . Just a thought

PLTR Charging Into a Breakout — Key Levels for Nov. 3–7 🚀Weekly Structure (Macro Bias)
Market Structure:
PLTR continues to print clean BOS pushes on the weekly. The trend has respected a rising channel for over a year, and we just saw another rotation from discount back into premium. Smart money is clearly comfortable accumulating on pullbacks into the mid-trend grey zone you marked. The last CHoCH failed to meaningfully break trend — buyers defended instantly.
Liquidity:
You can see them running liquidity above prior weekly highs, then stabilizing rather than rejecting — bullish tell. Until that pattern changes, continuation is favored.
Trend Direction:
Strong bullish trend, higher highs and higher lows, no weekly displacement against structure.
Supply & Demand:
* Demand: 170–188 zone (previous consolidation, order block stack)
* Deeper Demand: 142–150 (weekly value)
* Supply: 204–210 is the next magnet zone; any wick here needs to be watched for absorption.
This week, bulls will try to hold price above 190–188 to maintain momentum.
Indicator Confluence:
* 9EMA > 21EMA and widening — momentum is accelerating, not fading.
* MACD histogram expanding positive again; slope is curling up.
* Stoch RSI rising, supporting continuation.
* Volume uptick on expansion candles — institutions weren’t shy adding.
Daily Structure (Swing Bias)
Market Structure:
The daily trendline shows a clean breakout retest behavior. Last week’s hesitation was simply liquidity engineering around 190. Friday’s candle took initiative — that’s conviction.
Key Levels:
* Support: 190 → 188
* Deeper support: 177
* Resistance: 200.50 → 204.20 next
As long as we stay above that trendline retest zone, the structure remains dominantly bullish.
Order Blocks & Liquidity:
There’s a clear bullish order block around 185–188. Expect bids there if any dip happens.
Smart money loves to nudge price back into OB, shake mid-leveraged longs, then rotate upward.
Indicators:
* 9/21 EMA steepening — strong continuation behavior.
* MACD reversing from a shallow pullback, histogram turning positive.
* Stoch RSI loaded near top, but PLTR is known for grinding in overbought conditions.
* Volume printed healthy displacement candles — confidence, not exhaustion.
15-Minute Structure (Intraday Rotation)
Market Structure:
You saw BOS early, followed by a modest CHoCH reclaim. That bounce back into the 200 level and lateral consolidation is bullish digestion, not a breakdown.
We’re holding a small intraday order block below price around 198 — that’s your first buffer.
Liquidity:
There’s still clean liquidity at 204 waiting to be tapped. If the open sees a minor dip and reclaim, scalp longs become high-probability.
Indicators:
* MACD curling positive, histogram building accumulation.
* Stoch RSI cycling from reset, ready for another push.
Intraday momentum is bullish unless 197 breaks decisively.
1-Hour GEX Map (Options Sentiment & Dealer Behavior)
Gamma Walls (Call-Side Barriers):
* 205
* 207.50
* 212 zone
* 220–225 (extension targets)
Dealers hedge long gamma by pinning price between these walls if flows slow — but if net call momentum increases, it ignites upside squeezes.
Put Support:
* Heavy support at 182.50–180
* A secondary support zone at 175
Below 180, volatility would expand hard — but flow doesn’t support that path yet.
Max Pain Behavior:
Gamma map suggests upward bias with magnets sitting above current price. Dealers are not incentivized to trend PLTR downward this week.
Trade Scenarios
Bullish Setup
Condition: Hold above 197–198 on any morning pullback
Entry: Reclaim of 200.50
Targets: 204 → 207.50 → 212
Stop: 196.50
Invalidation: Full candle close below trendline (approx 188 on daily)
Notes: Liquidity grab at 198 then push is classic.
Bearish Setup (Counter-Trend Only)
Condition: Strong rejection w/ heavy selling wick at 204–207
Entry: Breakdown of 197
Targets: 193 → 188
Stop: 199.25
Invalidation: Reclaim of 200
Only take this if SPY/NQ also roll over.
What to Watch This Week
* Look for false breakouts above 204 — that wick behavior matters.
* If 200 holds as support on retest, bulls gain serious fuel.
* Liquidity above 207.50 could spark a Friday squeeze.
If bulls defend 198 with confidence, I’m leaning toward continuation into mid-premium pricing.
Closing Outlook
This week favors continuation, but PLTR may dance sideways early to burn premium. Watch volume footprint — if buyers show initiative at 200, momentum traders will pile in.
Personal Note:
If the market gives us a clean reclaim at 200.50 and volume confirms, that’s the kind of setup institutions love to run into key gamma walls. I’m watching liquidity traps around 204 — that’s where the real game is.
Disclaimer
This analysis is for educational purposes only and not financial advice. Always manage risk and trade your plan.
PALANTIR PLUS GOLD. 21 MONTHS OF ULTIMATE SHAG-ALL-BEARS SUCCESSSomewhere far far ago.. in the Faraway Kingdom, or maybe even in the Thirties Land... (in brief - "somewhere in another Galaxy"),
...in late December, 2024 (yet in era of 'altseason-2024' expectations),
..@TradingView has asked somewhat at it awesome Giveaway: Happy Holidays & Merry Christmas.
1️⃣ What was your best trade this year?
2️⃣ What is your trading goal for 2025?
Here's what we answered:
1️⃣ What was your best trade this year?
- Surely Palantir NASDAQ:PLTR 💖
2️⃣ What is your trading goal for 2025?
- Once again, surely Palantir NASDAQ:PLTR 💖
It's gone twelve months or so... (Duh..? Ahah.. 12 months really? 😸).
What's happened since that:
📌 Trump definitely failed to become 'Crypto Tsar';
📌 America failed to become 'Crypto Capital of the World',
📌 America still is not 'Great Again' (but definitely goes 'Nuclear');
📌 Crypto future does not shine bright any further (well, in this given time, over Top-200 crypto tokens nearly 75% are down now in the year 2025).
In the midst of all this crap, we have been focused all the year 2025 on two things only.
- Know what?
- For sure, they both are defensive assets. These are - Palantir and Gold.
Reducing a portfolio to just two assets Palantir and Gold is very reasonable for several strategic and performance-driven reasons.
This streamlined approach offers unique benefits based on recent returns, diversification, and macroeconomic context, especially during periods of high volatility and inflation.
Rationale for a Two-Stock Portfolio
A portfolio concentrated in Palantir and Gold capitalizes on the complementary strengths of both assets.
Palantir, as a rapidly volatility and growing tech company specializing in AI and big data analytics, provides exposure to high-growth technology, while Gold acts as a timeless stability hedge against economic uncertainty, inflation, and market stress.
The reduction to two assets simplifies management, decreases transaction costs, and focuses allocation on assets with contrasting properties, growth technology and defensive commodity.
Volatility plus Stability. Two wise words to explain it all.
Diversification benefits
Although minimal, the combination exploits Gold’s low to negative correlation with equities during turmoil. Gold typically rises in market distress, offsetting potential losses in stocks.
Focused conviction investing. Belief in Palantir’s disruptive business and the ongoing value of gold can justify concentrated exposure, especially if robust research supports the thesis.
Risk management through asset characteristics. Gold’s stability and history as a store of value counterbalance Palantir’s volatility and growth-driven risk.
Optimal drawdown protection and inflation defense. Gold historically has protected investor portfolios during crises, high inflation, and periods where traditional diversification fails.
Ultimate Recent Returns
Recent performance underscores the appeal:
Palantir: As of the end of October 2025, Palantir stock reached an all-time high of $204.16, showing a remarkable climb from a year low of $41.03, an almost fivefold increase within twelve months. Year-to-date, the stock is up over 160%, exemplifying the company’s explosive growth phase powered by surging enterprise adoption of AI.
Gold: Spot gold is trading at nearly $4020 per ounce, i.e. up by almost 47% compared to this time last year, and up 27% YTD as of July.
Gold has delivered an annualized average return of about 10.9% over the last 25 years, but its resilience during crisis years (like 2025’s inflation surge) makes it especially attractive now.
Economic Context and Defensive Logic
In the current environment, marked by inflation spikes and geopolitical risks, a two-asset allocation underscores defensive logic.
Market stress resistance. Gold provides protection when equities falter and can cushion overall volatility.
Participation in accelerating digital transformation. Palantir leverages global data partnerships and AI innovation, promising outsized returns as enterprises and governments digitize operations.
Drawdown and inflation protection. When stock-bond correlations break down—as witnessed during stagflation and recent crises, Gold’s unique properties shine, ensuring resilience.
This strategic portfolio reduction is still reasonable.
Investors with high conviction in technology and commodities.
Those seeking clarity, simplicity, and rapid decision-making.
Defending against volatility, inflation, and uncertain macro trends.
Portfolio managers less reliant on traditional broad diversification.
Summary
Portfolio restricted to Palantir and gold leverages their respective strengths
21 (Twenty One) consecutive rising months. Months of ultimate shag-all-bears success.
Try to find the same or even something similar... We bet you will not!
High-growth technology with outsized returns and defensive commodity protection.
Recent performance validates this concentrated approach, yielding stellar returns for both and a sensible hedge against future uncertainty.
--
Best wishes,
@PandorraResearch Team

$PLTR weekly close above $200 before earnings#PLTR has been on a storming run this year. As I tell students - never fight a strong trend - you just need to find a way to surf it. Nevertheless, I had become concerned the last few weeks that perhaps it was overheating; we'd gone parabolic; followed by creating a double top; which then printed bearish key reversals and rejection candles. I wasn't short (don't fight a good trend), but it was on my watch list. I thought we may drift lower into earnings. Well, I was clearly wrong in my concerns, when price blasted higher last week, and also closed about $200 the week before earnings.
Can we turn $200 in a base before a move higher?

Palantir (PLTR) Bulls Preparing for Takeoff — Setup Explained💎 PALANTIR TECHNOLOGIES INC. (PLTR) — Swing Trade Profit Playbook 💎
Exchange: NASDAQ
Style: Swing Trade | Thief Layering Strategy | Bullish Pullback Setup
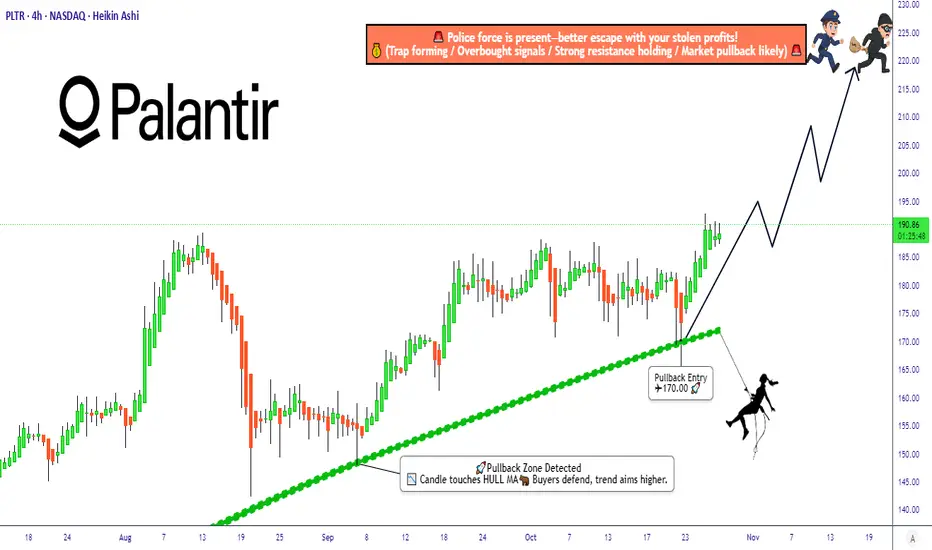
🧭 PLAN
We’re plotting a bullish pullback setup confirmed by the Hull Moving Average and a Heikin Ashi reversal doji — signaling that buyers are regaining strength and getting ready to dominate again. 💪📊
This setup thrives when the crowd is sleeping — that’s when the thief plans the perfect entry on discount zones! 🕶️💸
🎯 ENTRY STRATEGY — “THIEF LAYERING SYSTEM”
Instead of chasing green candles, this strategy stacks multiple buy limit layers to build position quietly and efficiently. Each layer grabs value from dip zones — just like a thief collecting gold coins on the way down! 🏴☠️💰
Layered Entry Plan:
🔹 1st Layer: $175 — early scout entry, feel the market reaction.
🔹 2nd Layer: $180 — main position loading zone near Hull MA support.
🔹 3rd Layer: $185 — continuation confirmation layer if trend holds.
🔹 4th Layer: $190 — momentum add-on for breakout confirmation.
👉 You can add more layers if volatility gives deeper discounts. Adjust according to your risk profile — precision is key, greed is optional! 🎯
🛑 STOP LOSS
This is the Thief SL at $165 — clean, disciplined, and below the recent structural support.
⚠️ Note to all Thief OG’s: This isn’t a fixed stop for everyone. Manage your own risk — move smart, stay stealthy. Every thief has their own escape route! 🏃♂️💨
💰 TARGET / TAKE PROFIT
Our main target is $220, where the “police force” (strong resistance) is waiting to trap late buyers. That’s our signal to escape with profits while the market gets noisy. 🚨💵
⚠️ Note: Don’t copy-paste my TP — adjust it based on your risk-reward ratio. The thief gets in, takes the bag, and disappears like smoke! 😎💨
🌐 CORRELATIONS & RELATED PAIRS TO WATCH
While executing this PLTR play, keep an eye on related movers:
💡 NYSE:AI (C3.ai): another AI data stock — often mirrors PLTR’s momentum.
⚙️ NASDAQ:NVDA (NVIDIA): strong leader in AI space; when NVDA rallies, PLTR usually follows.
📊 NASDAQ:QQQ (NASDAQ ETF): overall tech sentiment indicator — if QQQ pulls back, expect PLTR sympathy moves.
🧠 NASDAQ:META , NASDAQ:GOOG : big-data and AI-driven plays that set tone for broader sector trends.
Key Insight: When NASDAQ:QQQ or NASDAQ:NVDA show continuation strength, PLTR tends to respond aggressively due to its higher volatility factor. A synchronized move could amplify this setup’s reward potential! 💥📈
⚙️ MARKET CONTEXT
Palantir continues to benefit from the AI and defense analytics boom, showing stronger fundamentals and recurring government contracts. The chart recently cooled off, forming a healthy reaccumulation base, ideal for swing traders planning layered re-entries before the next push to $220+. ⚔️📊
🕶️ DISCLAIMER (READ BEFORE HEISTING)
This is a Thief-Style Trading Strategy — meant for fun and education.
Trade smart, manage your capital, and always protect your loot! 🧠💼
✨ “If you find value in my analysis, a 👍 and 🚀 boost is much appreciated — it helps me share more setups with the community!”
#PLTR #Palantir #SwingTrade #ThiefStrategy #StockMarket #AI #BullishSetup #TechnicalAnalysis #HullMA #HeikinAshi #RiskManagement #NASDAQ #ProfitPlaybook
Palantir (NASDAQ: $PLTR) Set For Breakout Amidst Earnings ReportPalantir (NASDAQ: NASDAQ:PLTR ) is set for a bullish spike as earnings reports are slated for tomorrow November 3rd, 2025. With the last trading session ending with NASDAQ:PLTR up 5.93% investors are keen on driving the share price to $250 amidst a positive earnings bead.
Adding to the bullish sentiment, the RSI is at 60, implying that NASDAQ:PLTR is well validated for a bullish move tomorrow before or after earnings beat.
On a different note, should the asset fail to report a favourable news, the 38.2% Fib level is well articulated for a support zone for $PLTR.
About Palantir
Palantir Technologies Inc. builds and deploys software platforms for the intelligence community to assist in counterterrorism investigations and operations in the United States, the United Kingdom, and internationally. It provides Palantir Gotham, a software platform, which enables users to identify patterns hidden deep within datasets, ranging from signals intelligence sources to reports from confidential informants, as well as facilitates the hand-off between analysts and operational users.
