Opening (IRA): SMH September 19th 260 Covered Call... for a 253.21 debit.
Comments: One of the higher IV ETF's at the top of my board. Selling the -75 delta call against shares to emulate the delta metrics of a 25 delta short put, but with the built-in defense of the short call.
Metrics:
Break Even/Buying Power Effect: 253.21
Max Profit: 6.79 ($679)
ROC at Max: 2.68%
50% Max: 3.39 ($339)
ROC at 50% Max: 1.34%
SMHC trade ideas

SMH - Predicting an NVDA fail?An apparent Head and Shoulders topping formation along with a potential Elliott Wave B wave top makes shorting/put buying of SMH a viable way to play an NVDA earnings disappointment.
Think the chips and other market segments are in gross need of a breather.

SMH Bullish Setup – Breakout Plan for the Perfect Heist!🔥🚀 THIEF TRADER ALERT: SMH BULLISH HEIST PLAN! 🚀🔥
Asset: VANECK SEMICONDUCTOR ETF (SMH)
Plan: BULLISH BREAKOUT HEIST 🎯 (Resistance wall breakout candle close above 298.00)
🎯 THIEF ENTRY STRATEGY (LAYERING METHOD) 🎯
"Steal the dip like a PRO!" 💰🔪
Multiple Limit Orders (Layer Entry) 👇
1st Layer: 298.00 (Breakout Confirmation)
2nd Layer: 292.00 (Pullback Steal)
3rd Layer: 288.00 (Aggressive Discount)
4th Layer: 284.00 (Max Pain = Max Gain)
(Add more layers if you’re a risk-loving THIEF!)
⚠️ WARNING: DO NOT place SL or orders before breakout! (Only real THIEFS wait for confirmation!)
🛑 THIEF STOP LOSS (OG STYLE) 🛑
"Protect your loot or get wrecked!" 💣
SL @ 280.00 (Hard floor – adjust based on your risk appetite!)
Place SL ONLY AFTER breakout! (No premature stops – patience = profit!)
🎯 TARGET: 324.00 🚀 (OR ESCAPE EARLY IF MARKET TURNS)
Scalpers: Ride the waves, but stay LONG ONLY! 🌊
Swing Thieves: Hold & rob big! Use Trailing SL to lock gains! 🔐💰
📢 THIEF PRO TIPS:
✅ Set Alerts! (Don’t miss the breakout!) 🔔
✅ Watch for News! (Avoid getting caught in volatility traps!) 📉📈
✅ Boost & Support! (More boosts = more heists!) 💖🚀
🔥 FINAL MESSAGE:
"The market is a casino, and WE are the robbers! 🎰💰 Steal smart, escape rich! 🏴☠️💸"
👉 LIKE, BOOST & FOLLOW FOR MORE HEIST PLANS! 👈
🚀 NEXT HEIST COMING SOON… STAY TUNED! 🚀
#ThiefTrader #SMH #BreakoutHeist #LayerEntry #LimitOrderBandit 🎯🔥

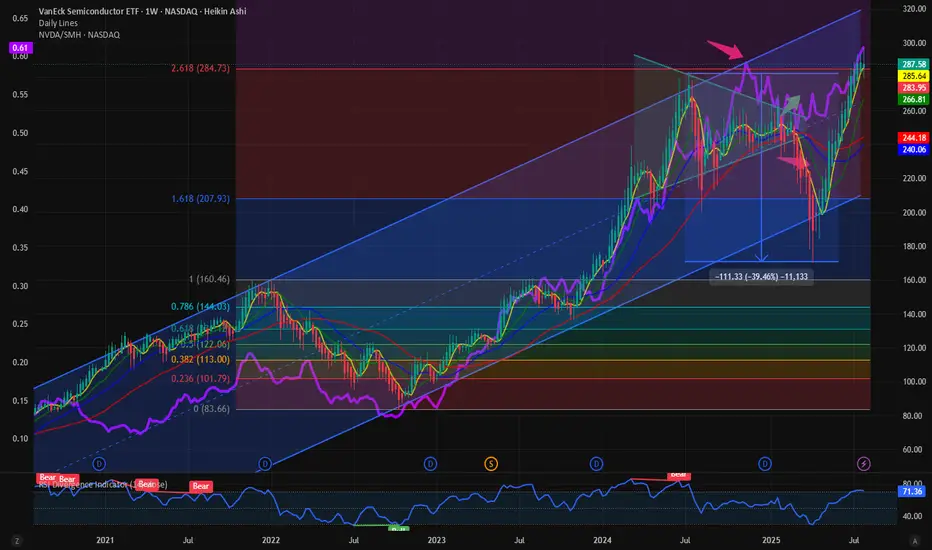
$NVDA Dominance to 65%: Trajectory is right path might be bumpy.First, I have to say its good to be back among friends after a summer break. A lot has happened in the meantime. In the TradFi and Crypto Markets stuffs are making ATH, and we are in a full-fledged bull market which is third year in the making. History is in favor of us. So, let’s look at the stuffs making new highs and the relative performance. Because relative performance tells us a lot about the over or underperformance, we love to look at CRYPTOCAP:BTC dominance and similarly in the TradFi space we investigate NASDAQ:NVDA Dominance a term we coined here.
My favorite is to look at the NASDAQ:NVDA / NASDAQ:SMH i.e. what percentage of NASDAQ:SMH is represented by $NVDA. We predicated in this space that NASDAQ:NVDA Dominance will touch 65% and NASDAQ:NVDA will first touch 170$.
NASDAQ:SMH and NASDAQ:NVDA Dominance: Some more room to run for both for NASDAQ:SMH by RabishankarBiswal — TradingView
We have blown past our July end target in NASDAQ:NVDA , hence our year end target of 240$ looks achievable. The price target in NASDAQ:SMH of 315 looks more achievable than before. But will this be a straight-line form here. My expectation is that with NASDAQ:SMH @2.61 Fib retracement level with price @ 285 it will go through temporary consolidation before it can resume its upward trajectory with NASDAQ:NVDA doing the heavy lifting. The next catalyst is NASDAQ:NVDA earning on Aug 28.
Verdict: NASDAQ:SMH might go through consolidation here. Year-end targets remain intact: NASDAQ:SMH @ 315 $ and NASDAQ:NVDA @ 240 $ with NASDAQ:NVDA Dominance @ 65%.
Bearish DivergencesWe could be running out of steam here. This to me looks like the final leg of the grand supercycle in semis. Bearish divergences on the RSI and a final 5th wave move up. If we reach $300 I’d expect a rejection and possible roll over. Keep an eye on this, retail are loading up but the charts don’t support the hysteria at these levels.
Not financial advice

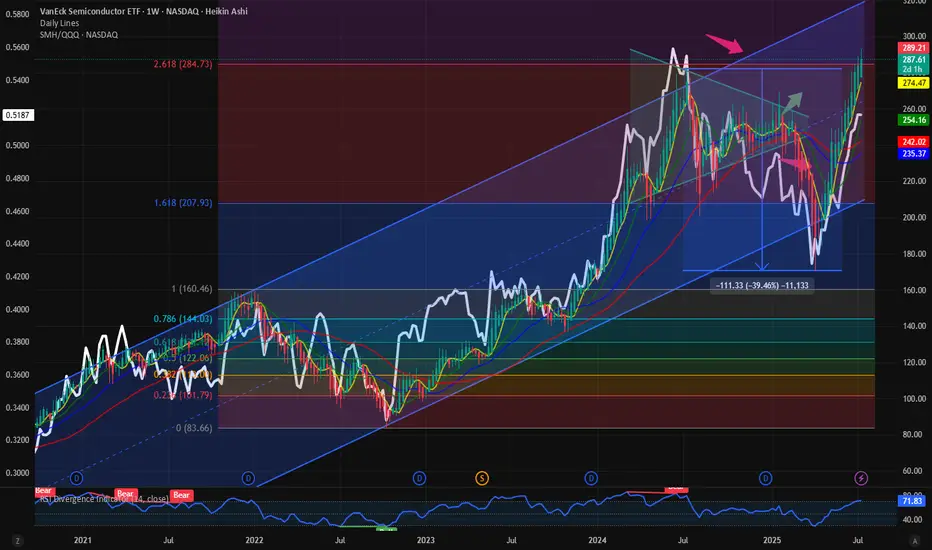
$SMH / $QQQ: Ratio below ATH; Still more room for upside It’s the semis which are the hallmark of a cyclical bull market. It is always the Semis which indicate the start of a bull market and the first to fold over towards the end of a cyclical bull market. Hence the outperformance of Semis as a momentum sector is important from a symbolism perspective and from a market indicator perspective.
When the semis outperform the NASDAQ100 we have momentous bull markets. Today we looked at the ratio chart between NASDAQ:SMH vs $QQQ. This measures the relative outperformance or the underperformance of Semis over the broader NASDAQ100.
This ratio of NASDAQ:SMH / NASDAQ:QQQ touched its ATH on June 2024. Since then, the Semis lost momentum with NASDAQ:NVDA and NASDAQ:AVGO going sideways for a year. Now the momentum is on the side of Semis. Even if the NASDAQ:SMH is at 287 $ and at ATH with price is at its 2.618 Fib Retracement level, still the NASDAQ:SMH / NASDAQ:QQQ is not at its ATH. The ratio is currently @ 0.5. Before we hit 0.56 in the ratio chart just like last June 2024, SMH must outperform the NASDAQ100. If that must happen what should be the price of NASDAQ:SMH ? My prediction is the ratio NASDAQ:SMH / NASDAQ:QQQ tops @ 0.56 and NASDAQ:SMH goes to 400$ this year.
Verdict: Long NASDAQ:SMH over $QQQ. NASDAQ:SMH / NASDAQ:QQQ tops 0.56. NASDAQ:SMH price target 400$.
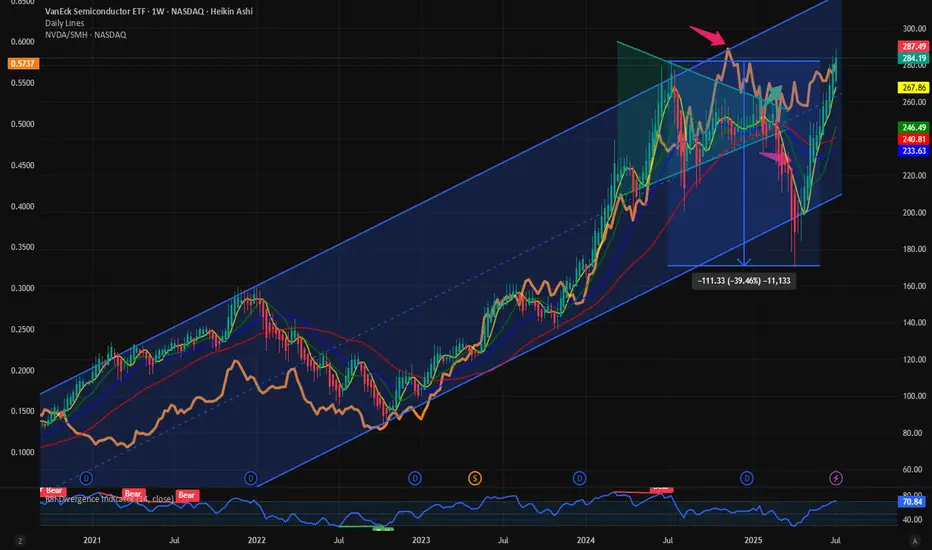
$SMH and $NVDA Dominance: Some more room to run for bothWith NASDAQ:NVDA and NASDAQ:SMH above their respective ATH the focus returns to the fact how far we can expect for both to outperform and make new highs. In this Blog we floated the idea of NASDAQ:NVDA dominance. This indicates the % of return / price movement in NASDAQ:SMH contributed by NASDAQ:NVDA as it is a cap weighted index. It captures the outperformance of the high momentum stocks like NASDAQ:NVDA and $AVGO.
On May 12 I predicated that NASDAQ:NVDA will reach 170$ before end of summer. And we are very close to our price target.
NASDAQ:NVDA : Full on Bull mode. 170 $ before end of Summer for NASDAQ:NVDA by RabishankarBiswal — TradingView
On May 30 we also favoured NASDAQ:SMH over AMEX:HACK and said that the momentum will continue and NASDAQ:SMH will touch new ATH. And here we are with NASDAQ:SMH above 280$.
NASDAQ:SMH vs AMEX:HACK : Recent good correlation with breakout potential for AMEX:HACK by RabishankarBiswal — TradingView
Now the question comes , how far these 2 can go and the bigger question is will NASDAQ:NVDA claim its Dominance in NASDAQ:SMH ? As you can see in the chart below the NASDAQ:NVDA Dominace in NASDAQ:SMH peaked at 0.6 or 60% on Nov 11. Currently we are @ 57% and still below its ATH. My estimate is NASDAQ:NVDA will claim its Dominance and go to the highs of 65% before SMH also completes it highs in this upward slopping channel with 315$ as my price target on $SMH.
Verdict: NVDA Dominance in NASDAQ:SMH can reach 65%. NASDAQ:SMH Target 315 $. NVDA Price target remains 170$ and above.
Semis ready to rip to price discoveryAMEX:SOXL NASDAQ:SMH
Semiconductors just waiting for the tarrif announcements to pass to blast off to all time highs

Opening (IRA): SMH August 15th 215 Short Put... for a 2.50 credit.
Comments: A starter position in the semiconductor ETF on a smidge of weakness here, targeting the strike paying around 1% of the strike price in credit.
Will generally look to add at intervals if I can get it at a strike better than what I currently have on.

Semiconductors into MAJOR resistanceAs you can see from this weekly chart, the semiconductors have tried three different times to get above this trend line and have gotten rejected all three times. Could it go higher from here? Of course it could, but you have to ask yourself what are the probabilities that it will continue to go up through all this heavy resistance? Not very good is the answer. A close above last weeks candle would confirm a breakout, otherwise, bearish view remains intact.

SMH BREAKOUT: Semiconductor ETF Explodes Higher After 13-Month VanEck Semiconductor ETF (SMH) - 1Y Chart Analysis
THE SETUP:
After 13 months of sideways chop between $180-$240, SMH has finally broken out with real conviction. This lengthy accumulation phase built a massive foundation for what could be the next major leg higher.
KEY LEVELS:
Breakout Level: $240 (now critical support)
Current Price: $261.59 (+1.79%)
Next Target: $300 (major psychological level)
Stop Loss: Below $240 breakout
WHAT HAPPENED:
Semis have been coiling throughout 2024, basically going nowhere while digesting the previous run. The break above $240 on solid volume tells me buyers are finally stepping in with size.
MY TAKE:
This looks like the real deal. 13 months is a long time to build a base, and when these sector ETFs finally break out of extended ranges, they tend to move fast. $300 is the obvious target - round numbers always matter in this game.
TRADE SETUP:
Long SMH with targets at $280 and $300. Stop below $240. The risk/reward here looks solid for swing traders who can handle the volatility.
Anyone else playing this breakout or waiting for a pullback? The semiconductor space has been dead money for over a year, so this could be the start of something bigger.
This is not financial advice. Trade at your own risk and size accordingly.

Opening (IRA): SMH July 18th 195 Short Put... for a 2.23 credit.
Comments: Adding at a strike better than what I currently have on at the 205 ... .

SMH Long Swing Setup – Buy the Dip or Overbought Trap? (2025-06-📈 SMH Long Swing Setup – Buy the Dip or Overbought Trap? (2025-06-12)
Ticker: NASDAQ:SMH | Strategy: 🟢 Equity Long Swing
Bias: Bullish with caution | Confidence: 70%
Hold Period: 3–4 weeks | Entry Timing: Market Open
🔍 Technical & Sentiment Snapshot
• Trend (Daily/Weekly): Strongly Bullish
• Short-Term (30m): Mixed – price above 50/200 EMAs, but below 10-EMA, MACD cooling
• RSI: Overbought (~77), suggests caution
• Bollinger Bands: Price hugging upper band
• MACD Daily: Mild bearish crossover – signals a potential short-term pullback
• Support Levels: 260–261 zone
• Sentiment: Falling VIX, Intel-led chip sector strength → bullish backdrop
🧠 AI Model Consensus
✅ DS, LM, GK (3 Models):
• Recommend long trade at open
• Confidence: ~70–72%
• Target range: $269–276
• Stop zone: ~$255–259
⚠️ GM Report:
• Suggests waiting – daily overbought + bearish MACD → not favorable R:R
• Recommends no immediate entry
✅ Recommended Trade Plan
🎯 Direction: LONG (Buy Shares)
💵 Entry Price: 262.85
📅 Hold Period: 3–4 weeks
🎯 Take Profit: 269.66 (+2.6%)
🛑 Stop Loss: 259.50 (–1.3%)
📏 Size: 100 shares (adjust to your risk profile)
📈 Confidence: 70%
⏰ Entry Timing: Market Open
📍 Entry Validity: Only if SMH opens at/above 262.50 and holds support (~260–261)
⚠️ Risk Factors
• 😬 Overbought RSI may cause short-term profit-taking
• 📉 Bearish MACD crossover could lead to near-term consolidation
• 🧨 Negative market surprise could invalidate long setup
• 🧮 Risk only 1–2% of your portfolio on this trade
💡 SMH bulls stay in control—but for how long?
🗣️ Are you going long, waiting for a pullback, or shorting the top? Drop your plan below 👇
📲 Follow for daily AI-generated trade signals & edge-backed setups.

SMH/SPY | Bullish Breakout | Tech Rotation | (June 8, 2025)SMH/SPY | Bullish Breakout | Tech Rotation Signal | (June 8, 2025)
1️⃣ Insight Summary:
The SMH (Semiconductor ETF) vs. SPY (S&P 500 ETF) ratio is breaking out of a key parallel channel, signaling strong capital rotation into semiconductors. This often precedes broader tech strength — and it’s happening now.
2️⃣ Trade Parameters (Indicator View):
Bias: Bullish for SMH (and leading semis like NVDA, AVGO, TSM, AMD)
Entry Zone: Current breakout level on SMH/SPY ratio
TP1 (First Take Profit Area): Watch for continuation upside in SMH outperforming SPY
❌ No Stop Loss: This is a market strength indicator, not a direct trade setup
3️⃣ Key Notes:
✅ Breakout Context: The breakout from the parallel channel suggests relative strength in semiconductors. Historically, this precedes runs in NVDA, Broadcom, and TSM — all major SMH components.
📈 Macro Implication: When SMH outperforms SPY, it typically means one of two things is happening:
— Semiconductors are gaining strength (bullish for tech)
— The S&P 500 is weakening (capital flows into more resilient sectors)
Either way, semis benefit.
🧠 Investor Psychology: With market volatility rising (VIX 37+), investors often move into tech leaders, gold, USD, and now even BTC. SMH is a top contender in this rotation.
❌ Invalidation: If the SMH/SPY ratio falls back inside the channel, it would invalidate the breakout thesis — a sign to stay cautious.
4️⃣ Follow-Up:
I'll continue monitoring this indicator — it’s not a direct trade but a macro signal for strength in leading tech names. If it holds above the channel, the upside potential remains strong.
Please LIKE 👍, FOLLOW ✅, SHARE 🙌 and COMMENT ✍ if you enjoy this idea! Also share your ideas and charts in the comments section below! This is best way to keep it relevant, support us, keep the content here free and allow the idea to reach as many people as possible.
Disclaimer: This is not financial advice. Always conduct your own research. This content may include enhancements made using AI.

SMH 3 (Semicond.)Dashboard of Semiconductor sector index and main assets of the US stock market sector. Leading indicators for swing strategy.

SMH 2 (Semicond.)Dashboard of Semiconductor sector index and main assets of the US stock market sector. Leading indicators for swing strategy.
SMH 1 (Semicond.)Dashboard of Semiconductor sector index and main assets of the US stock market sector. Leading indicators for swing strategy.

SMH watch $212.82 above 209.43 below: Proven zone to form Trend SMH showing the recovery process of the chip sector.
Now testing a well proven zone defined by major fibs.
Golden Genesis fib at $209.43 and Covid fib at $212.82.
Look for a Break-and-Retest a Rejection.
If rejected, look for support at $191.23/85
===================================================
.

Opening (IRA): SMH July 18th 205 Short Put... for a 2.21 credit.
Comments: Doing some higher IV premium-selling in the ETF space, targeting the <16 delta strike paying around 1% of the strike price in credit.
Will look to add at intervals if I can get in at strikes better than what I currently have on ... .

Semiconductors ready for the next leg up - Zoom out !!!#FACTS
-Breakout in SMH was 11 years back around 2014 and uptrend started
-Last 10 years SMH just cannot be under the 200WSMA for long time
-Since 2015 the bottom is at 0.5 fib retrace & takes 9 months + atleast 25% Pullback
What are other confirming signals
-SOXL 3x leveraged etf just had 2 days of Highest Volumes ever ! (leveraged funds arent good for charting but volume is a wake up slap in the face !)
Last time that volume on soxl was 2020 bottom 2022 bottom so 2025 bottom ? MAYBE ?
Got in AMEX:SOXL at $9-$10, once confirmed I will scale in for a swing

Inverse Head-and-Shoulders FormingI see SPY, QQQ, & SMH forming inverse H&S pattern on the 4 hour chart. The Inverse Head and Shoulders pattern has a higher success rate than the regular Head and Shoulders pattern, with a success/failure ratio of 68.2% compared to 59% for the Head and Shoulders. In 98% of cases, the pattern exits upwards. Additionally, in 74% of cases, the price reaches the pattern's objective once the neckline is broken.

SMH correction areaThe SMH likes to check up on the 50 month moving average every 2.5 years or so. It has gone 20 bars since it's last check, so i would expect a test within the next year to 16 months.

CHIP SECTOR TO CRASH SMH The chart posted is the SMH we are now in the final 5th wave and it is a classic 5th wave Diagonal in the 5th wave wave to form a double top into fib cycle peak .From here we should see a major break down in All chip stocks into Oct 2025 but we should see the first leg down low march 10/20th 2025 this should be a Very Bearish action world wide see spy and qqq as well . This is the warning to All traders EXIT INTO RALLIES THE BEST OF TRADES WAVETIMER
