$TMUS WeeklyLooks like a good entry for a long here as an idea on TMUS weekly. Over sold, at a good support zone, with 150EMA below for stop loss target.
ER this week wouldn't be surprised if it sparks a pivot point here to at least get a bounce similar to Nike's (NKE) recent price action.
I'm in DEC and JAN $120C
Price target at least $130 for a head and shoulders pattern/relief bounce , or extreme bull case - continuation of the longer term uptrend to all time highs.
Trade ideas
Tmobile post earnings Severely oversold on the weekly RSI and MFI.
breaking out from under wedge (Whiteline) and forming a double bottom that I think could carry TMUS back to 129. But first it needs to crack 123.30 fib resistance


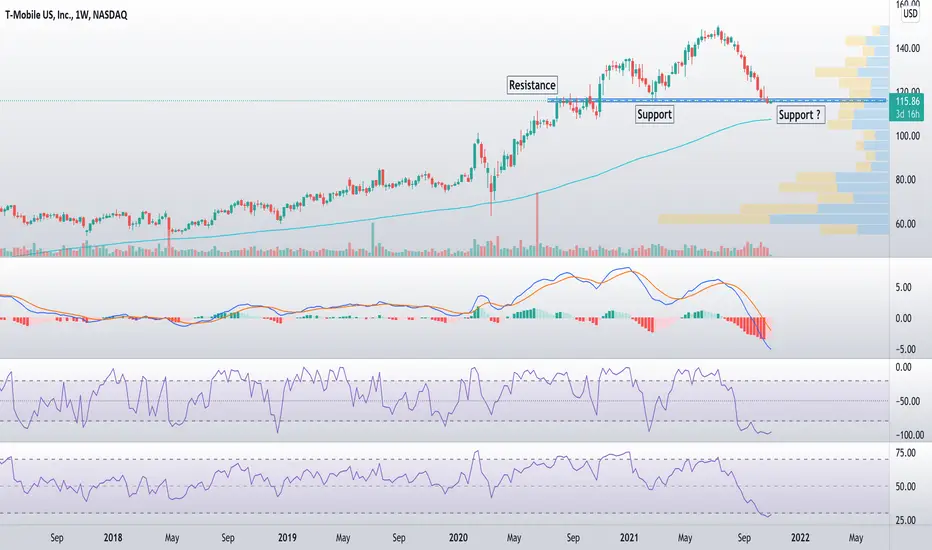
TMUS - wekly chartWeekly analysis, meaning that this analysis concerns the medium-term investor
Important weekly support at 115.89, if prices close below it as a weekly close, the cup and handle pattern is confirmed
The target becomes 81.50, with a drop of 30.00%.
Stop losses if it closes weekly above 122.66, with a loss of 5.75%

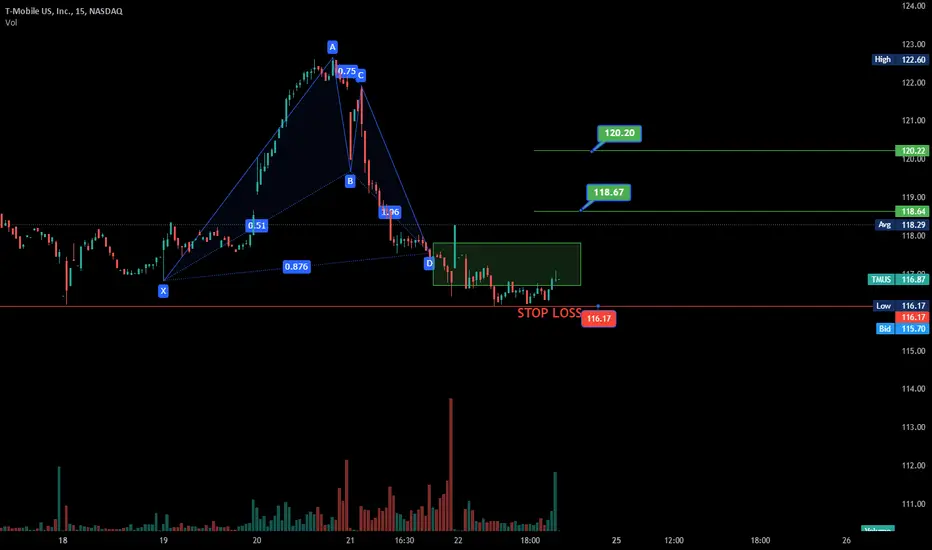
TMUS READY TO RUN PT1 118 PT2 120NASDAQ:TMUS
TMUS READY TO RUN PT1 118 PT2 120. No more then next week we may see it run very close to stop loss.
Trading plan: T-MobileThis thing gapped up one year ago, finally comes back down 190 bars (1D) later for a pullback.
Chart Setup:
- Timeframe: Daily
- Backtested using this strategy to scan for reversals (could be false, but decent win-rates to convince that it could be sometimes be true)
- Using price gaps to identify trends, then using volume profile - fixed range (VPFR). to map out areas of support/resistance
Observations:
-137-150 range was fake, not enough volume to support it, POC (red line) remained at 130 throughout the VPFR period
- couldn't break out of 130 on Sept 22
- drew another VPFR, this time from Q1 of FY2020 extending up to today, noticed that 103-115 is an area of value, good supports here.
- 12 month targets average out 170, a whopping 30% difference below target (much lower than Verizon's current price relative to its own average target)
Bias: Long.
Disclaimer: not an investment advice

Technical analysis (TMUS)Limit buy - 118,90$
Target - 130,80
Risk/Reward Ratio - 3,9
Stop-loss - 115,85

Pull Back FishingPossible Double Bottom.
TMUS has pulled back a lot since it's high of 150.20. Negative moving average crossovers noted including the 50 crossing down through the 200 which is known as a death cross. I have noticed when a security is at the bottom, moving averages look awful as a rule and they are lagging indicators, but something to be aware of. Price is the here and now. Many will not trade a stock that is under it's 50 SMA and some will not trade a security under the 200 SMA and that is a good idea. As a rule the security is in a nice uptrend when all of the moving averages are in order with the smallest on top and all sloping up with positive crossovers. You just will not find many at the bottom with sparkling moving averages. The 200 is still gently sloping up, indicating long term this is still okay.
Price fell outside the bottom band on 80 after multiple groups of RED candles. Red candles are bearish of course, but flushing sellers out can be bullish in the end as the sellers diminish and buyers come in. When the last frightened seller liquidates, things sometimes turn around.
And the bottom is not always the bottom )o: It can be even harder to trade deep pull backs and bottoms than it is to trade tops. A security may seem dirt cheap at the levels you see, but even dirt can get cheaper so trading down here can be hazardous to your mental health and is not for the faint of heart. I suppose in the scheme of things, any trade can turn against you.
Possible stop under lower bottom, 115.89. There is a pocket pivot under this first bottom.
No recommendation.
Negative volume is high. Short interest is 2.48%.

Playing the easy bounce on TMUSTMUS is waaay to cheap at this point. The market is a wreck but this one should be an easy swing of the double bottom. Playin $118 call option expiring 10/22.

TMUS - T Mobile US Can be little more SHORTs ?
Looks like the is no support on side of T Mobile . What are you thinking , TMUS can be reanimated ?
I will try to short it, with a small distance of "Stop Loss"

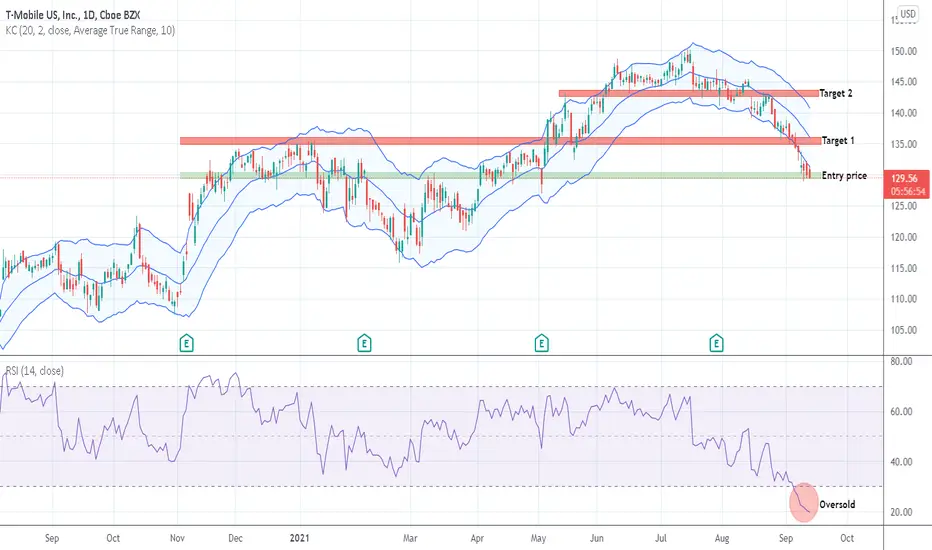
TMUS longEntry price: 129-131$
Target 1: 135-137$
Target 2: 142-144$
RSI: the asset is oversold, therefore pullback might occur in the near future.
Keltner Channel: The price under the lower band.
Conclusions: RSI and Keltner Channel suggest the bullish momentum of the asset, moreover, the price oscillates on the support level. Therefore the long position is recommended in that support zone.
Above information should be treated as informational/educational advice, no financial advice.
T-Mobile - 5G Hopium - NOMO FOMO - Ponzi Pogs CollapseRising rates in works. This Ponzi Pog been poggin forever. Gonna get whacked. Small caps win.

T-Mobile - 5G Hopium - NOMO FOMO - Ponzi Pogs CollapseThe 5G trade is overplayed. *valuation matters
Wait for it.
Large cap STONKS & Crypto Ponzi Pogs collapse with rising rates environment.
#holdforbroke

TMUS BIAS: UPThe price is struggling around the resistance area, we are seeing a break soon but if the price didnt make it, we may not hold the trade. Make sure to apply SL and TP for your trade.

$TMUS BREAKOUT?!I am already in this trade from the breakout on Friday. It look;s like $TMUS wants to give us a run for our money.

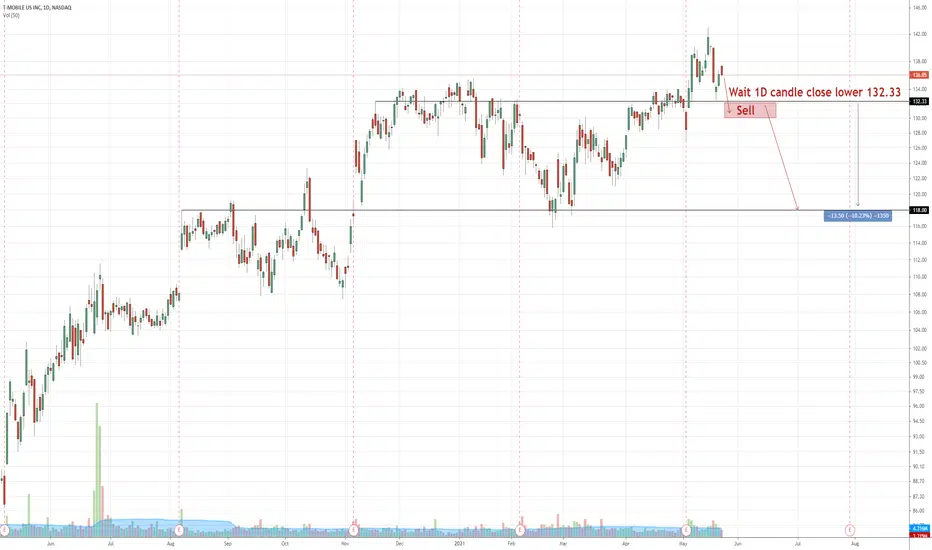
TMUS Correction Incoming I like TMUS as a stock but in the short to mid term I have a bearish view. Could be a good put opportunity but with the market as it is every play has some element of risk. In a consolidation phase and may have another break up but more likely to decrease in value. A dip below the 200MA would add further support for a downtrend.

TMobileThese are levels that I'll be keeping an eye on when dealing with $TMUS, and I'll revise as price action progresses.
I adapt to the change in money flow.

4/26 TMUS(1) Support 127, 120-115
(2) It is stable running on the chart, and turns into a cup and handle pattern possibly, with expected handle incoming
(3) there is a yellow gap below and I would consider that as the entry zone instead of chasing at current price.

BUY T-MobileAfter a wave 2 T-mobile looks good for a run. Down trend break out adds to the confluence. Watch for dip to cool off Stochastic for a continued push. 2H timeframe makes a little more volatile. Watch your entries.

Wait for breakoutEven though $TMUS is still overall in the down trend. However, we see it formed a bull flag now. The safest entry point might be waiting for a breakout.
For self education use only. Not financial advice.

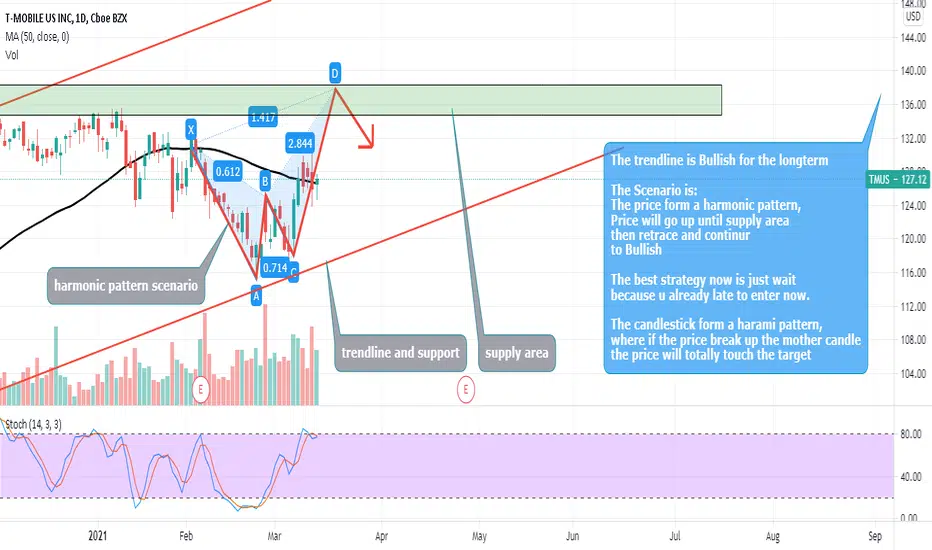
TMUS (NASDAQ) - Harmonic PatternGreetings
Humbled, we would like to thanks for your support who has already liked, commented and followed us. Your support, strengthens us, to help in analyzing the market. If you have any questions, feel free to send us message (inbox).
Pra Trading :
- Please care for Money Management
- Have a good psychology
- Do not be hurry to open position and do not do nothing if u see opportunity
- Evaluate and upgrade your trading plan
Execution Strategy :
- Know what you want to buy, see the Fundamental
- Decide that you are on investing or speculating
- Consider what your strategy based on Investing/Speculating
- Make Road Map Of Your Trading Plan
- Decide
a. Entry strategy
b. Cut loss
c. Target of Profit
Post Trading :
a. Do not be sad if you loss or do not be very happy if you win
b. Just become a normal without emotion, Do not put emotion into your trading
c. Evaluate your trading
d. Keep on Learning
e. Be Humble
Idea :
TMUS (NASDAQ) - Harmonic Pattern
$TMUS - strongmultiple scanners like this and there are call options being gobbled up
I come from the industry so I am naturally skeptical, but T-mobile is releasing some pretty cool stuff soon and their marketing cannot be missed over the past couple of weeks
