The downfall of Wells Fargo?FUNDAMENTALLY: BAD SITUATION ALREADY - HOW MUCH WORSE CAN IT GET?
Poor business and regulatory practices are being investigated at WFC. This bodes negatively for the bank, as there is already an admittance of wrongdoing. Such situations have taken a while to sort out in the past (see GS, Citi, DB, BNP, etc.) and have resulted in substantial settlement amounts. The current situation with Deutsche Bank adds fuel to the fire.
WEEKLY CHART REFLECTING POOR FUNDAMENTALS.
The technical situation on the weekly chart looks quite poor: Negative wedge formation since July 2015, death cross in April 2016, downtrend broken this week, volume pickup on the downside, negative MACD cross-over, etc.
FLOW SITUATION ALSO DIFFICULT.
Warren Buffet, who already owns 10% of the bank through Berkshire, cannot buy more stock. He is bound to keep his investment and be unhappy with it or sell his stake... Not very encouraging from the perspective of institutional share-holding at WFC.
WHAT TO DO FROM HERE?
Go short at the current market price.
Price target $40/share.
Stop-loss at $46.
Reward/Risk = c. 2.7x
Trade ideas

A possible WFC rebirth means to- BUYI am in no way certain here, but considering WFC's recent...mishaps... the corporation screams "go long!!" to me... I see equity in rebirth so to speak.
I drew in some general support (S1, S2, S3) at 47.10, 45.33, and lastly at 43.56. My S1 level was smashed through on Sep. 13... S2 held up for a bit, but was broken through on Sep. 26... S3 acted as a strong floor for the price, and created a clean reversal at a price of 43.56.. Price went bullish, and fell to form another reversal upon the price point of a higher low. (44.46) I believe price will continue the second bull run off of the higher low, and eventually hit a higher high, or at least an "even high"
I'm calling this one long.
My target is 45.50.


Wells Fargo - At crossroadsI believe that sometimes an instrument will go up if it will go above a level or vice versa. I believe that sometimes trading is that simple. Of course this strategy is affected by false breakouts, but at the end of the year, a trader applying this strategy should come out ahead.
Wells Fargo is currently standing at this type of level. It is the base of a massive weekly H&S pattern and a big daily triple bottom.
On the weekly chart, the volume indicators point to climactic volume, which makes me believe that all the selling has been done. A push up from the daily triple bottom will create a great weekly bullish divergence.
On the daily chart, a false break and a strong reversal yesterday.
As for targets, if I am right on the medium term, this stock should reach 49$. That is where I want to take some off the table. The rest of my position will be held for a longer time (unless stopped out) because if this massive H&S is not going to break, the uptrend will continue, and we shall see at least 60$.


FAREWELL TO WELLS FARGOBlack line a Temporary bounce after hitting the black line but most aggressive manipulators can hold for the below line for max profit.
There will be a strong bounce once hits this Red support line but once broke it will go down to $4 or below. Take out profit and go short after few weeks.
===============================
At least this is the start of the another financial crisis which well may come after election or post summer 2017. All the financials banks will start to collapse.


Ascending triangle in WFObserving this ascending triangle, I would wait to see if the stock price brake up, to buy a long position. If the price comes again to the triangle area, the pattern would have failed.


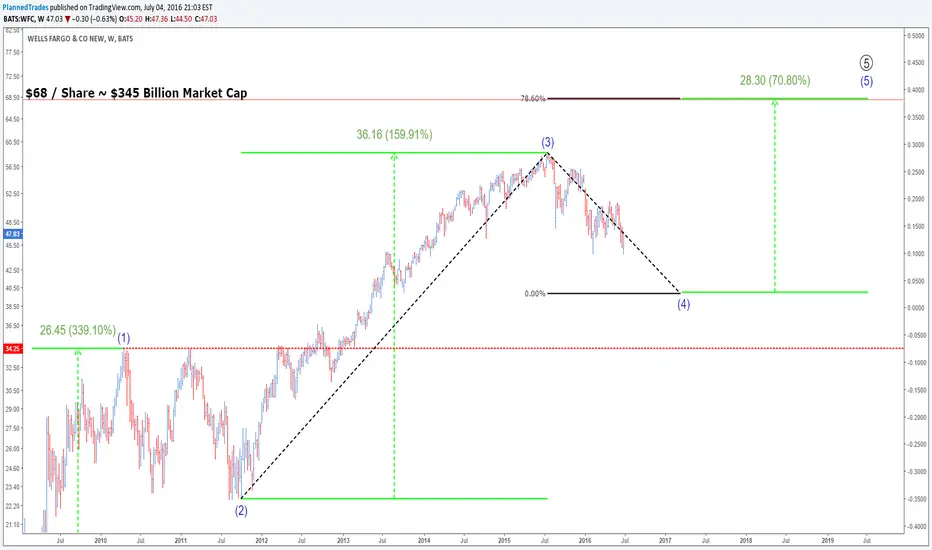
Revised Target: $68 / share...otherwise wave 3 would be the shortest. Still bullish, but I guess the raising of interest rates in the future will peak WFC around $70. Buy pullback if it hits $40.
Bullish Impact on FinancialsPerhaps this is the best bank stock chart in the S&P 500. I don't think GS or JPM are as clean, but I'll post some counts for them as well.


WFC and other Financials Looking Grim WFC has been unable to gain 50.5-51 resistance for months now, and the chart may indicate that it is time to retest lower. the last weekly level retest was 44.59, which bounced strongly and reversed. if 46.6 is lost, we should look towards 43.2 for next support test.
Lower still is 41.65 and 38.03 as well as others, but these levels may not apply for some time

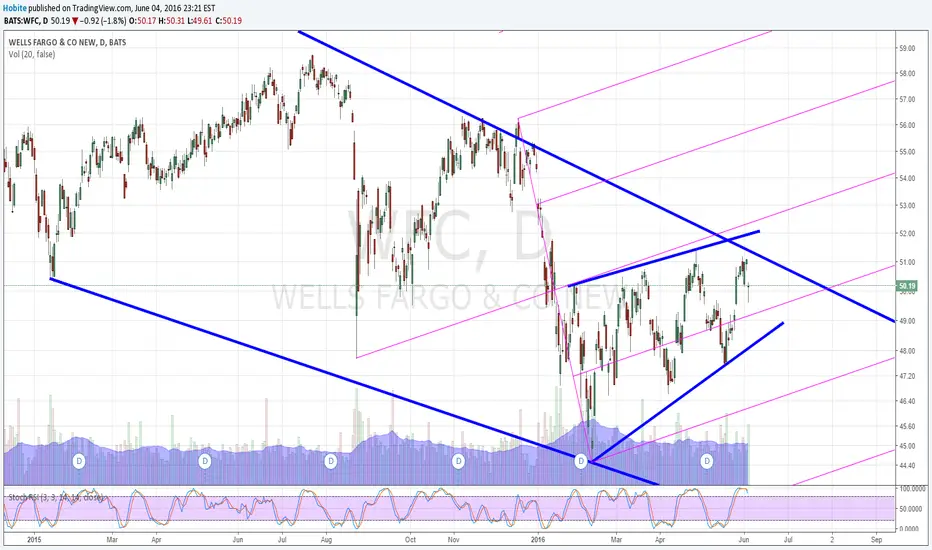


Wells Fargo: Chart showing possible continuation of Bull trendThis is a long term set up, that will most likely take sometime to confirm. Price has made a double bottom at the 200 weekly period moving average. In addition we are forming a falling wedge. The size of the wedge suggests that if it does break it could be a significant move to the up-side.
The candle of the week 02-08 tested the highs made in 2008 as support, an additional strong bullish sign.
We can also see that buying volume has picked up in the past week. Will be monitoring this stock for a breakout.
