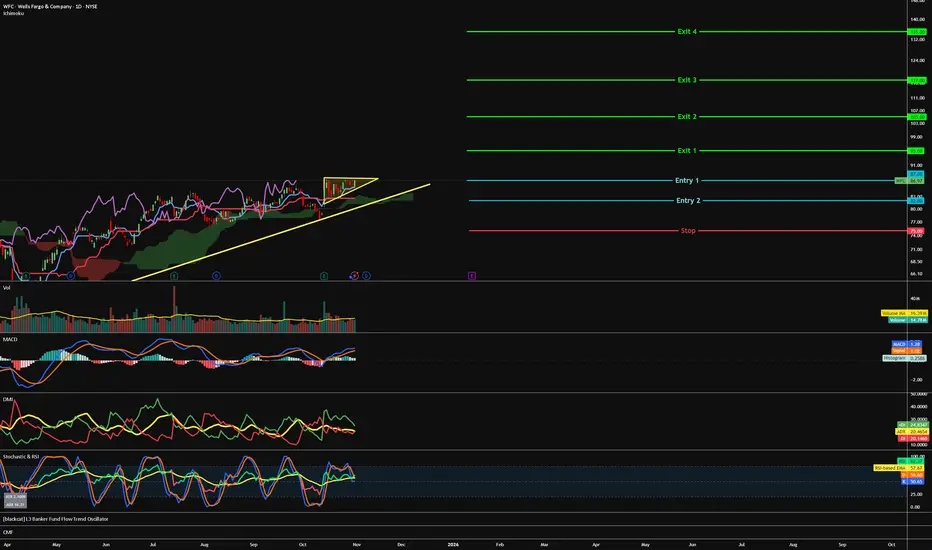
WFC - Ascending to the top=======
Volume
=======
- Neutral
==========
Price Action
==========
- Ascending triangle
- Supported on uptrend line
=================
Technical Indicators
=================
- Ichimoku
>>> price above cloud
>>> Green kumo expanding
>>> Tenken - Above clouds & Lagging & pointing up
>>> Chiku - Above clouds & flat
>>> Kijun - Above clouds & above Conv + Lagging, pointing up
=========
Oscillators
=========
- MACD still bullish
- DMI still bullish
- StochRSI, bullish, approaching overbought
=========
Conclusion
=========
- Ichimoku overall >>> Bullish
- Oscillators overall >>> Bullish
- short to long term breakout swing
- price may reverse at current level, to enter spot or wait for pullback at entry 2.
- Entry and exits depends on your time horizon and risk management.
=========
Positions
=========
Entry 1 - $87
Entry 2 - $82
Stop - $75
Exit 1 - $95
Exit 2 - $105
Exit 3 - $117
Exit 4 - $135
Trade ideas
US banks on shaky ground Macro conditions are turning hostile. The commercial real estate market, especially office, is structurally impaired in certain segments. Vacancy rates in major US metros are above 20%. Office prices are down 30–40% from their 2022 peaks. With over $1.2 trillion in CRE debt maturing by 2027, refinancing risk is climbing, fast.
Wells Fargo is sitting in the crosshairs. Its latest earnings showed net interest income down 13% year-on-year. Revenue fell 6%. The top line is weakening just as credit risk is rising. Commercial loan charge-offs surged to $923 million in 2023, up from just $152 million the year before. That’s a sixfold increase.
Of that, the bulk came from office-related exposure. The bank has set aside more reserves, but at year-end 2023, its allowance for credit losses on commercial real estate was $1.9 billion, just 2.6% of its $72 billion CRE book. That ratio looks optimistic.
Wells Fargo’s total book value of equity stands at around $170 billion. If CRE losses reach 5–7% of the commercial book, well within historical stress-case scenarios, that implies $3.5 to $5 billion in write-downs. That’s a 2–3% direct hit to equity. Not catastrophic, but meaningful when earnings are already trending lower.
The risk isn’t just the loss itself, it’s the market response. Investors are not pricing in a deep CRE downturn. A fresh wave of write-offs could hit sentiment and compress the stock’s valuation multiple. In a rising loss cycle, confidence matters more than capital ratios.
Until we see a reset in CRE values or more aggressive derisking from management, the stock remains vulnerable. The earnings outlook is soft. The balance sheet is exposed. This is a short or, at best, an underweight.
The forecasts provided herein are intended for informational purposes only and should not be construed as guarantees of future performance. This is an example only to enhance a consumer's understanding of the strategy being described above and is not to be taken as Blueberry Markets providing personal advice.

$WFC following through on weekly evening starLike other financial companies the sheen has come off #WFC recent chart. Even before Fridays market tantrums we saw price printing a weekly bearish evening star, and then last week we closed beneath the Weekly 20MA. Will WFC earning tomorrow provide fuel for a move lower, or rescue this decline? Watch and shoot.
$WFC🚨 Now that the Fed has lifted Wells Fargo’s asset cap, we might see more liquidity enter the markets.
This move could unlock growth & spark bullish momentum for the stock. 📈💵

Wells Fargo Beat the S&P 500 Over 12 Months. What Its Chart SaysWells Fargo NYSE:WFC will report earnings next week at a time when the banking giant's stock recently hit an all-time high and is beating the S&P 500 SP:SPX on a one-year and five-year basis, but trailing more recently. What does the stock's technical and fundamental analysis show?
Let's check it out:
Wells Fargo's Fundamental Analysis
WFC will be among one of the first major companies to report Q3 earnings, unveiling results next Tuesday as several large banks head to the tape.
A traditional money-center bank, Wells Fargo recently saw the Federal Reserve lift a punitive $1.95 trillion asset cap that the bank had faced since 2018 in response to a number of scandals at the firm. Problems dated back to 2016 and involved WFC setting up fake customer accounts, auto loans and mortgages, although all of that happened under previous management.
Current President and CEO Charles Scharf spent years since taking the job in 2019 proving to the Fed that the bank had cleaned up its act. Now, having the ability to manage more assets could potentially mean increased potential for WFC, especially at a time when net interest margin is the name of the game in banking.
For Q3, analysts expect Wells Fargo to post $1.53 in GAAP earnings per share on roughly $21.1 billion of revenue. That would represent a 7.7% gain on the $1.42 in GAAP EPS that the bank saw in the year-ago period, as well as about 3.7% growth from the $20.4 billion in revenues seen in the same period last year.
That may not seem like a big y/y revenue gain, but it would reflect the most aggressive annual growth that Wells Fargo has seen for any quarter in two years.
Meanwhile, 14 of the 20 sell-side analysts that I know of who track WFC have increased their earnings estimates since the quarter started. (Five have lowered their estimates, while one has made no changes.)
Three analysts rated five stars out of a possible five by TipRanks -- Bank of America's Ebrahim Poonawala, Wolfe Research's Steven Chubak and UBS's Erika Najarian -- also reiterated their "Buy" or "Buy-Equivalent" ratings just this month.
That said, Poonawala didn't set a price target, while Chubak and Najarian cut their WFC targets to $90 and $93, respectively. That's certainly a mixed bag of expectations from the analyst community.
Wells Fargo's Technical Analysis
How about the technicals? Well, here's WFC's chart going back some eight months and running through Monday afternoon:
Readers will see that from February into early summer, Wells Fargo developed what's called an "inverse head-and-shoulders pattern" of bullish reversal, marked with a jagged black line at the chart's left. This pattern had a $77 pivot vs. the $79.73 that WFC closed at Wednesday.
Wells Fargo then went right into what looks like a still incomplete "ascending-triangle" pattern of bullish trend continuance, marked with diagonal purple lines at the chart's right. This brought the pivot up to $85, and would presumably take analysts' price targets higher as well.
That said, the stock is currently struggling with both its 50-day Simple Moving Average (or "SMA," denoted by a blue line) and with the ascending triangle's lower trendline.
Whether Wells Fargo can hold those lines could have a lot to do with how professional managers treat that stock going forward.
Meanwhile, take a look at the secondary indicators that I placed on the above chart.
Wells Fargo's Relative Strength Index (the gray line at the chart's top) isn't overtly weak, but is running below what technical analysts would consider neutral.
The stock's daily Moving Average Convergence Divergence indication (or "MACD," denoted by the black and gold lines and blue bars at the chart's bottom) is even shakier.
The histogram of Wells Fargo's 9-day Exponential Moving Average (or "EMA," marked with blue bars) is below the zero bound, which is a short-term bearish technical signal.
And while both the 12-day EMA (the black line) and 26-day EMA (the gold line) are above zero (a bullish technical sign), the 12-day line has crossed below the 26-day line. That's traditionally a bearish signal.
An Options Option
Options traders who think WFC will hold its 50-day SMA line and make a run at the pivot might employ a bull-call spread in scenario. This involves buying a call option and selling a second call option that has a higher strike price, hoping for a moderate rise in the stock.
Here's an example:
-- Buy one Oct. 17 $80 call for about $2.65. This will expire after Wells Fargo's Oct. 14 earnings release.
-- Sell one October 17 $85 call for roughly $0.65.
Net Debit: $2.
This trade involves spending and risking $2 for the potential to make $3 (the difference between the two calls' strike prices minus the net debit.)
Traders willing to potentially purchase the shares at a discount might also add the sale of a put to the above trade. Example:
-- Sell one Oct. 17 put for about $0.55 at a $76 strike price (Wells Fargo's 200-day SMA).
New Net Debit: $1.45.
This combination offers as much as a 244% potential profit. However, the trader would risk potentially having to buy WFC at a $76.45 net basis.
(Moomoo Technologies Inc. Markets Commentator Stephen "Sarge" Guilfoyle was long WFC at the time of writing this column.)
This article discusses technical analysis, other approaches, including fundamental analysis, may offer very different views. The examples provided are for illustrative purposes only and are not intended to be reflective of the results you can expect to achieve. Specific security charts used are for illustrative purposes only and are not a recommendation, offer to sell, or a solicitation of an offer to buy any security. Past investment performance does not indicate or guarantee future success. Returns will vary, and all investments carry risks, including loss of principal. This content is also not a research report and is not intended to serve as the basis for any investment decision. The information contained in this article does not purport to be a complete description of the securities, markets, or developments referred to in this material. Moomoo and its affiliates make no representation or warranty as to the article's adequacy, completeness, accuracy or timeliness for any particular purpose of the above content. Furthermore, there is no guarantee that any statements, estimates, price targets, opinions or forecasts provided herein will prove to be correct.
The Analyst Ratings feature comes from TipRanks, an independent third party. The accuracy, completeness, or reliability cannot be guaranteed and should not be relied upon as a primary basis for any investment decision. The target prices are intended for informational purposes only, not recommendations, and are also not guarantees of future results.
Options trading is risky and not appropriate for everyone. Read the Options Disclosure Document ( j.moomoo.com ) before trading. Options are complex and you may quickly lose the entire investment. Supporting docs for any claims will be furnished upon request.
Options trading subject to eligibility requirements. Strategies available will depend on options level approved.
Maximum potential loss and profit for options are calculated based on the single leg or an entire multi-leg trade remaining intact until expiration with no option contracts being exercised or assigned. These figures do not account for a portion of a multi-leg strategy being changed or removed or the trader assuming a short or long position in the underlying stock at or before expiration. Therefore, it is possible to lose more than the theoretical max loss of a strategy.
Moomoo is a financial information and trading app offered by Moomoo Technologies Inc. In the U.S., investment products and services on Moomoo are offered by Moomoo Financial Inc., Member FINRA/SIPC.
TradingView is an independent third party not affiliated with Moomoo Financial Inc., Moomoo Technologies Inc., or its affiliates. Moomoo Financial Inc. and its affiliates do not endorse, represent or warrant the completeness and accuracy of the data and information available on the TradingView platform and are not responsible for any services provided by the third-party platform.

$WFC Call Alert – Oct 31 ’25 $80 Calls | 57% ROI PotentialEnter: NYSE:WFC OCT 31 2025 $80 CALLS
Buy in Price: $2.78 - $2.80
Take Profit: $4.36
Stop Bleeding: $2.45
ROI Potential: 57%
Exit Within: 311 Minutes

WFLWe’re maintaining a bullish outlook on Wells Fargo. After a sustained period of consolidation, the stock has now broken through its RSI trend line to the upside – a classic technical signal indicating strengthening momentum and a potential continuation of the uptrend.
Why we’re bullish on WFC:
Momentum Shift – The recent breakout above the RSI trend line shows buyers are regaining control.
Strong Support Levels – Price action has consistently held above key support zones, reflecting strong underlying demand.
Positive Risk/Reward – With resistance levels being tested and upward momentum building, we see potential for WFC to move toward our target price of $92.
📌 Disclaimer: We are not licensed financial advisers. This information is for educational and informational purposes only. Please do your own due diligence and consider your personal circumstances before making any investment decisions.

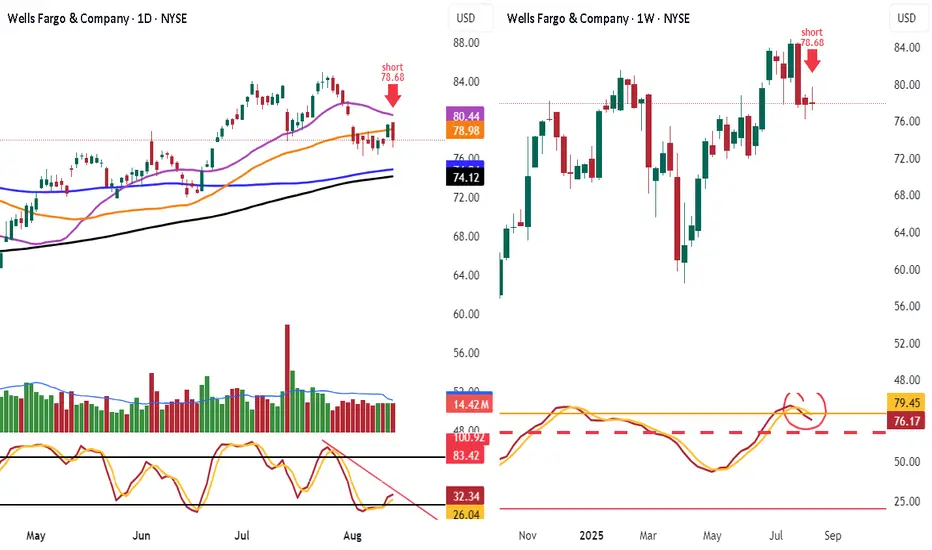
Shorted WFC 78.68 target 74 or lowerLooking at the daily chart u can see we have lower highs, and engulfing candle. Look closely u have 25 day rolling down bottom arrow. We also broke 50 day ma with vol. We have daily stoch heading down.
Also I explain this all time cannot go far in a car with out fuel same with market looking at vol, look u have more empty days then full more selling then buying
Lets look weekly chart see stoch rolling over once breaks that red dotted line 68% she will drop it to lower highs look that huge engulfing candle
Target is 74 or lower
Trailing stop in
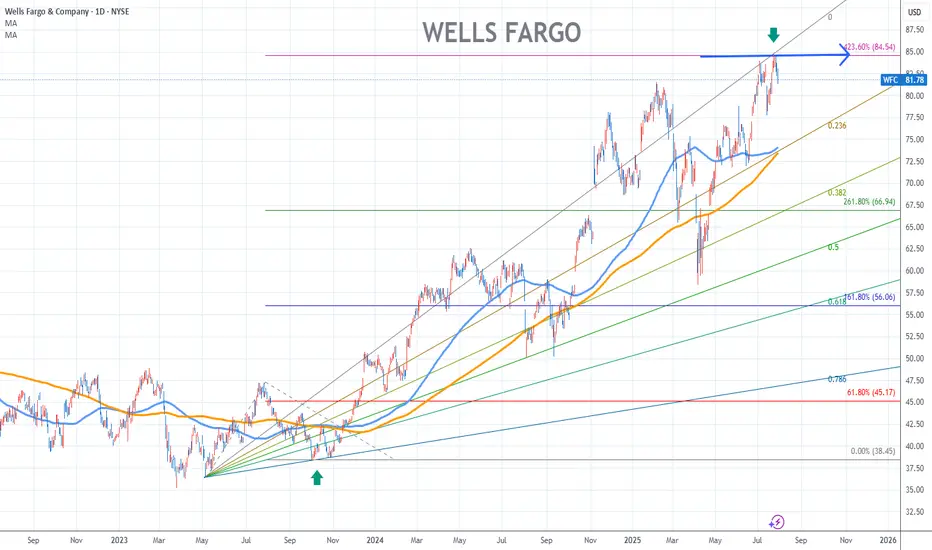
Wells Fargo Stock Chart Fibonacci Analysis 073025Hit the 84.5/423.60% resistance level.
Trading Idea
Chart time frame:D
A) 15 min(1W-3M)
B) 1 hr(3M-6M)
C) 4 hr(6M-1year)
D) 1 day(1-3years)
Stock progress:E
A) Keep rising over 61.80% resistance
B) 61.80% resistance
C) 61.80% support
D) Hit the bottom
E) Hit the top
Stocks rise as they rise from support and fall from resistance. Our goal is to find a low support point and enter. It can be referred to as buying at the pullback point. The pullback point can be found with a Fibonacci extension of 61.80%. This is a step to find entry level. 1) Find a triangle (Fibonacci Speed Fan Line) that connects the high (resistance) and low (support) points of the stock in progress, where it is continuously expressed as a Slingshot, 2) and create a Fibonacci extension level for the first rising wave from the start point of slingshot pattern.
When the current price goes over 61.80% level , that can be a good entry point, especially if the SMA 100 and 200 curves are gathered together at 61.80%, it is a very good entry point.
As a great help, tradingview provides these Fibonacci speed fan lines and extension levels with ease. So if you use the Fibonacci fan line, the extension level, and the SMA 100/200 curve well, you can find an entry point for the stock market. At least you have to enter at this low point to avoid trading failure, and if you are skilled at entering this low point, with fibonacci6180 technique, your reading skill to chart will be greatly improved.
If you want to do day trading, please set the time frame to 5 minutes or 15 minutes, and you will see many of the low point of rising stocks.
If want to prefer long term range trading, you can set the time frame to 1 hr or 1 day.
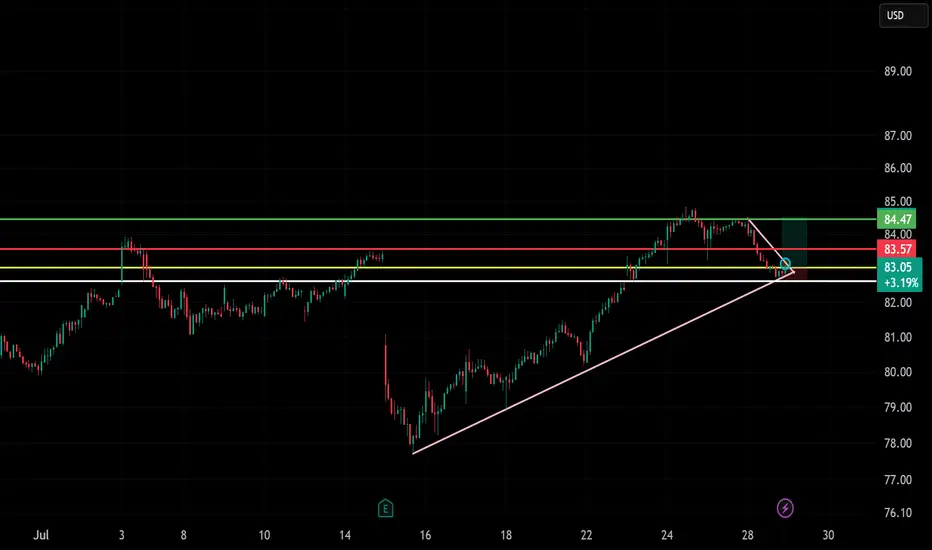
Trade Setup: LONG on WFC!📈
🕰️ Timeframe: 30-minute chart
🔍 Pattern: Bull flag / descending channel breakout
📉 Previous Trend: Uptrend with healthy retracement
🧭 Setup: Breakout from short-term correction, aligning with trendline support
🧩 Technical Breakdown:
Support Zones:
$83.00 (holding on ascending trendline)
$82.50–82.75 (horizontal support near recent consolidation)
Entry Zone:
Around $83.00–83.10, right at the wedge breakout and trendline bounce
Price currently at $83.07
Resistance / Target Levels:
TP1: $83.57 (red line – previous supply zone)
TP2: $84.00 (orange – intraday resistance)
TP3: $84.47 (green – swing high / upper target)
Stop Loss:
Below $82.50 (under trendline and horizontal support)
Risk-Reward Estimate:
R:R ~ 1:2 or more depending on SL and target chosen
⚠️ Key Watchpoints:
Breakout needs volume confirmation (not shown but important)
Hold above $83.00 is critical for bullish momentum
$84 zone could act as a short-term barrier
✅ Summary:
This is a clean long setup with a textbook bounce off the rising trendline and breakout of a mini bull flag/descending channel. A sustained move above $83.57 can unlock a push toward $84.47.
WFC Earnings Setup – 07/14/2025 $86C | Exp. July 18 | Betting on
📈 WFC Earnings Setup – 07/14/2025
$86C | Exp. July 18 | Betting on a Bank Bounce
⸻
🔥 EARNINGS HEAT CHECK
💼 WFC reports BMO (07/15)
📊 Historical move avg: ~3–5%
📍 Current price: $82.53
📈 Above 20D/50D MAs → trend intact
⚠️ RSI = 78.07 = overbought 🚨
💥 Expected move: $2.89
⸻
🧠 SENTIMENT SNAPSHOT
🔄 Call OI stacked at $86
🔻 Put OI focused at $81
⚖️ Balanced flow → slight bullish tilt
🧾 IV is elevated, so IV crush is coming
⸻
🏦 SECTOR SUPPORT
• Financials showing strength 📈
• No major institutional bias
• VIX @ 16.40 → macro calm = earnings-friendly
⸻
🎯 Trade Plan – IV Exploitation Setup
{
"ticker": "WFC",
"type": "CALL",
"strike": 86,
"exp": "2025-07-18",
"entry": 0.81,
"target": 1.62,
"stop": 0.40,
"size": 1,
"confidence": "70%",
"entry_timing": "pre-earnings close"
}
🔹 Call Entry: $0.81
🎯 Profit Target: $1.62 (+100%)
🛑 Stop: $0.40 (-50%)
📅 Expiry: 07/18/25
📆 Earnings Date: 07/14 (BMO)
📈 Expected Move: ~$2.89
🧠 Confidence: 70%
⸻
⚠️ Key Risks
• IV crush = quick decay if WFC doesn’t move
• Guidance could swing the stock either direction fast
• Overbought = short-term pullback risk even on good earnings
✅ Why $86C?
• Just outside expected move
• High OI = liquidity
• Reasonable premium = good risk/reward
⸻
📣 Model Consensus:
“Moderately Bullish” — strong setup but keep it tight around earnings!
Tag your favorite bank stock trader 🏦👇
Who’s playing WFC earnings this quarter?
#WFC #EarningsPlay #OptionsTrading #CallOption #BankingStocks #IVCrush #RiskReward #AITrading #
WFC · Daily — Rising-Channel Breakout Idea Toward $89-90Why This Setup Caught My Eye
Multi-year rising channel: Since late 2022 price has respected a neat parallel channel; we’re now testing the upper rail.
Fresh bull-flag breakout: The June pullback carved a tight triangular flag. Last week’s high-volume close above $83 confirmed the breakout.
Measured-move logic: Flagpole ≈ $15 (from the March swing-low $68 → May swing-high $83). Projecting that height from the June pivot ($74) lands at $89-90 — perfectly matching the 100 % Fibonacci extension on my chart.
Volume-profile tailwind: A low-volume node spans $86-91, suggesting limited overhead supply until the top of the target box.

Shorting WFC for short-term correction NYSE:WFC is looking at near-term weakness after a strong bearish counter attack candle was seen rejecting the 123.6% Fibonacci extension of the range (71.82-76.50) and the 88.6% deep retracement level of the larger swing low to high (50.20-80.70).
23-period ROC is looking at a bearish divergence and volume has spike up on selling.
Target is likely to be at 71.80 and 67.10. Should the opening reverse above 76.50, the stock is likely to resume its upside and we will cut short the short-sell trade.

WFC eyes on $74: Major Resistance going into FED rate decision WFC testing a Major Resistance zone going into FED day.
Looking for a Rejection or a Break-and-Retest for next move.
Financials in general are doing well but due for a little dip.
$73.56-74.11 is the key zone of interest.
$68.91-69.60 is first good support below.
=====================================================
.
WFC: Short sell- Round 2Distribution with CHOCH structure confirmed.
Backtest with low supply volume- Good sell signal.
.
Let's see!

WFC Trade LevelsEither or set-up while in this range.
For day trades, expect price to move between 64.86-66.30 where there is a daily gap down.
For now, the gap is acting as resistance.
When trading gaps, it depends on your objective. Scalpers might be interested in playing off the H/L of the gap.
While intraday traders will be more interested in trading once price breaks above the gap or rejects below.

WFC - Faster Up PhaseAs price transitions through fib circle acceleration of price upwards is allowed
Price has been going through an upward movement however slowly, I expect price to move up faster
This is similar to Tesla's moves upward. Kind of moving up in chunks or in big waves
Weekly timeframe

WFC LONG PUTMy game plan on Wells Fargo based on the weekly break of the S-Curve. We are officially bearish in my book. Looking to get in on a retest/key level in the bear zone. I will personally be using puts.

WFCXLF banking sector is rolling over and this is one of the best setups I can find going into earnings Q2... My target is 64 gap close By beginning of May.
Stop loss over 76.00 or 50sma.
Here's XLF.. same wedge at the 50ma

WFC is moving ahead of the market for better or worse?My overall thesis is we are in the very early stages of a multi-year decline ultimately with the S&P 500 below 3500. I have been wrong many times before so I will just take this thing in stages and see if it plays out. After this massive decline, we should be in for a great market rally of many decades. I am expecting the market to end its recent rally this week. The current rarely would be about a week in length depending when it began for individual stocks. The rally has done a few important things with its slow and prolonged upward movement, mainly prevents a wave 3 signal from occurring during the next decline.
My wave 3 indicator tends to signal wave 3s and 3 of 3s. See my scripts for the specifics of the indicator. If the market had a short wave 4 up and then a sharp or prolonged drop during wave 5, a new wave 3 signal would occur which violates the currently placed Minor wave 3 (yellow 3). Allowing separation from the current wave 3 signal enables wave 5 to drop quick or slow.
This chart applies select movement extensions based on wave 1's movement on the left and then another based on wave 3's movement on the right. I keep the values between 0%-100% on the chart for wave 2s and 4s retracements of the preceding wave's movement for reference even though the retracement values would be inverted.
Specifically for WFC, Minor wave 3 was the shortest impulsive wave, likely indicating wave 5 will be 49 bars (30 minute scale) or less. This will likely put a restriction on the length of the decline. Additionally wave 4 is moving faster for this ticker than it has been on the others I have studied. Minor wave 5 should drop below wave 3's bottom of 65.515. Using some basic movement extensions, it will likely go lower, but likely not too much more. Once we bottom, we should see another rally over a few weeks. I will forecast what that could look like as Intermediate wave 1 nears its end.
While WFC has been trading with most of the other signals I am watching, the current rally could be a sign of Intermediate wave 1 possibly having ended at the current Minor 3 bottom. This would mean we are in Intermediate wave 2 now. In this case, the top of Intermediate wave 2 is quickly approaching (no higher than 78.98. I will evaluate this solution if the rally continues next week.

Wells Fargo $WFC at a turning point📌 09.03.2025 Analysis:
✅ 1. Bearish Divergence:
Price Action: Higher high from Nov 26, 2024 → Feb 6, 2025.
SMI: Lower high from Nov 26, 2024 → Feb 19, 2025.
Interpretation: This confirms a bearish divergence—institutions were not supporting the price move despite a new high.
📌 Notes:
Look at how sharp the SMI drop is after making the lower high. The steeper the decline, the stronger the conviction in institutional selling.
If price makes a lower high and SMI declines aggressively, it confirms a reversal.
✅ 2. Volume Confirms Weak Breakout Attempt:
Price made a new high but volume was below the 50-day VMA.
Low volume on a higher high = Weak breakout attempt.
This suggests that buyers lacked conviction, likely retail-driven.
📌 Notes:
Check if there were any large red volume bars during this uptrend.
If large red candles appear in an uptrend with high volume, it signals distribution (institutions selling into strength).
If green candles were small and volume was low, buyers were weak, and the move was unsustainable.
✅ 3. High-Volume Sell-Off Confirms Bearish Conviction:
The last 5 days saw increasing volume on red candles.
Volume during the sell-off is above the 50-day VMA, showing institutional selling.
SMI MA (red line) is declining further = Smart money is not buying at these levels.
📌 Notes:
Since SMI is still declining while testing $70, it suggests institutions are not stepping in to defend support yet.
If WFC closes below $70 with strong volume, expect further downside.
If SMI starts flattening or rising while price holds $70, institutions may be accumulating.
📌 Final Trade Plan:
❌ Bearish Breakdown (If WFC closes below $70 with volume above 50-day VMA)
Sell-off target: $68 → $66.
Confirmation: SMI keeps dropping, high red volume.
✅ Bullish Reversal (If SMI flattens/rises while $70 holds)
Buy signal: WFC stabilizes at $70 with rising green volume.
Target: First bounce to $74 → Next target $78.
Happy Sunday!
Follow me for more updates on this trade 😊🚀


