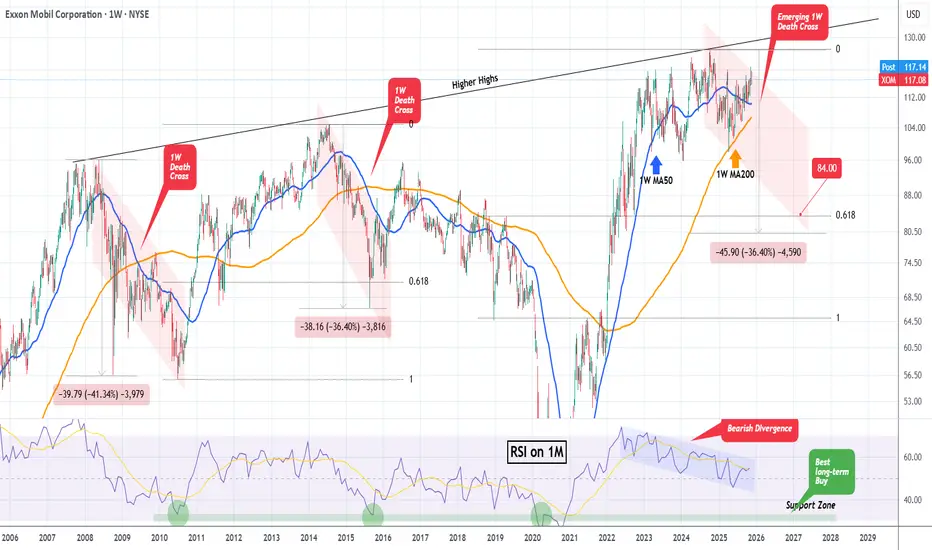
EXXON MOBIL on its 1st 1W Death Cross in 10 years!Exxon Mobil (XOM) is around a month before the formation of a 1W Death Cross for the first time in 10 years (last one in July 2015). This is a major technical development as the last two 1W Death Crosses resulted in massive sell-offs.
As you can see, both were formed long after a market rejection o
775 ARS
30.84 T ARS
311.25 T ARS
About Exxon Mobil Corporation
Sector
Industry
CEO
Darren W. Woods
Website
Headquarters
Spring
Founded
1882
ISIN
ARDEUT110152
FIGI
BBG000DYN1T1
Exxon Mobil Corp engages in the exploration, development, and distribution of oil, gas, and petroleum products. It operates through the following segments: Upstream, Downstream and Chemical. The Upstream segment produces crude oil and natural gas. The Downstream segment manufactures and trades petroleum products. The Chemical segment offers petrochemicals. The company was founded by John D. Rockefeller in 1882 and is headquartered in Irving, TX.
Related stocks
XOM - Big Move AheadDoes appear that XOM is about to launch an wave 3 impulse move. At 100% of wave one, Wave 3 could reach the $200 level
The oil/gold ratio shows oil as cheap as ever. Even as oil futures remain around $60, energy stocks have been steering. Most recently APA and IMO.
Time to load up here.
#oil

$XOM Tradespoon – Long Setup $118.41Tradespoon model signals a long bias for NYSE:XOM . Predicted range: $118.17–$119.99. Trend: –0.04%. NYSE:XOM

Exxon Mobil Exxon Mobil is going up strong to the all time high,
Expecting strong reaction from that area,
Volume is going down in the last 2 3 weeks witch means bulls are getting weaker,
If we look into the valuation ratios , the company is getting overvalued,
If we look at the 10 Ma on weekly we can see that

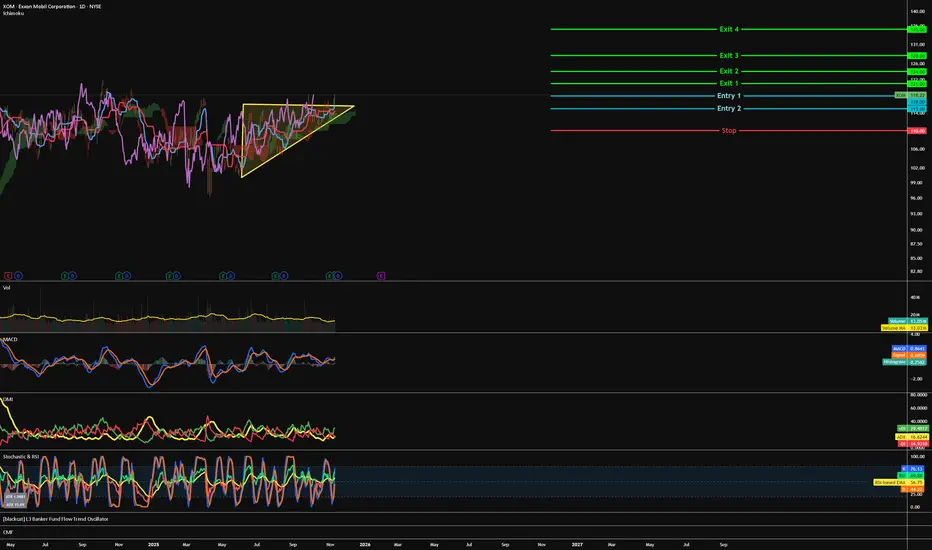
XOM - Upwards to an all new high?=======
Volume
=======
- healthy
- increasing
==========
Price Action
==========
- Ascending triangle of 5 months spotted
=================
Technical Indicators
=================
- Ichimoku
>>> price above cloud
>>> Green kumo expanding slightly
>>> Tenken - Above clouds, crossed Lagging & point
$XOM with a bearish outlook following its earnings #StocksThe PEAD projected a bearish outlook for NYSE:XOM after a negative over reaction following its earnings release placing the stock in drift A with an expected accuracy of 25%.

XOM – Rising Wedge Meets Strong Order BlockAfter a steady climb, Exxon Mobil (XOM) is showing early signs of weakness inside a rising wedge pattern. This pattern often signals loss of bullish momentum and potential trend reversal.
The price recently touched the $117–$119 order block, a key supply zone formed by previous institutional sellin

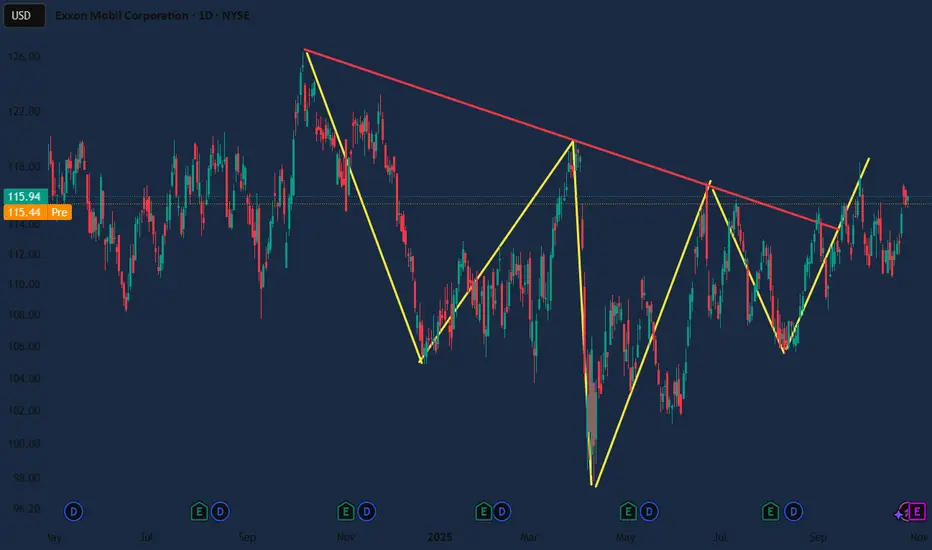
Head and Shoulders patternExxonMobil continues to showcase its resilience and strategic vision with major moves in the global energy market, including securing significant crude deals and expanding its refining operations. With a solid dividend yield of 3.4% and a robust presence in both traditional energy and sustainability
XOM: Structural Buy Limit at Multi-Year Trend Confluence.Symbol: XOM / Exxon Mobil Corporation
Timeframe: Weekly/4-Hour (Long-Term Structural Swing Trade)
Setup: Major Trend Continuation (Buy Limit)
Trade Thesis: Structural Retest & Fundamental Tailwinds
This XOM setup is a high-conviction long idea driven by a potent blend of macroeconomic factors and
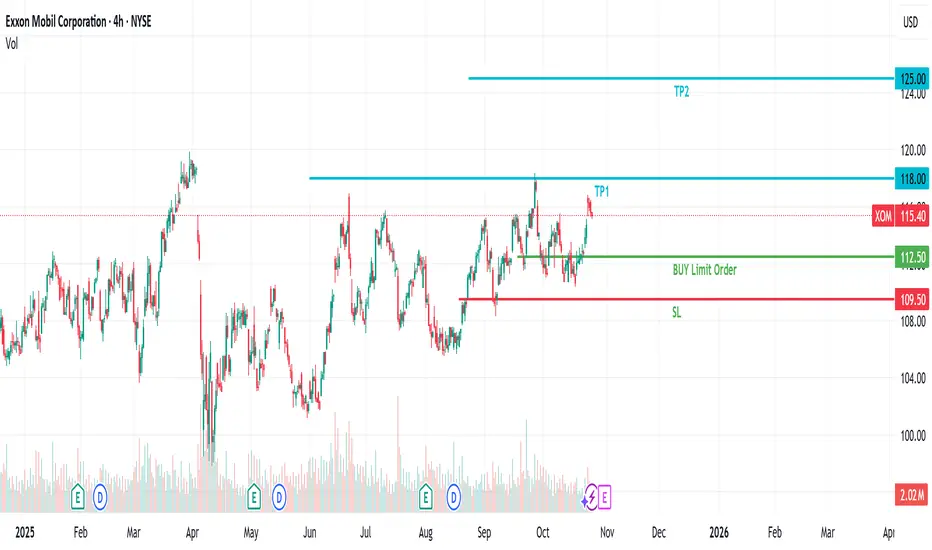
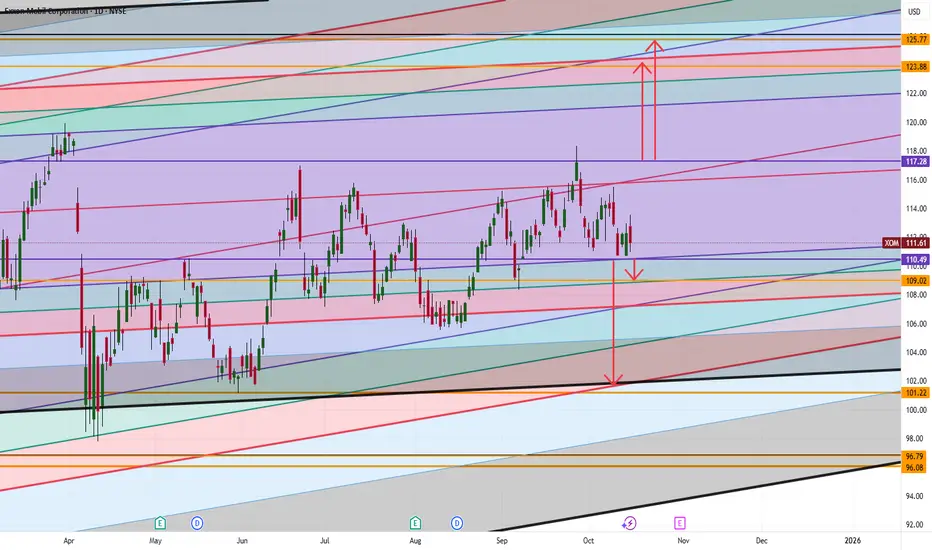
Exxon Mobil (XOM) Simple Market Breakdown!XOM’s sitting at a key level right now; momentum could go either way depending on the next breakout ⚡
Here’s what I’m watching:
📈 If we break above 117.28, that could open the door for a push up toward 123–125; that’s our next major target zone.
📉 But if we drop below 110.49, then we could see
See all ideas
Summarizing what the indicators are suggesting.
Oscillators
Neutral
SellBuy
Strong sellStrong buy
Strong sellSellNeutralBuyStrong buy
Oscillators
Neutral
SellBuy
Strong sellStrong buy
Strong sellSellNeutralBuyStrong buy
Summary
Neutral
SellBuy
Strong sellStrong buy
Strong sellSellNeutralBuyStrong buy
Summary
Neutral
SellBuy
Strong sellStrong buy
Strong sellSellNeutralBuyStrong buy
Summary
Neutral
SellBuy
Strong sellStrong buy
Strong sellSellNeutralBuyStrong buy
Moving Averages
Neutral
SellBuy
Strong sellStrong buy
Strong sellSellNeutralBuyStrong buy
Moving Averages
Neutral
SellBuy
Strong sellStrong buy
Strong sellSellNeutralBuyStrong buy
Displays a symbol's price movements over previous years to identify recurring trends.
Curated watchlists where XOM is featured.

Big Oil: Integrated energy companies
10 No. of Symbols

Oil stocks: Liquid black gold
6 No. of Symbols

See all sparks