This Time I’m Watching AppleGreetings fellow traders and chart lovers!
Here’s my updated view on Apple’s long term channel, which remains one of the cleanest trends on the NASDAQ. A perfect example of how patience pays in technical analysis.
Apple at the Edge: Key Retest Zone Before the Next Big Move 🍏
Apple Inc. (AAPL) has been moving beautifully inside a rising channel since 2020 respecting both its support and resistance trendlines with remarkable precision.
Price has once again reached the upper resistance zone, where previous rallies have often paused or reversed.
A retest zone between 260–254 now stands out as the short-term decision point.
If this zone holds, the structure could support a bullish continuation toward new highs.
However, a failure to sustain above it might trigger a healthy correction back toward the channel support near the 210–220 region.
This setup highlights how consistently Apple has respected its long-term structure a strong reminder that clean trendlines can often reveal the broader story better than any other thing.
Key Levels to Watch:
🟥 Resistance Trendline: 280–285
🟦 Retest Zone: 260–254
🟩 Support Trendline: 210–220
Idea Type: Educational / Chart Structure
Timeframe: Weekly
Perspective: Neutral-to-Bullish (watching retest reaction)
Trade ideas

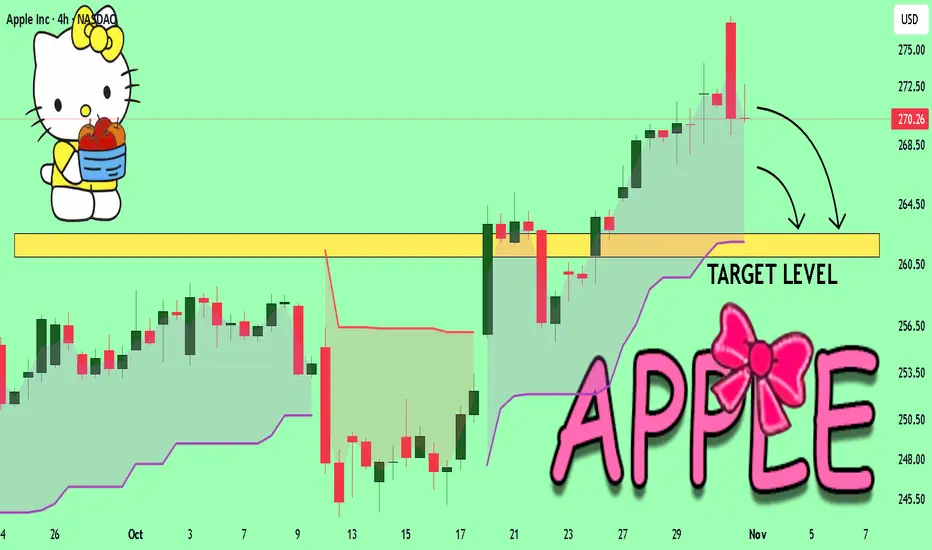
Apple Inc. (AAPL) 4H – NASDAQ chart Pattern...Apple Inc. (AAPL) 4H – NASDAQ chart:
Here’s a detailed read of the setup my drawn 👇
---
🧭 Chart Overview
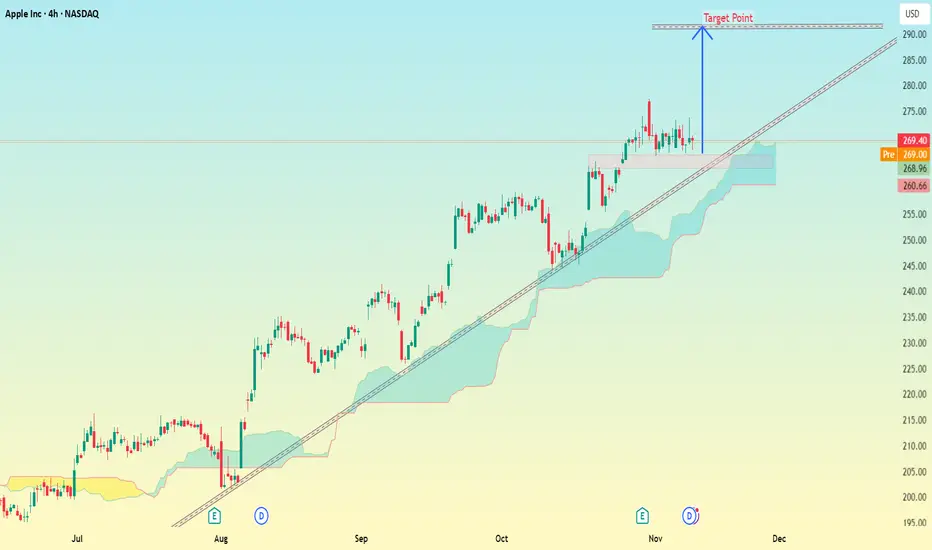
Current Price: ≈ $269.4
Trend: Strong uptrend (price holding above Ichimoku cloud & rising trendline)
Support Zone: Around $265 – $266 (where price retested the trendline + cloud)
Resistance/Target Box: Marked on my chart as Target Point near the upper trendline.
---
🎯 Target Analysis
My blue arrow points to a resistance zone near the top of the ascending channel.
The Target Point zone is around $285 – $288.
→ That’s roughly +6% to +7% upside from the current level.
---
📈 Summary
Type Level (USD) Notes
Entry (current) 269–270 Price retesting support/trendline
Target 285 – 288 Channel top / bullish target
Stop-loss (recommended) 260 – 261 Below trendline & Ichimoku cloud
---
⚠ Notes
If AAPL closes below $260, this trendline support breaks, and momentum may shift bearish.
But as long as it stays above $265, it looks strong toward $285+.
Watch volume — a breakout above $275 with volume would confirm move to target.
Apple Inc.($AAPL): Morgan Stanley Sees $130B Robotics Potential Apple Inc. (Nasdaq: NASDAQ:AAPL ) stock dipped 0.52% to $268.37 on Friday despite bullish long-term projections from Morgan Stanley. The investment bank’s new report suggests that Apple’s emerging robotics division could generate as much as $130 billion in annual revenue by 2040.
According to the analysts, including Apple specialist Erik Woodring, the company’s early robotics efforts could evolve into a major growth pillar alongside the iPhone, Mac, and wearables. The report envisions humanoid robots and robotic home assistants as part of Apple’s long-term strategy, powered by its AI and hardware integration strengths.
Morgan Stanley based its estimates on Apple’s track record of dominating premium consumer technology segments. With the company’s existing ecosystem—spanning devices, software, and services—Apple is seen as well-positioned to commercialize robotics on a massive scale. The analysts expect the robotics segment to capture roughly 9% of the total global market over the next 15 years.
The potential opportunity builds on Apple’s continued investment in AI and advanced sensors, technologies that would be essential for functional and safe humanoid robots. Analysts note that while Apple has not officially disclosed a robotics project, recent patent filings and talent acquisitions hint at serious development in the space.
Technical View
The AAPL chart indicates a bullish breakout above the $260 resistance level, confirming upward momentum following months of consolidation. Price action suggests a possible retest of this breakout zone before extending higher toward $290 and $300. With strong fundamentals and growing speculation about its next frontier in innovation, Apple’s long-term outlook remains constructive, even as short-term volatility continues.
Domestic Market vs. Global Market1. Understanding the Domestic Market
The domestic market, also called the internal or home market, refers to the buying and selling of goods and services within a country’s borders. In this setup, businesses cater primarily to local consumers and operate under the country’s own legal, economic, and cultural framework.
For instance, when an Indian company sells products exclusively within India — like Amul, Haldiram’s, or Maruti Suzuki (domestic operations) — it’s participating in the domestic market.
Key Characteristics of the Domestic Market:
Limited Geographical Scope: Operations are confined to national borders.
Single Currency Usage: Transactions are conducted in the local currency (e.g., INR in India).
Uniform Legal Framework: Businesses follow domestic laws, taxation policies, and trade regulations.
Cultural Familiarity: Companies understand local consumer behavior, preferences, and traditions.
Less Competition from Foreign Players: Though globalization has changed this somewhat, domestic firms often face fewer international competitors.
Advantages of the Domestic Market:
Ease of Entry and Operation: No need to deal with foreign regulations or trade barriers.
Lower Operational Costs: Reduced logistics, tariffs, and compliance costs.
Better Market Understanding: Firms are aware of local culture, income levels, and trends.
Stable Political and Legal Environment: Predictability within familiar systems.
Challenges in the Domestic Market:
Limited Growth Opportunities: Once the local market saturates, expansion becomes difficult.
Economic Fluctuations: Domestic recessions can severely affect business.
Intense Local Competition: Many players target the same customer base.
Dependence on Local Policies: Tax changes or regulations can heavily influence profitability.
The domestic market is often the foundation where companies grow, learn, and prepare to expand into international markets.
2. Understanding the Global Market
The global market (or international market) refers to the worldwide exchange of goods, services, capital, and technology among different countries. It’s a broader and more complex ecosystem influenced by diverse economic systems, political environments, and cultural values.
When companies like Apple, Samsung, Tata Motors, or Nestlé sell across multiple continents, they are active in the global market. Their operations, supply chains, and customer bases span across borders.
Key Characteristics of the Global Market:
Wide Geographical Reach: Operations across several countries and continents.
Multiple Currencies and Economies: Transactions often involve exchange rate risks.
Diverse Regulations: Companies must comply with various trade laws, labor policies, and quality standards.
Cultural Diversity: Marketing and communication strategies must adapt to regional preferences.
High Competition: Domestic companies compete with global giants and multinational corporations (MNCs).
Advantages of the Global Market:
Larger Customer Base: Businesses can reach billions of potential customers.
Diversification of Risk: Economic slowdowns in one region may be offset by growth in another.
Economies of Scale: Large production volumes reduce per-unit costs.
Access to Resources: Firms can source raw materials, labor, and technology globally.
Brand Expansion: Global presence strengthens brand recognition and trust.
Challenges in the Global Market:
Complex Regulations: Varying trade tariffs, customs duties, and compliance requirements.
Currency Fluctuations: Exchange rate volatility affects pricing and profits.
Political Instability: Trade wars, sanctions, and diplomatic tensions can disrupt operations.
Cultural Barriers: Misunderstanding consumer preferences can harm brand image.
High Entry Costs: Global expansion requires significant investment in logistics, marketing, and infrastructure.
Despite the risks, the global market offers enormous opportunities for innovation, growth, and international collaboration.
3. The Role of Technology and Globalization
Over the last few decades, globalization and digital technology have blurred the line between domestic and global markets. E-commerce, logistics, and digital payments have made cross-border trade easier than ever.
Platforms like Amazon, Alibaba, and Shopify allow small domestic businesses to sell globally. Similarly, technology-driven logistics networks enable even regional manufacturers to export with minimal friction.
Additionally, social media has become a global marketing tool. A brand in India can now reach consumers in Europe or Africa through targeted online campaigns.
This digital integration has created what economists call a “globalized domestic market” — a market where local and international competition coexist simultaneously.
4. Strategic Approach for Businesses
Domestic Market Strategy:
Focus on local consumer behavior and needs.
Build brand loyalty and community trust.
Optimize cost and pricing structures for affordability.
Leverage government incentives and domestic supply chains.
Global Market Strategy:
Conduct deep market research before entry.
Adapt marketing, packaging, and communication for cultural fit.
Build partnerships or joint ventures with local companies.
Hedge against currency and political risks.
Ensure compliance with international standards (like ISO or CE).
A company that excels in the domestic market gains a strong base to expand internationally. For example, Tata Group and Infosys started in India but built global empires by leveraging their domestic strength.
5. Impact on the Economy
Both markets are crucial to a nation’s economic development.
The domestic market stimulates local production, job creation, and innovation. It builds self-reliance and consumer confidence.
The global market brings foreign investment, export earnings, and access to advanced technology.
Together, they create a balanced economic ecosystem, where domestic strength supports global competitiveness, and global engagement enhances domestic growth.
6. The Future Outlook
The line between domestic and global markets will continue to blur. With advancements in AI, logistics, and blockchain, cross-border trade will become faster, cheaper, and more transparent.
However, rising geopolitical tensions, trade protectionism, and sustainability demands may reshape how businesses approach globalization. Companies will need to balance “think global, act local” — a philosophy known as glocalization — to succeed in both markets.
Conclusion
In essence, the domestic market provides stability, familiarity, and a strong foundation, while the global market offers growth, diversity, and innovation. Businesses that can master both—understanding local needs while adapting to international challenges—can create enduring global brands.
The world economy thrives on the dynamic interaction between domestic and global markets. As technology continues to connect people and businesses, success will depend not on choosing one over the other, but on how effectively companies blend both to create sustainable, borderless growth.

Whale Activity Tracker - 2025-11-07🐋 Whale Activity Tracker - 2025-11-07
🐋 WHALE ACTIVITY DETECTED - FOLLOW THE INSTITUTIONAL FLOW
AI Analysis of Dark Pool and Large Block Trades
════════════════════════════════════════════════════════════════════════════════
💰 WHALE ACTIVITY SIGNALS
Generated: November 07, 2025 at 12:47 AM
════════════════════════════════════════════════════════════════════════════════
📊 5 Total Opportunities • ✅ 0 Ready to Trade • ⏸️ 5 Monitor
────────────────────────────────────────────────────────────────────────────────
┌─ #1 ⏸️ NASDAQ:AAPL • Score: 40/100 • WAIT
│
│ 📅 DTE: 4-8w days
│ 🔴 Risk Level: High Risk (7/10)
│
│ 📰 Catalyst: 0.8x vol surge, 1 block days, $23297.0M estimated flow, DP score 28
│ 📊 Setup: Whale activity pattern developing - institutional interest building
│ 🎯 Target: 8-15% upside in 3-5 weeks - early whale activity, watch for confirmation
│ 📈 Options: CALL 6-10w out (ITM/ATM) - whale position needs time to develop, $23297M flow
│
│ 💡 Wait - Monitor for stronger whale signals
│ ⚠️ Risk: Overbought (RSI 81) - whale accumulation may be late stage, watch for profit taking
└───────────────────────────────────────────────────────────────────────────────
┌─ #2 ⏸️ NASDAQ:HOOD • Score: 30/100 • WAIT
│
│ 📅 DTE: 4-8w days
│ 🔴 Risk Level: High Risk (8/10)
│
│ 📰 Catalyst: 2.0x vol surge, 0 block days, $0.0M estimated flow, DP score 0
│ 📊 Setup: Volume surge 2.0x with minimal price impact - smart money positioning
│ 🎯 Target: 8-15% upside in 3-5 weeks - early whale activity, watch for confirmation
│ 📈 Options: CALL 3-6w out (slight OTM) - ride 2.0x volume momentum, set tight stops
│
│ 💡 Wait - Monitor for stronger whale signals
│ ⚠️ Risk: Standard whale play risk - set stops below recent support
└───────────────────────────────────────────────────────────────────────────────
┌─ #3 ⏸️ NASDAQ:GOOG • Score: 25/100 • WAIT
│
│ 📅 DTE: 4-8w days
│ 🔴 Risk Level: Hi
Image
gh Risk (8/10)
│
│ 📰 Catalyst: 0.8x vol surge, 1 block days, $13691.9M estimated flow, DP score 0
│ 📊 Setup: Whale activity pattern developing - institutional interest building
│ 🎯 Target: 8-15% upside in 3-5 weeks - early whale activity, watch for confirmation
│ 📈 Options: CALL 6-10w out (ITM/ATM) - whale position needs time to develop, $13692M flow
│
│ 💡 Wait - Monitor for stronger whale signals
│ ⚠️ Risk: Overbought (RSI 78) - whale accumulation may be late stage, watch for profit taking
└───────────────────────────────────────────────────────────────────────────────
┌─ #4 ⏸️ NYSE:BAC • Score: 25/100 • WAIT
│
│ 📅 DTE: 4-8w days
│ 🔴 Risk Level: High Risk (8/10)
│
│ 📰 Catalyst: 1.4x vol surge, 0 block days, $0.0M estimated flow, DP score 27
│ 📊 Setup: Whale activity pattern developing - institutional interest building
│ 🎯 Target: 8-15% upside in 3-5 weeks - early whale activity, watch for confirmation
│ 📈 Options: CALL 4-6w out (ATM) - wait for stronger confirmation, paper trade first
│
│ 💡 Wait - Monitor for stronger whale signals
│ ⚠️ Risk: Overbought (RSI 73) - whale accumulation may be late stage, watch for profit taking
└───────────────────────────────────────────────────────────────────────────────
┌─ #5 ⏸️ NASDAQ:TSLA • Score: 20/100 • WAIT
│
│ 📅 DTE: 4-8w days
│ 🔴 Risk Level: High Risk (9/10)
│
│ 📰 Catalyst: 1.3x vol surge, 0 block days, $0.0M estimated flow, DP score 13
│ 📊 Setup: Whale activity pattern developing - institutional interest building
│ 🎯 Target: 8-15% upside in 3-5 weeks - early whale activity, watch for confirmation
│ 📈 Options: CALL 4-6w out (ATM) - wait for stronger confirmation, paper trade first
│
│ 💡 Wait - Monitor for stronger whale signals
│ ⚠️ Risk: Standard whale play risk - set stops below recent support
└───────────────────────────────────────────────────────────────────────────────
────────────────────────────────────────────────────────────────────────────────
📖 QUICK GUIDE:
✅ ENTER NOW → High probability s
etup, optimal timing, low-medium risk
⏸️ WAIT → Monitor for better entry or catalyst resolution
🟢 Low Risk → Heat 1-3 (stable, far from catalysts)
🟡 Med Risk → Heat 4-6 (moderate volatility)
🔴 High Risk → Heat 7-10 (near catalysts, high volatility)
💎 Position Sizing: 2-5% per trade • Max 2-3 concurrent positions
🎯 Exit Strategy: Take profit at 50% max gain or stop at 2x loss
════════════════════════════════════════════════════════════════════════════════

AAPL Pullback: 10-EMA Bounce with RS Line at New HighAnalysis:
▪ Price has pulled back to the 10-EMA, presenting a potential entry point.
▪ Closing range at 60%, indicating controlled consolidation rather than aggressive selling.
▪ Excellent relative strength compared to the broader market.
▪ Relative Strength (RS) Line has been hitting new highs consistently over the past several weeks, signaling outperformance and bullish momentum.
Trade Idea:
▪ Long Entry: Near current levels or on a bounce from 10-EMA.
▪ Stop Loss: Below recent low or 10-EMA for risk management.
▪ Target: Recent high at $277.
▪ Risk/Reward: Aim for 1:2 or better; monitor for volume confirmation.

Apple at Historical ResistanceThe Apple (AAPL) daily chart shows that after a strong rally from around $220, the stock has now reached a major resistance zone near $260, where heavy selling pressure has appeared. How the price reacts to this level will likely determine the next medium-term trend.
Short-Term Outlook (next few days to weeks):
In the short term, the $259–$260 zone is a key support/resistance area. If the price manages to hold and close above it, a continuation toward $280–$290 is likely.
However, if it fails to sustain this level and breaks below $259, a short-term correction toward $250–$245 (around the 50-day SMA) could follow.
• Bullish short-term target: $280–$290
• Bullish stop loss: Below $258
• Bearish short-term target: $250–$245
• Bearish stop loss: Above $265
Long-Term Outlook (1–3 months):
The broader trend remains bullish, supported by an upward-sloping 50-day moving average and consistent higher highs. A confirmed breakout and close above $260 would likely fuel a new leg higher toward $300–$310.
On the downside, if the stock loses support around $245, a deeper pullback toward $230 could occur.
• Bullish long-term target: $300–$310
• Long-term stop loss: Below $245
In summary, Apple is at a critical decision point — sustained strength above $260 could launch a new rally phase, while a breakdown below it might trigger a healthy short-term correction toward the 50-day moving average.

Apple Inc. Swing Setup – Breakout or Breakdown Ahead?🍎 AAPL | Apple Inc. - Swing Trade Profit Blueprint 💰
NASDAQ: AAPL | Breakout Pattern Setup ⚡
Master the Swing Trade Game 🎯
📊 TECHNICAL OVERVIEW
Currently trading at $268.47 with strong momentum indicators aligning for a breakout scenario. Apple is positioned in a critical decision zone with defined technical levels offering professional risk/reward opportunities.
🎲 Market Structure: Tight consolidation phase with multiple confluences at key resistance and support zones.
📈 SWING TRADE SETUP - DUAL SCENARIO ANALYSIS
SCENARIO 1: BULLISH BREAKOUT 🚀
Entry Signal: Price breaks above resistance with volume confirmation
Entry Zone: Above $272.00 (Daily Close Confirmation)
Initial Target: $290.00 TP1 🎯
Extended Target: $295.00 TP2 (Ultimate Profit Zone) 🏆
Stop Loss: $264.00 (Risk Management Point) 🛑
SCENARIO 2: BEARISH BREAKDOWN 📉
Entry Signal: Price breaks below support with selling pressure
Entry Zone: Below $266.50 (Daily Close Confirmation)
Target 1: $262.00 TP1 🎯
Target 2: $256.00 TP2 (Profit Protection Zone) 🏆
Stop Loss: $276.00 (Risk Management Point) 🛑
🔍 KEY TECHNICAL FACTORS
✅ Momentum Alignment: Multiple timeframe convergence detected
✅ Volume Profile: Above average volume supporting breakout potential
✅ Support/Resistance: Well-defined levels from historical price action
✅ RSI Positioning: Neutral to strong momentum setup
✅ Moving Averages: Key dynamic support levels in play
🎯 SCENARIO CORRELATION PAIRS TO MONITOR
Primary Correlations:
🔗 NASDAQ:MSFT (Microsoft) - Tech sector strength indicator | Tech giants move together | Watch for divergence signals
🔗 NASDAQ:QQQ (Nasdaq-100 ETF) - Broader market direction | If QQQ breaks down, AAPL pressure increases | Use as macro confirmation
🔗 AMEX:VGT (Vanguard Info Tech ETF) - Sector sentiment gauge | Tech rotation plays | Confirms sector health
🔗 AMEX:IVV (iShares S&P 500 ETF) - S&P 500 correlation | Broad market support/resistance | Risk-on/risk-off indicator
🔗 AMEX:GLD (Gold) - Risk sentiment inverse correlation | Gold up = Risk-off = Tech pressure | Macro economic climate
📍 IMPORTANT REMINDERS FOR TRADERS
Your Entry Is Your Choice ✓ Only enter when YOUR checklist is complete
Your Stop Loss Is Your Decision ✓ Set it where YOU feel comfortable with risk
Your Take Profit Is Your Call ✓ Exit when your profit target is achieved or thesis breaks
Every trader's risk tolerance differs. These levels are technical reference points, not personal recommendations.
🎓 STRATEGY NOTES
✨ Best used on 1H-4H timeframes for swing trading
✨ Volume confirmation is CRITICAL before entries
✨ Wait for candle closes above/below levels - no wick trading
✨ Use this alongside your own technical analysis
✨ Market conditions can invalidate setups rapidly - stay flexible
✨ The breakout zone is where patience rewards traders
💡 CORRELATION SUMMARY
Green Lights ✅: When MSFT, QQQ, and VGT all confirm uptrend = Stronger AAPL bullish case
Yellow Caution ⚠️: When divergence appears between AAPL and QQQ = Possible reversal warning
Red Lights 🔴: When GLD spikes & IVV breaks support = Risk-off environment = Tech pressure incoming
✨ If you find value in my analysis, a 👍 and 🚀 boost is much appreciated — it helps me share more setups with the community!
APPLE The Target Is UP! BUY!
My dear friends,
My technical analysis for APPLE is below:
The market is trading on 268.53 pivot level.
Bias - Bullish
Technical Indicators: Both Super Trend & Pivot HL indicate a highly probable Bullish continuation.
Target - 271.24
Recommended Stop Loss - 266.96
About Used Indicators:
A pivot point is a technical analysis indicator, or calculations, used to determine the overall trend of the market over different time frames.
Disclosure: I am part of Trade Nation's Influencer program and receive a monthly fee for using their TradingView charts in my analysis.
———————————
WISH YOU ALL LUCK

APPLE First correction signals in 7 months start to emerge.Almost 1.5 month ago (September 19, see chart below), we gave a buy signal on Apple Inc. (AAPL), which recently hit our $273 Target:
This time we go back to our long-term perspective and view Apple on the 1W time-frame, as the Bullish Leg (green) since the April 07 bottom, is approaching the top (Higher Highs trend-line) of the 4-year Channel Up.
The previous Bullish Leg peaked just below the 1.236 Fibonacci extension, so we can't rule out one final push to round $285 but on the long-term, a technical pull-back is favored.
The 2023 Bullish Leg eventually corrected on the 1W MA50 (blue trend-line), hitting its 0.382 Fibonacci retracement level at the same time. Even the smaller April - July 2024 Leg pulled-back to he 0.5 Fib.
All of those Channel Up tops have been also met with a 1W RSI break above the 70.00 oversold level, which is something that hasn't taken place yet. Similarly the 1W MACD hasn't started to reverse on the levels of most of previous tops.
In any case, we expect to see Apple hitting $236 at least on the long-term, which is its 0.382 Fib and marginally below the 1W MA50.
-------------------------------------------------------------------------------
** Please LIKE 👍, FOLLOW ✅, SHARE 🙌 and COMMENT ✍ if you enjoy this idea! Also share your ideas and charts in the comments section below! This is best way to keep it relevant, support us, keep the content here free and allow the idea to reach as many people as possible. **
-------------------------------------------------------------------------------
💸💸💸💸💸💸
👇 👇 👇 👇 👇 👇

LightWhenever I prepare an idea to publish, well... I don't prepare.
As you may already have realized, my "blog" is not about trading / investment analysis. It is an attempt of mine to describe the indescribable. To smell the un-smellable (like a Greek song said).
My first ideas were an attempt of mine to reach out to others to spark conversation.I wasn't trying to give out any meaningful insight, because I had none. Now I think I have information to share, but Socrates would not agree with me, he is certain that he knows nothing . Since I cannot / don't want to be like Socrates, I will be like Diogenes the Cynic, I like him more... His views on philosophy and the world have grown on me.
And speaking of grown...
Apple has grown. From a seed of a Macintosh in a wooden box, into to a computer that would destroy Orwell's 1984, and then to a pair of smart glasses that would become the dystopia they tried to avoid.
Traders have also grown, most only in their age and appetite. The minds stood still.
And prices have grown higher and higher, but lighter than ever before.
Many analysts develop indicators in reverse. They want profit and shape indicators in a way to satisfy this growing appetite. The appetite of the man who isn't satisfied with the few, cannot be satisfied with the many. I have done this myself in the past.
There are two ways this chart is misleading.
First: Price on top of Bollinger Band can be interpreted as a "strong push", and at the same time an "overextended price". The indicator by itself is not misleading. It is us who don't analyze it properly.
Second: While this indicator calculates a statistical deviation (a pure mathematical idea), it fails in the act. Statistical deviation of trending prices cannot be calculated with ordinary moving averages. Don't listen to me, listen to the scientists from whom I found this, research it yourselves. A secondary problem is log scale.
A portion of traders, whom I call gamblers have grown light minded, it seems. They don't want prices to ... slide backward into oblivion, just as (we / they) have finally begun to see the light.
And just like gamblers, lighter my charts have apparently become. I simply try to shed some light into the darkness of technological / artificially untelligent societies.
Since my publications of indicators have been buried in the darkness, now it is time for them to shine, in simple terms.
And so, fixing analysis needs many steps. I show again the original statistical band:
Our data lives in a log-scaled world of increasing proportions, not increasing amounts. So, we re-shape our/Bollinger's mathematics to survive in this wild world of massive numbers. We then conclude to the log-scaled band:
One of the major problems however has not been fixed. Mathematicians dictate that classical moving averages don't apply in "Time Series Data" i.e. price history. Statistics don't work in trending data.
To fix this issue I have constructed a simplified MA model and applied it in multi-timeframe price data using PineScript.
The MA-Model is not a moving average (it doesn't describe an average price). It is instead one of the infinite trend-nullifying lines, from the base of which statistics are calculated. The band is the same 2-sigma area like the classic Bollinger.
What is the conclusion of this chaotic story, I hear you say...
It is either too simple or too complex.
The simple explanation is that history repeats itself.
Going back to 1998, we see the following:
Price divergences have become apparent from statistics. On the first arrow of each one, price reaches a 2-sigma deviation. On the second arrow of each divergence, price fails to make a second deviation jump, price instead returns to mean.
It is as if prices move in two steps. First they define a trend from a 2-sigma event (either bullish / bearish), then they follow up on the trend, while reverting to mean.
Now in 2025, in a larger timeframe, Apple seems to crave bitter sweets.
The 1998-2000 bubble is dwarfed from this massive chart.
Apple has done it. From the bottom of the world and a sub 1% market share, to conquer the world. It is the most loved brand. Sells the most popular smartphone. Designs the most powerful chips. Shapes future trends. And ironically, this very idea is typed on a modern Apple device.
You have reached the top, when everyone is sure that you will live forever.
And I mean everyone, including me who hypocritically votes against them.
The drop will come when a single person changes their mind.
Be wise. Be safe. Be aware.
-Breen
P.S. I will follow up this idea with some interesting charts on SPX in the following days.

Apple - Long -290Apple has shown the potential to hit the levels of 290.
The price might see the levels of 230 or even 205 before moving the higher levels.

AAPL Apple Options Ahead of EarningsIf you haven`t bought the dip on AAPL:
Now analyzing the options chain and the chart patterns of AAPL Apple prior to the earnings report this week,
I would consider purchasing the 255usd strike price Calls with
an expiration date of 2025-11-21,
for a premium of approximately $18.65.
If these options prove to be profitable prior to the earnings release, I would sell at least half of them.

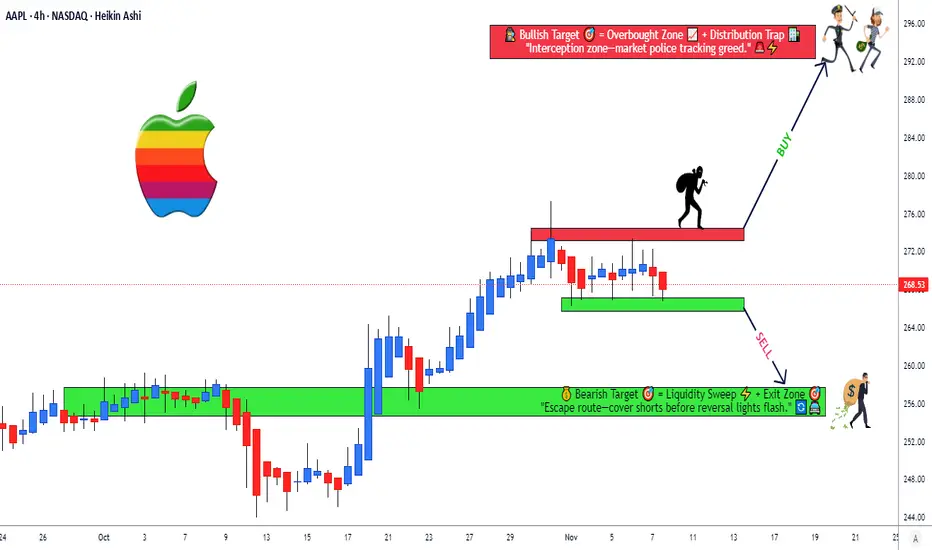
Time to sell? Too much positive press. Sell in greed I’ve fully closed my long position on Apple after an extraordinary run, with the trade playing out exactly as predicted. Now, with the AI bubble inflating and no major new product launches expected, I see a strong case for a short position. Apple is likely to correct down to its support line at $210 and potentially to the 200 EMA at $228 over the next six months. Profit-taking is evident at these levels, and declining volume suggests that selling pressure will intensify. Watch for a break below $266.88 for confirmation; consider taking profits at the CME gap at $254—or hold on and see how far the decline goes.

APPLE Next Buy Zone Apple has been one of the lagging stocks I’ve analyzed in previous posts, where I discussed its price action as a major underperformer compared to the broader indices and other large-cap stocks.
As a mega-cap company, Apple is undeniably one of the key drivers of both the index and the overall market. If Apple begins a correction, there’s a strong likelihood that the index itself will trade lower as a result.
Following the completion of a complex combination correction (W–X–Y–X–Z), where the final Z-wave forms a triangle, we can apply trend-based Fibonacci extensions to project the contractionary phases in the market based on prior structure. Since this is a corrective wave, once it completes, price action should rotate back into the broader uptrend, currently surpassing the previous high by roughly $17.
I also believe the Elliott Wave count here identifies the current structure as the top of Wave 3. The recent push into new highs appears to be a three-wave corrective structure (A–B–C), with the 1 to 1 trend-based Fibonacci extension suggesting an expansion target near $277 — potentially marking an earnings high and a “sell-the-news” opportunity or, at minimum, a take-profit zone.
If Apple starts to break down from current levels, I’d be closely watching for a move back toward the previous most-traded zone, shown as the blue Volume POC on the chart. This would align with Elliott Wave theory, which states that Wave 4 cannot overlap the high of Wave 1. Since the first correction in this structure appears to be a flat A–B–C, Wave 4 could potentially be deeper and more pronounced.
A pullback toward the $227 level would be particularly attractive to me as a long-term investment opportunity in Apple.

APPLE Set To Fall! SELL!
My dear subscribers,
APPLE looks like it will make a good move, and here are the details:
The market is trading on 270.26 pivot level.
Bias - Bearish
Technical Indicators: Both Super Trend & Pivot HL indicate a highly probable Bearish continuation.
Target - 262.56
About Used Indicators:
The average true range (ATR) plays an important role in 'Supertrend' as the indicator uses ATR to calculate its value. The ATR indicator signals the degree of price volatility.
Disclosure: I am part of Trade Nation's Influencer program and receive a monthly fee for using their TradingView charts in my analysis.
———————————
WISH YOU ALL LUCK
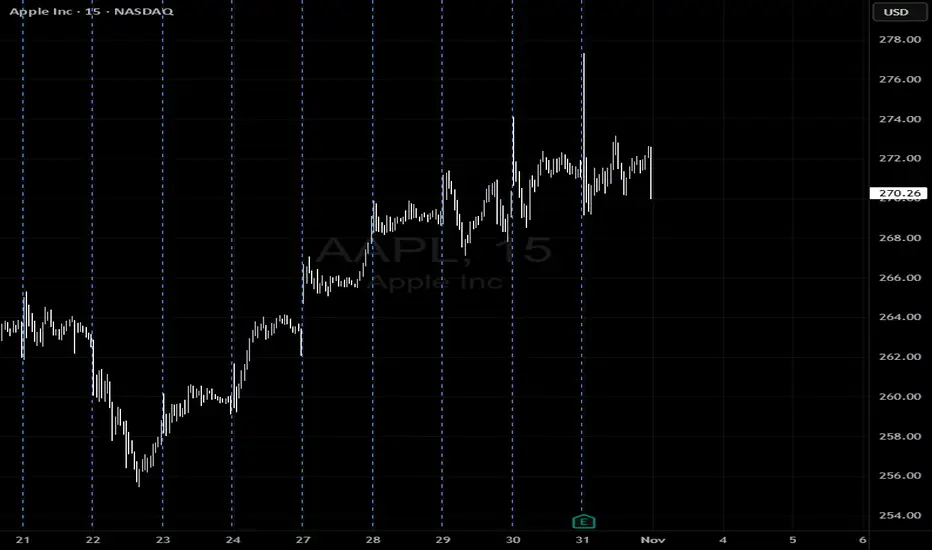
AAPL QuantSignals V3 Weekly 2025-11-01AAPL QuantSignals V3 Weekly 2025-11-01
AAPL Weekly Signal | 2025-11-01
• Direction: NEUTRAL | Confidence: 57%
• Expiry: 2025-11-07 (6 days)
• Strike Focus: $267.50
• Entry Range: $0.15
• Target 1: $0.30
• Stop Loss: $0.08
• Weekly Momentum: NEUTRAL (-0.95% 1W)
• Flow Intel: Bullish (Low P/C Ratio) | PCR 0.48
• Max Pain: $267.50 (-0.9% vs spot)
• 🔴 HIGH RISK WARNING: Use only small position size due to lower confidence and high uncertainty.
⚖️ Compliance: Educational commentary for QS Premium members only. No financial advice.
🎯 TRADE RECOMMENDATION
Direction: BUY PUTS
Confidence: 57%
Conviction Level: LOW
🧠 ANALYSIS SUMMARY
Katy AI Signal: NEUTRAL with bearish bias (Target: $267.76, -0.84% from current) - Katy predicts downward movement to $267.76 with stop at $274.09, indicating slight bearish pressure despite neutral confidence rating.
Technical Analysis: Bearish EMA alignment confirms downtrend; RSI oversold at 29.9 suggests potential bounce risk; stock trading below recent highs with 2-week negative performance (-2.39%); key resistance at $274.09 (Katy's stop level), support near max pain at $267.50.
News Sentiment: Mixed - Wells Fargo raised price target to $300 (bullish), but general market news focuses on other tech stocks; lack of strong AAPL-specific catalysts creates uncertainty for weekly movement.
Options Flow: Contradictory signals - extremely bullish flow with PCR 0.48 (heavy call buying), but max pain at $267.50 favors downward pressure; unusual volume at $298 calls suggests institutional optimism beyond weekly timeframe.
Risk Level: HIGH - Conflicting signals between Katy's bearish target and bullish options flow create elevated uncertainty; low conviction due to neutral primary bias and weak composite score (-0.10).
💰 TRADE SETUP
Expiry Date: 2025-11-07 (6 days)
Recommended Strike: $267.50
Entry Price: $0.15 - $0.15 (Use exact mid price from table)
Target 1: $0.30
Image
QS Analyst
APP
— Yesterday at 8:45 PM
(100% gain from entry)
Target 2: $0.45 (200% gain from entry)
Stop Loss: $0.08 (47% loss from entry)
Position Size: 2% of portfolio (low conviction trade)
⚡ COMPETITIVE EDGE
Why This Trade: Aligns with Katy AI's specific price target ($267.76) near max pain level ($267.50), creating confluence despite contradictory flow signals.
Timing Advantage: Oversold RSI (29.9) may provide temporary bounce, but bearish weekly trend and EMA alignment support downward move into expiration.
Risk Mitigation: Tight stop loss and small position size account for low conviction; strike selection at max pain provides gravitational pull support.
🚨 IMPORTANT NOTES
CRITICAL WARNING: Strong conflict between Katy's bearish target and bullish options flow (PCR 0.48)
This is a low-conviction trade due to neutral composite bias and weak signal strength
Consider smaller position size or avoiding trade entirely if risk tolerance is low
Monitor for any AAPL-specific news catalysts that could override technical signals
Thursday/Friday gamma risk increases as expiration approaches
📊 TRADE DETAILS 📊
🎯 Instrument: AAPL
🔀 Direction: PUT (SHORT)
🎯 Strike: 267.50
💵 Entry Price: 0.15
🎯 Profit Target: 0.30
🛑 Stop Loss: 0.08
📅 Expiry: 2025-11-07
📏 Size: 2.0
📈 Confidence: 57%
⏰ Entry Timing: N/A
🕒 Signal Time: 2025-11-01 23:45:23 EDT
🔴 HIGH RISK WARNING: Use only small position size due to lower confidence and high uncertainty.
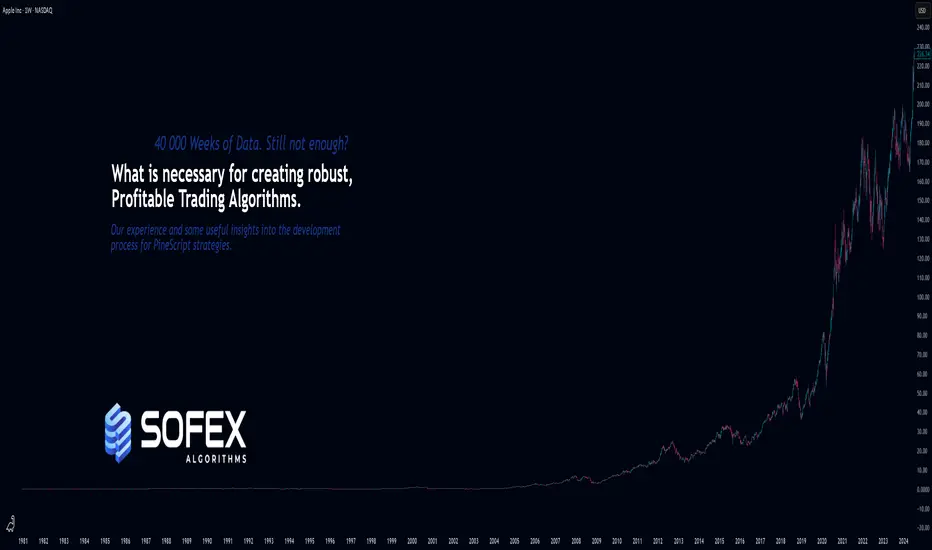
A few important steps for creating robust and winning StrategiesAs the title says, I want to share knowledge & important insights into the best practices for creating robust, trustworthy and profitable trading Strategies here on TradingView.
These bits of information that my team I have gathered throughout the years and have managed to learn through mostly trial and error. Costly errors too .
Many of these points more professional traders know, however, there are some that are quite innovative for all levels of experience in my opinion. Please, feel free to correct me or add more in the comments.
There are a few strategic and tactical changes to our process that made a noticeable difference in the quality of Strategies and Indicators immediately.
Firstly and most importantly, we have all heard about it, but it is having the most data available. A good algorithm, when being built NEEDS to have as many market situations in its training data as possible. Choppy markets, uptrends, downtrends, fakeouts, manipulations - all of these are necessary for the strategy to learn the possible market conditions as much as possible and be prepared for trading on unknown data.
Many may have heard the phrase "History doesn't repeat itself but rhymes well" - you need to have the whole dictionary of price movements to be able to spot when it rhymes and act accordingly.
The TradingView Ultimate plan offers the most data in terms of historical candles and is best suited for creating robust strategies.
___
Secondly, of course, robustness tests. Your algorithm can perform amazingly on training data, but start losing immediately in real time, even if you have trained it on decades of data.
These include Monte-carlo simulations to see best and worst scenarios during the training period. Tests also include the fundamentally important out-of-sample checks . For those who aren’t familiar - this means that you should separate data into training sets and testing sets. You should train your algorithm on some data, then perform a test on unknown to the optimization process data. It's common practice to separate data as 20% training / 20% unknown / 20% training etc. to build a data set that will show how your algorithm performs on unknown to it market movements. Out of sample tests are crucial and you can never trust a strategy that has not been through them.
Walk-forward simulations are similar - you train your algorithm on X amount of data and simulate real-time price feeds and monitor how it performs. You can use the Replay function of TradingView to do walk-forward tests!
When you are doing robustness tests, we have found that a stable strategy performs around 90% similarly in terms of win rate and Sortino ratio compared to training data. The higher the correlation between training performance and out of sample performance, the more risk you can allocate to this algorithm.
___
Now lets move onto some more niche details. Markets don’t behave the same when they are trending downward and when they are trending upwards. We have found that separating parameters for optimization into two - for long and for short - independent of each other, has greatly improved performance and also stability.
Logically it is obvious when you look at market movements. In our case, with cryptocurrencies, there is a clear difference between the duration and intensity of “dumps” and “pumps”. This is normal, since the psychology of traders is different during bearish and bullish periods. Yes, introducing double the amount of parameters into an algorithm, once for long, once for short, can carry the risk of overfitting since the better the optimizer (manual or not), the better the values will be adjusted to fit training data. But if you apply the robustness tests mentioned above, you will find that performance is greatly increased by simply splitting trade logic between long and short. Same goes for indicators.
Some indicators are great for uptrends but not for downtrends. Why have conditions for short positions that include indicators that are great for longs but suck at shorting, when you can use ones that perform better in the given context?
___
Moving on - while overfitting is the main worry when making an algorithm, underoptimization as a result of fear of overfitting is a big threat too . You need to find the right balance by using robustness tests. In the beginning, we had limited access to software to test our strategies out of sample and we found out that we were underoptimizing because we were scared of overfitting, while in reality we were just holding back the performance out of fear. Whats worse is we attributed the losses in live trading to what we thought was overfitting, while in reality we were handicapping the algorithm out of fear.
___
Finally, and this relates to trading in general too, we put in place very strict rules and guidelines on what indicators to use in combination with others and what their parameter range is. We went right to theory and capped the values for each indicator to be within the predefined limits.
A simple example is MACD . Your optimizer might make a condition that includes MACD with a fast length of 200, slow length of 160 and signal length of 100. This may look amazing on backtesting and may work for a bit on live testing, but these values are FUNDAMENTALLY wrong (Investopedia, MACD). You must know what each indicator does and how it calculates its values. Having a fast length bigger than the slow one is completely backwards, but the results may show otherwise.
When you optimize any strategy, manually or with the help of a software, be mindful of the theory. Mathematical formulas don’t care about the indicator’s logic, only about the best combination of numbers to reach the goal you are optimizing for - be it % Return, Profit Factor or other.
Parabolic SAR is another one - you can optimize values like 0.267; 0.001; 0.7899 or the sort and have great performance on backtesting. This, however, is completely wrong when you look into the indicator and it’s default values (Investopedia, Parabolic SAR).
To prevent overfitting and ensure a stable profitability over time, make sure that all parameters are within their theoretical limits and constraints, ideally very close to their default values.
Thank you for reading this long essay and I hope that at least some of our experience will help you in the future. We have suffered greatly due to things like not following trading theory and leaving it all up to pure mathematical optimization, which is ignorant of the principles of the indicators. The separation between Long / Short logic was also an amazing instant improvement.
View the linked idea where we explain the psychology of risk management and suggest a few great ways to calculate and manage your risk when trading - just as important as the strategy itself!
What do you think? Do you use any of these methods; Or better ones?
Let us know in the comments.
AAPLHow to become successful in forex and stock trading:
1.Master fundamentals and technical analysis.
2.Build and follow a solid trading plan.
3.Apply strict risk management (4–6% rule).
4.Stay disciplined—control fear and greed.
5.Record and analyze every trade.
6.Focus on high-quality setups only.
7.Diversify across assets and markets.
8.Keep evolving—study, adapt, and grow daily.
Shipping, Freight, and Logistics in World Trade1. The Importance of Shipping in Global Trade
Shipping is the lifeline of international trade. Around 90% of world trade by volume is transported by sea, making maritime transport the most cost-effective and energy-efficient mode for moving large quantities of goods over long distances. Without global shipping, the modern economy would collapse—no country could sustain its industries or consumer demand without importing raw materials, energy, and manufactured products.
The shipping industry supports the global supply chain, linking developing nations that supply raw materials with developed economies that manufacture and consume finished goods. For instance, crude oil from the Middle East is transported to refineries in Asia and Europe, while electronics from East Asia are shipped to markets in North America and Africa. This interdependence underscores shipping’s role as the engine of globalization.
2. Understanding Freight in International Trade
Freight refers to the transportation of goods in bulk by various modes—sea, air, rail, or road. Freight services determine how products move from one point to another and how efficiently they reach their destinations. Freight is typically divided into three main categories:
Sea Freight – Used for large and heavy shipments, ideal for commodities such as oil, coal, grain, machinery, and vehicles. Containerization has revolutionized sea freight, enabling efficient and secure movement.
Air Freight – Offers the fastest mode of delivery, mainly for perishable or high-value items like electronics, pharmaceuticals, and luxury goods.
Land Freight (Rail and Road) – Connects ports to inland cities and neighboring countries, playing a vital role in regional trade and last-mile delivery.
Freight costs significantly affect product pricing and competitiveness in the global market. Efficient freight management reduces transportation costs and delivery times, making products more affordable and accessible.
3. The Role of Logistics in World Trade
Logistics refers to the planning, coordination, and management of the movement and storage of goods throughout the supply chain—from production to the final customer. It is the strategic process that integrates shipping and freight into a seamless operation.
Key elements of logistics include:
Transportation Management – Selecting the best mode of transport and optimizing routes.
Warehousing – Storing goods safely before they are distributed or sold.
Inventory Management – Ensuring supply meets demand without overstocking.
Customs Clearance – Handling documentation and compliance with international trade regulations.
Last-Mile Delivery – Delivering goods from distribution centers to consumers.
Modern logistics rely heavily on technology, including GPS tracking, warehouse automation, and data analytics, which provide real-time visibility and improve decision-making.
4. Evolution of Global Shipping and Logistics
The modern logistics industry has come a long way since the days of wooden ships and manual cargo handling. The container revolution in the 1950s, introduced by Malcolm McLean, transformed global trade. Standardized containers allowed goods to be loaded, shipped, and unloaded efficiently across ships, trains, and trucks, drastically reducing costs and time.
The digital revolution of the 21st century further enhanced logistics efficiency. Artificial intelligence, blockchain, and Internet of Things (IoT) technologies now streamline supply chains, track shipments in real time, and reduce human error. E-commerce giants like Amazon and Alibaba have set new standards in global logistics, emphasizing speed, reliability, and transparency.
5. Major Global Shipping Routes
World trade depends on critical maritime routes that connect producers and consumers. Some of the most vital shipping routes include:
The Suez Canal (Egypt): Links Europe and Asia via the Mediterranean and Red Seas.
The Panama Canal (Central America): Connects the Atlantic and Pacific Oceans, crucial for trade between the Americas and Asia.
The Strait of Malacca (Southeast Asia): One of the busiest routes connecting the Indian and Pacific Oceans.
The English Channel and Gibraltar Strait: Important for European trade.
Disruptions in these routes—such as the Suez Canal blockage in 2021—can cause massive delays and losses across global supply chains, showing how fragile yet essential maritime networks are.
6. Key Players in Global Shipping and Logistics
Several major companies dominate international shipping and logistics:
Shipping Lines: Maersk, MSC, CMA CGM, and COSCO handle millions of containers annually.
Freight Forwarders: DHL, FedEx, and Kuehne+Nagel provide end-to-end logistics solutions.
Port Operators: DP World, PSA International, and Hutchison Ports manage the world’s busiest ports.
Ports such as Shanghai, Singapore, Rotterdam, and Dubai’s Jebel Ali are global trade hubs, facilitating the import and export of goods worldwide.
7. Challenges Facing the Shipping and Logistics Industry
Despite its importance, the global shipping and logistics industry faces several challenges:
Supply Chain Disruptions: Events like the COVID-19 pandemic, wars, or natural disasters expose vulnerabilities in global supply chains.
Rising Fuel Costs: Shipping is heavily dependent on oil, and fluctuations in fuel prices directly affect freight rates.
Environmental Regulations: Pressure to reduce carbon emissions has forced the industry to invest in cleaner fuels and green technologies.
Port Congestion: Overcrowded ports lead to delays and increased costs, especially during peak trade periods.
Geopolitical Tensions: Trade wars and sanctions can reroute or restrict global shipping flows.
8. Green and Sustainable Shipping
Sustainability has become a key priority for the maritime industry. The International Maritime Organization (IMO) has set targets to reduce carbon emissions by 50% by 2050. Innovations such as LNG-powered ships, wind-assisted propulsion, and electric container vessels are being developed. Companies are also investing in carbon offset programs and exploring hydrogen fuel as a cleaner alternative.
Green logistics also focus on reducing waste, optimizing routes, and using eco-friendly packaging materials, contributing to a more sustainable global trade ecosystem.
9. The Future of Global Logistics
The future of logistics lies in automation, digitalization, and resilience. Emerging technologies are reshaping the industry:
Artificial Intelligence (AI): Enhances demand forecasting and route optimization.
Blockchain: Provides secure and transparent documentation for international transactions.
Autonomous Ships and Drones: Expected to revolutionize cargo transport and delivery.
Smart Ports: Use IoT sensors and data analytics to streamline operations.
Moreover, the rise of regional trade agreements and nearshoring (relocating production closer to consumers) is redefining supply chains to reduce risks and costs.
10. Conclusion
Shipping, freight, and logistics are the invisible engines powering world trade. They connect nations, support industries, and ensure that goods flow seamlessly across borders. As globalization deepens and technology advances, the logistics sector continues to evolve, balancing efficiency, sustainability, and resilience.
However, the challenges of environmental impact, geopolitical instability, and supply chain vulnerabilities demand innovation and cooperation. The future of global trade depends on a smarter, greener, and more adaptive logistics network—one capable of sustaining the demands of an interconnected world while protecting the planet for generations to come.
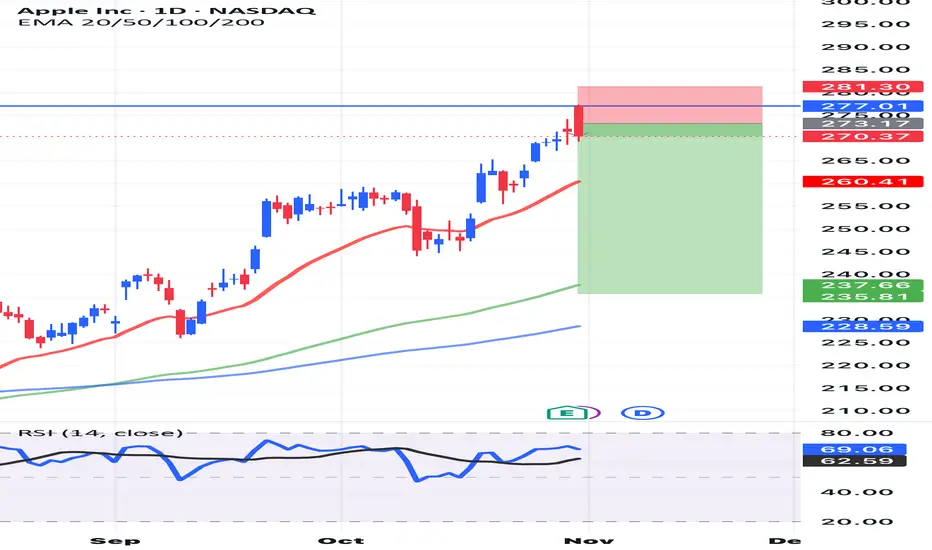
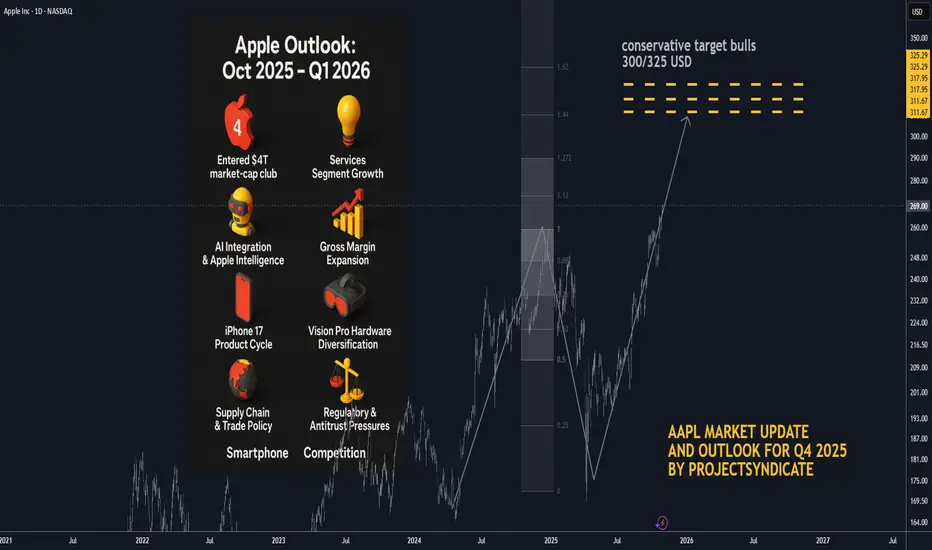
AAPL: Q1 2026 Target and Updated Outlook BULLS🍏 Apple Outlook: Oct 2025 – Q1 2026
🧠 Status and Tape Read. Apple (AAPL) has entered the $4 T market-cap club on Oct 28–29 2025, propelled by strong iPhone 17 sell-through and Services momentum. Shares pushed toward the $270 area intraday before easing, marking a powerful reversal from mid-year consolidation. Near-term, positioning is elevated into Thursday’s print; options imply ~±4% move on earnings.
📈 Path into Q1’26. Our base case shifts from a prolonged correction to a higher-low / buy-the-dip regime: dips toward the mid-$240s–$250s should attract sponsorship unless Services rolls over or China iPhone demand fades. A constructive tape through Q1’26 hinges on (1) Apple Intelligence engagement metrics, (2) iPhone 17 replacement/Android switcher rates, and (3) regulatory overhang.
📰 What’s New and recent headlines
🏆 Apple hits $4 T market value for the first time, joining Nvidia and Microsoft. Drivers: iPhone 17 traction and Services strength; stock up sharply since spring.
🗓️ Earnings set for Thu, Oct 30 (after-close); Street looking for growth in revenue/EPS; Services eyed >$100 B annual run-rate.
🔼 Loop Capital upgraded AAPL to Buy with $315 PT ahead of the move, citing iPhone cycle acceleration.
🧾 “Who Bought 8 Million Shares?”
🧺 JPMorgan Large Cap Growth Fund (SEEGX) increased its Apple position by ~8.15 million shares to ~32.9 million shares, per latest fund tracking.
⚙️ Catalysts Shaping Apple’s Stock Price in 2025–26
🤖 AI Integration & Apple Intelligence — Strength: 9/10
Rollout of on-device Apple Intelligence and upgraded Siri remains the core narrative into 2026. Look for user engagement datapoints and third-party app integrations at/after earnings. A positive read-through would validate the iPhone super-cycle argument.
💡 Services Segment Growth — Strength: 8.5/10
Consensus expects Services to push past a $100 B annual clip; durability watched versus regulatory pressure (DMA in EU, global app store scrutiny). A sustained >13% YoY growth print keeps multiple support intact.
📊 Gross Margin Expansion & Cost Efficiencies — Strength: 8/10
Management has guided 46–47% GM for FQ4 (tariff headwind embedded). Mix shift to Services + component deflation support FY26 margin resilience.
📱 iPhone 17 Product Cycle — Strength: 8/10 (↑ from 7.5)
Early sell-through outpacing prior gen in the U.S. and China within first days; the iPhone 17 (incl. “Air”) is the incremental driver restoring unit momentum.
🥽 Vision Pro & Hardware Diversification — Strength: 7/10
Next-gen devices + Apple Intelligence tie-ins create optionality; still niche near-term but adds ecosystem gravity.
💵 Capital Returns — Strength: 7/10
$110 B buyback authorization remains a floor; watch cadence vs. stock at ATHs and post-print cash deployment commentary.
🌏 Supply Chain & Trade Policy — Strength: 6.5/10
China exposure/tariffs remain a swing factor; Apple has been absorbing some costs rather than pushing through prices on key models.
⚖️ Regulatory & Antitrust Pressures — Strength: 6/10
DMA compliance and global app store cases could trim Services take-rate; monitor any remedial changes called out on the call.
📈 Macro & Rates — Strength: 5/10
“Higher for longer” limits multiple expansion; any disinflation/soft-landing upside would expand P/E support.
🥊 Smartphone Competition — Strength: 5/10
Android OEM velocity still high in EM; Apple’s cycle needs sustained switcher share to outrun.
💼 Earnings Set-Up: FQ4 reporting Thu Oct 30 2025
📅 Consensus into print:
• Revenue: ~$101–104 B (TipRanks ref: $102.2 B)
• EPS: ~$1.74–$1.82 (TipRanks ref: $1.78)
• Gross Margin guide: 46–47% (company indication)
• Services: watch for >$100 B annualized pace confirmation
• Implied move: options pricing ~±4%
🎧 Watch items on the call: Apple Intelligence activation/MAUs, iPhone 17 channel inventory, China mix, Services take-rate headwinds (EU), GM puts/takes (tariffs), cap-return cadence.
🎯 Street Positioning & Targets
🔼 Loop Capital: Buy, PT $315 (Oct 20/21 2025).
📊 General take: Many houses remain Overweight; focus turning to 2026 EPS power and AI monetization path.
🧭 Tactical View 0–3 Months
📈 Into/after print: Choppy but constructive. Chasing at ATHs is risky; prefer buy-on-weakness zones near $248–255 with stop discipline. A bullish guide/Services beat could sustain a breakout; a light AI engagement update or China wobble likely gets faded back into the mid-$250s.
⚠️ Risk-case: Regulatory headline or guide below mid-single-digit growth could quickly compress P/E and retest the $240s.
🚀 Bull-case: Clean beat/raise + AI usage KPIs → re-rate toward $290–300 into holiday.
🏁 Quick Milestone Recap
🥇 $4 Trillion Market Cap achieved on Oct 28–29 2025, making Apple the third public company (after Nvidia, Microsoft) to reach the level; iPhone 17 momentum and Services strength cited across coverage.
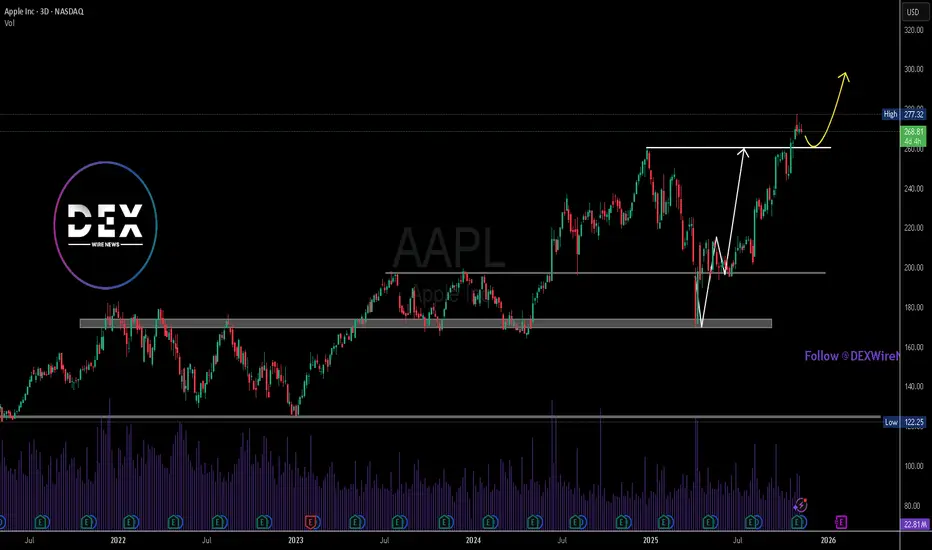
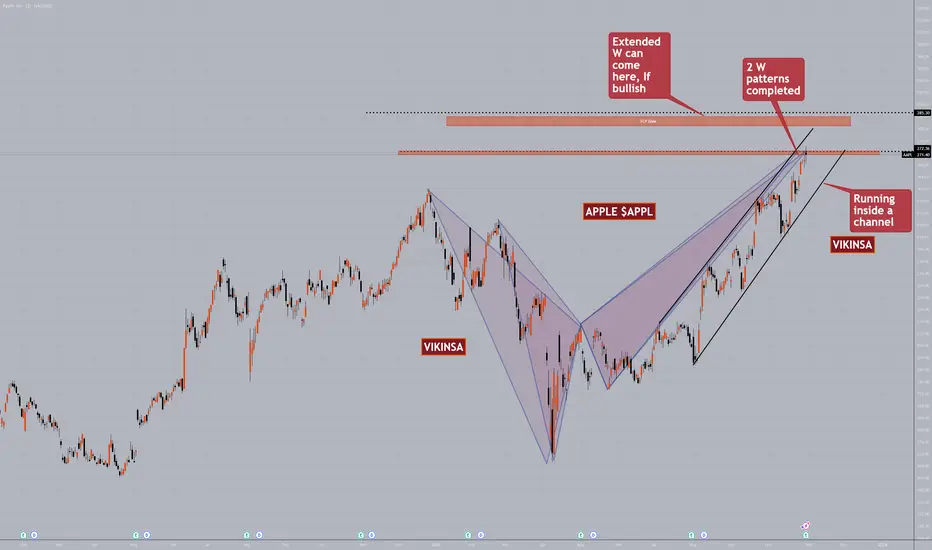
Is APPLE $APPL ready and primed for a correction?Apple BSE:APPL had a great run so far in the past few weeks. It has also been running inside a channel which has pushing the price upwards. However, now it has just completed an extended W pattern. In fact 2 of them got completed exactly at the same level.
The current price level is something that needs to eb watched very closely. When W patterns complete, markets tend to have a correction. Market is still bullish and is still inside the channel so even if the correction comes, we will have to be careful with the shorts.
If the market stay bullish from this point above at least on daily/weekly basis then we have an upper FCP zone where it can reach possibly take a correction from there.
In all cases, we must remember to wait for confirmations and obviously manage the risk.
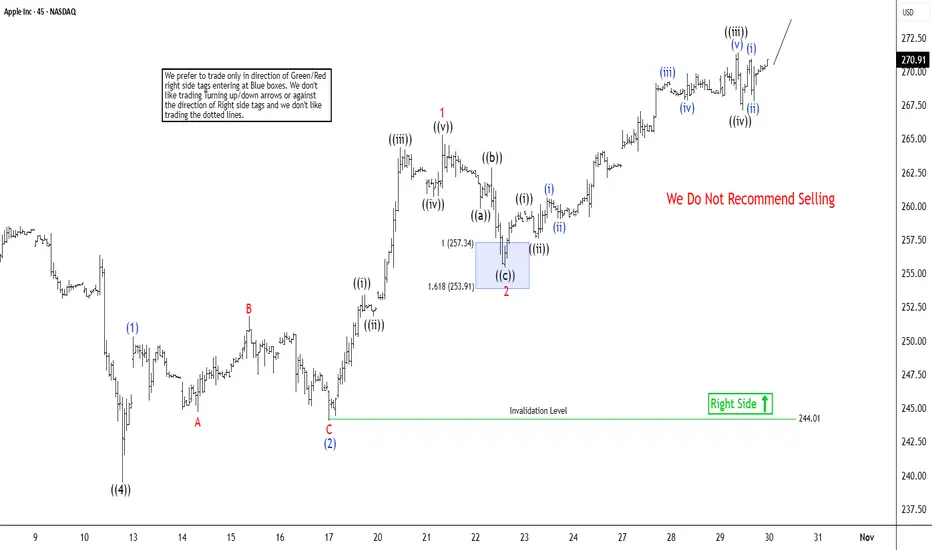
AAPL in Wave ((5)) to New All-Time High as Nested PatternApple (AAPL) has surged to a new all-time high, extending an impulse wave that began from the April 2025 low. Wave ((4)) of this larger impulse concluded at $239.49, as clearly illustrated on the 45-minute chart. Now, wave ((5)) advances higher in the form of a nested impulse structure. Rising from the wave ((4)) base, wave (1) completed at $250.65 before wave (2) pulled back to $244.01. From there, the stock nested upward again, with wave 1 ending at $265.29 and wave 2 correcting to $255.43. Apple then extended further in wave 3, which itself unfolds as an impulse of lesser degree.
Within wave 3, wave ((i)) topped at $259.67, followed by a dip in wave ((ii)) to $257.55. Wave ((iii)) pushed higher to $271.41, and wave ((iv)) retraced to $267.11. Wave ((v)) of 3 should finish soon, leading to a pullback in wave 4 before the uptrend resumes with renewed strength.In the near term, the bullish outlook remains intact as long as the pivot low at $244.01 holds. Any dips are likely to find support in 3, 7, or 11 swing sequences, setting the stage for continued upside. This Elliott Wave progression underscores persistent momentum, with nested impulses reinforcing the primary trend and positioning Apple for additional gains ahead.