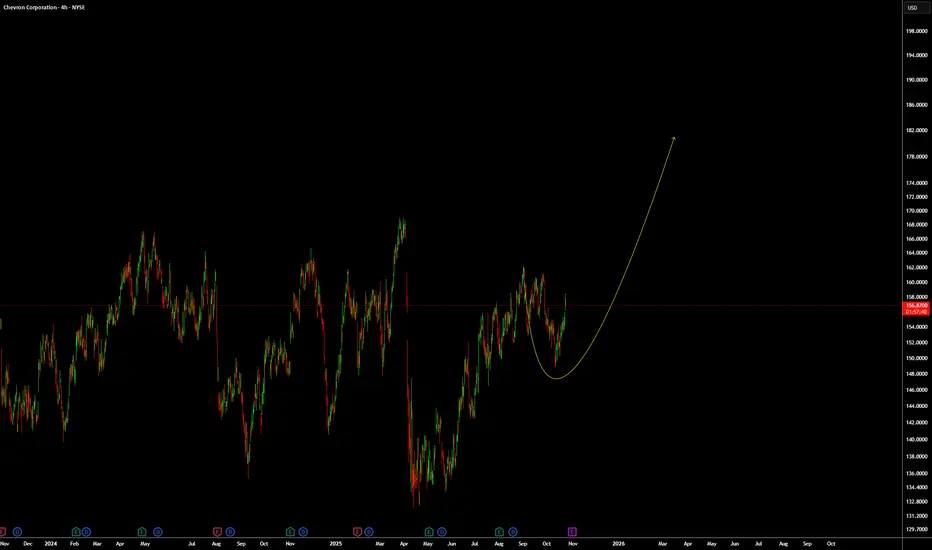
Update for CVX: Looking for an up move/wave.
As discussed before in our previous post, NYSE:CVX looks like it will go up, it did go up so if you are in manage your trades. We can see pushing higher and lets see how far will it go.
For reference, this is our previews chart:
Always remember WTW 4 Golder Rules:
1) Do not jump in
2) Do not over risk/trade
3) Do not trade without Stop Loss
4) Never ever add to a losing position!
Trade with care
We Trade Waves
WTW Team
Disclosure: We are part of Trade Nation's Influencer program and receive a monthly fee for using their TradingView charts in our analysis.
Trade ideas
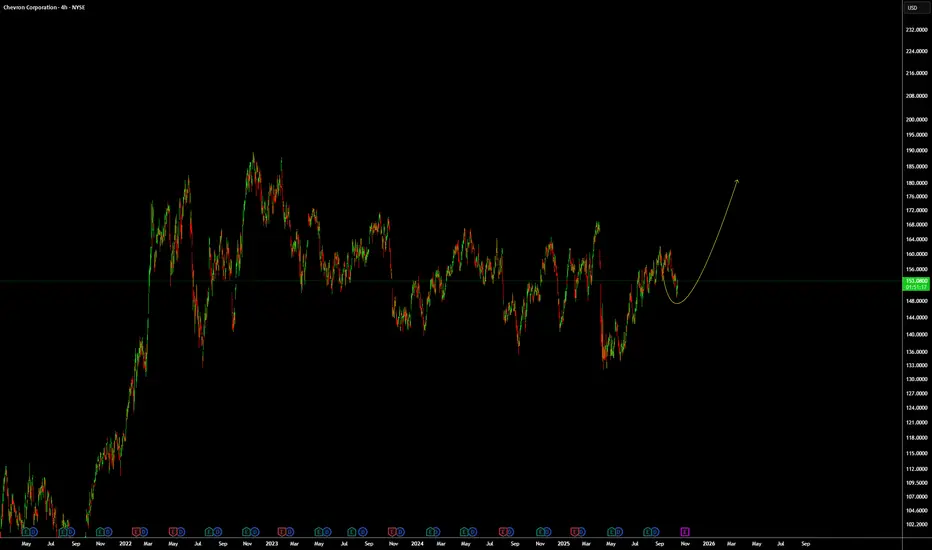
CVX: Looking for an up move/wave.From a technical point of view and based on WTW Concept, NYSE:CVX looks like it will go up.
We Trade Waves
WTW Team
Disclosure: We are part of Trade Nation's Influencer program and receive a monthly fee for using their TradingView charts in our analysis.
Remember that 4hour chart because it's your Entry Have you ever thought one day it will happen?
You look straight into your blind spot.And you say one day I will see.
You look straight into your life,
Knowing tomorrow won't change and say "it will change"
This is where you find comedy.
Its not trying to be funny it's funny when you see yourself being yourself without someone trying to stop you .
What of your friends and family how can they stop you froming manipulating them?
How can you stop you from convincing yourself from not doing a habit you built?
Look at the 4h chart.
That's your entry now outside consolidations you want a high volume "elite" pattern get your entry
On the 4hour chart.
Its not automation it's a manual process the last part of trading is you checking the 4hour chart.
Make sure the price crosses or touches support on this time frame.
This is where you will shine as ab expert trader.
The 4hour chart is your entry .
Rocket 🚀 Rocket this content to learn more.
Disclaimer ⚠️ Trading is risky please learn about risk management and profit taking strategies.
Also feel free to use a simulation trading account before you use real money.

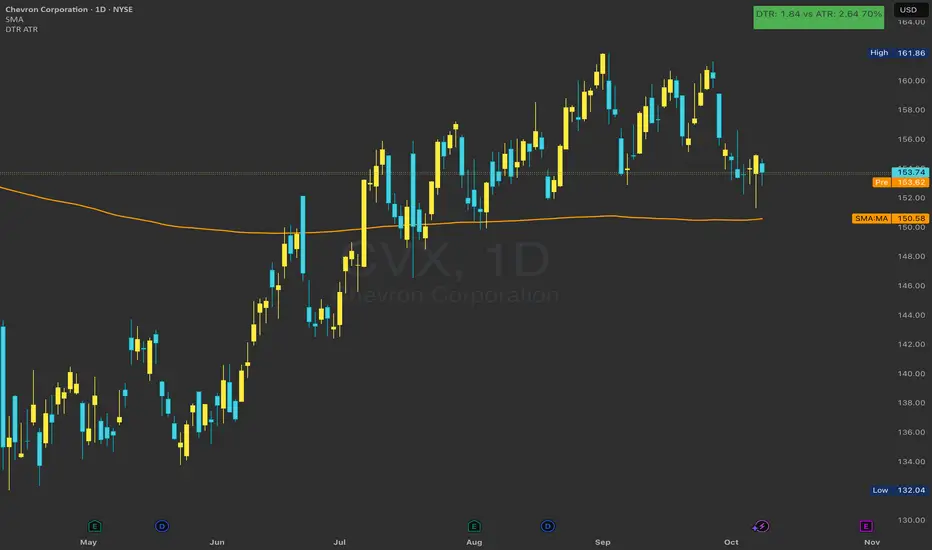
$CVX: The calm before the storm. We're watching a beautiful consolidation on the daily chart. Price is coiled between $152.00 and $154.50.
This is not a time for guesswork. This is an IMMINENT BREAKOUT. This is how I’m viewing the setup for today.
• BULLISH Trigger: A 2-Up candle break above the recent high of $154.50. Target the $156.00 resistance first.
• BEARISH Trigger: A 2-Down candle break below the recent low of $152.00. Target $150.00 and the 200-day MA.
Which way does the oil giant move today?
$CVX Call Alert – Oct 31 ’25 $155 Calls | 33% ROI PotentialEnter: NYSE:CVX OCT 31 2025 $155 CALLS
Buy in Price: $3.10 - $3.15
Take Profit: $4.12
Stop Bleeding: $2.73
ROI Potential: 33%
Exit Within: 361 Minutes
Oil/Bonds Just Flipped 5-year Support into ResistanceOil-to-bonds SR-flipped this 5-year support
US10Y not as neat and tidy, but close to the same and correlated

return to proven buyers provides cheap entry 1->4 :
* number 3 closes above number 1, this
establishes number 2 as a set of proven market
participants, at number 4 we return to these
proven players, price moves up then returns giving a
chance for an entry near the buyers proven ground
next?
* anchored vwap at number 1 shows price returning
to the 1st standard deviation, intersecting
with an uptrend line at the same time
* a large cluster of volume is around number 4 ,
with a gap of volume above, the gap being a popular
rejection area and the high volume cluster
could protect buyers from further downside movement
* price makes a lower low, but rsi,mfi and cvd makes a
higher low, mfi and rsi are both oversold, cvd indicator
pierces lower bollinger band hinting at potential upside

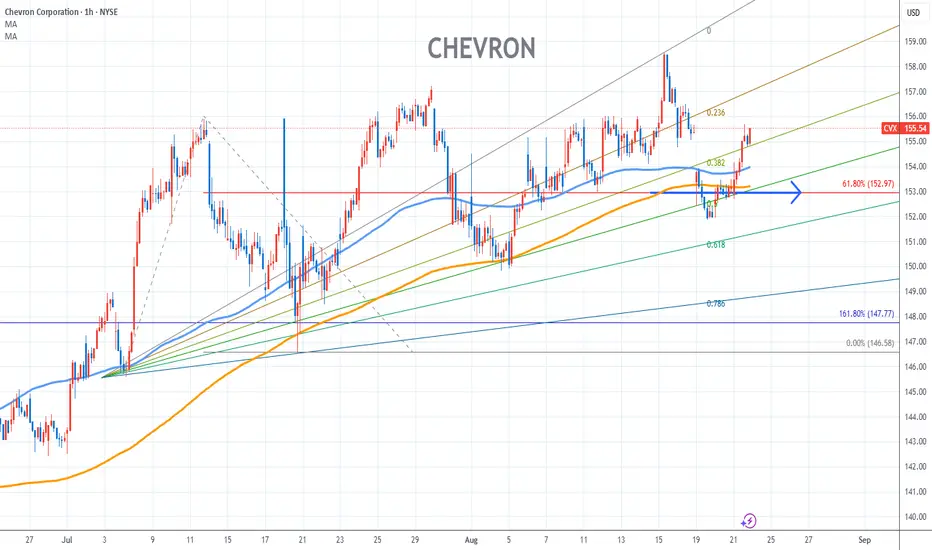
Chevron Stock Chart Fibonacci Analysis 082125Trading Idea
1) Find a FIBO slingshot
2) Check FIBO 61.80% level
3) Entry Point > 153/61.80%
Chart time frame:B
A) 15 min(1W-3M)
B) 1 hr(3M-6M)
C) 4 hr(6M-1year)
D) 1 day(1-3years)
Stock progress:A
A) Keep rising over 61.80% resistance
B) 61.80% resistance
C) 61.80% support
D) Hit the bottom
E) Hit the top
Stocks rise as they rise from support and fall from resistance. Our goal is to find a low support point and enter. It can be referred to as buying at the pullback point. The pullback point can be found with a Fibonacci extension of 61.80%. This is a step to find entry level. 1) Find a triangle (Fibonacci Speed Fan Line) that connects the high (resistance) and low (support) points of the stock in progress, where it is continuously expressed as a Slingshot, 2) and create a Fibonacci extension level for the first rising wave from the start point of slingshot pattern.
When the current price goes over 61.80% level , that can be a good entry point, especially if the SMA 100 and 200 curves are gathered together at 61.80%, it is a very good entry point.
As a great help, tradingview provides these Fibonacci speed fan lines and extension levels with ease. So if you use the Fibonacci fan line, the extension level, and the SMA 100/200 curve well, you can find an entry point for the stock market. At least you have to enter at this low point to avoid trading failure, and if you are skilled at entering this low point, with fibonacci6180 technique, your reading skill to chart will be greatly improved.
If you want to do day trading, please set the time frame to 5 minutes or 15 minutes, and you will see many of the low point of rising stocks.
If you want to prefer long term range trading, you can set the time frame to 1 hr or 1 day
Bull Flag or Death Cross?My Target is 218 for this structure, keep in mind I entered lower. This could be a trick one but the RSI is signaling minor bullish divergence

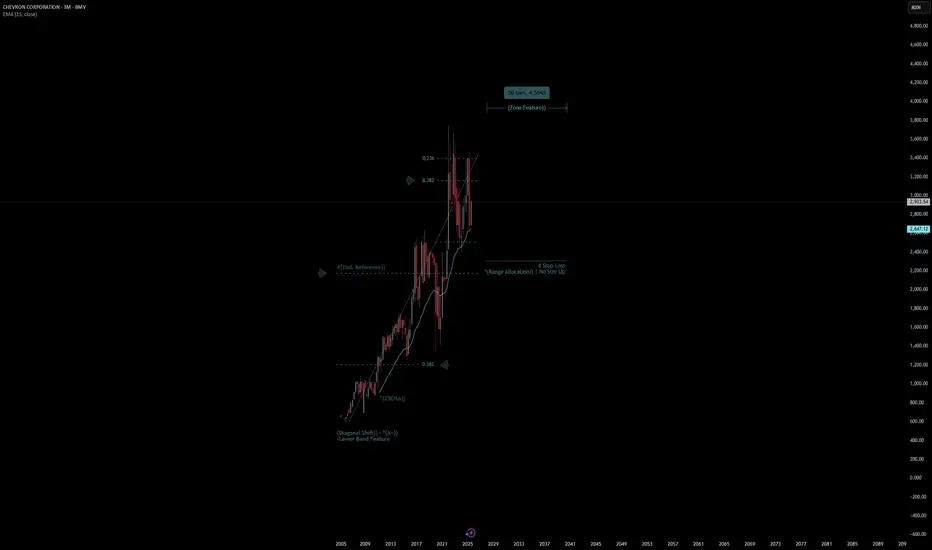
Chevron Corporation | Chart & Forecast SummaryKey Indicators On Trade Set Up In General
1. Push Set Up
2. Range Set Up
3. Break & Retest Set Up
Notes On Session
# Chevron Corporation
- Double Formation
* (Diagonal Shift)) - *(A+)) - *Lower Band Feature | Subdivision 1
* #(2nd. Reference)) | Completed Survey
* 50 bars, 4564d | Date Range Method - *(Uptrend Argument))
- Triple Formation
* (P1)) / (P2)) & (P3)) | Subdivision 2
* 3 Monthly Time Frame | Trend Settings Condition | Subdivision 3
- (Hypothesis On Entry Bias)) | Indexed To 100
* Stop Loss Feature Varies Regarding To Main Entry And Can Occur Unevenly
- Position On A 1.5RR
* Stop Loss At 305.00 MXN
* Entry At 400.00 MXN
* Take Profit At 540.00 MXN
* (Uptrend Argument)) & No Pattern Confirmation
- Continuation Pattern | Not Valid
- Reversal Pattern | Not Valid
* Ongoing Entry & (Neutral Area))
Active Sessions On Relevant Range & Elemented Probabilities;
European-Session(Upwards) - East Coast-Session(Downwards) - Asian-Session(Ranging)
Conclusion | Trade Plan Execution & Risk Management On Demand;
Overall Consensus | Buy
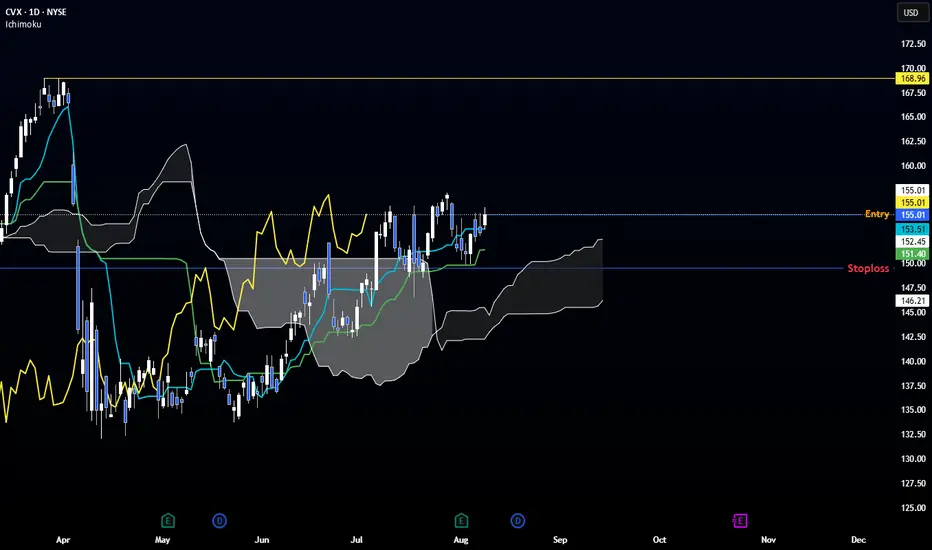
CVX – Ichimoku Bullish Setup
📈 Technical Outlook
☁ Kumo: Large & supportive. Span A flat (pause), Span B bullish.
🔹 Tekan-sen: Broken to downside.
🔹 Kijun-sen: Bounce & pointing up → trend strength.
📍 Chikou Span: Above price → bullish confirmation.
💡 Bias → High probability of upside continuation.
📊 Trade Plan
Entry: 155.01
Stop Loss: 149.55 (below last swing low)
Take Profit: None – trail SL at each new swing low
🎯 Potential Target Zone: 168.96 (major resistance)
⚠ Risk Management
This setup follows Ichimoku principles—let winners run, cut losses early.
Not financial advice. Trade at your own risk.
CVX Earnings Trade Setup — August 1, 2025
## 🚨 CVX Earnings Trade Setup — August 1, 2025 🚨
🔍 **Chevron (CVX) Earnings Analysis | High Conviction Call Play**
### 🧠 Model Consensus (Multi-LLM Blend)
* 📉 **Revenue Trend:** -1.0% TTM growth, margin pressure from falling oil
* 📈 **Analyst EPS Expectation:** \$11.04 with 26.2% YoY growth est.
* ⚠️ **Miss Rate:** 50% EPS beats w/ average surprise -2.2%
* 💬 **Consensus Sentiment:** ⚖️ *Moderate Bullish (Confidence: 60%)*
---
### 🔥 Options Heatmap
* 🟢 **Most Active Call:** \$152.50 strike, 🔥 ask volume at 152
* 🔺 **IV Rank:** 63% → *Moderate move expected*
* 🧊 **Put/Call Skew:** Defensive bias with light bullish divergence
* 🕵️♂️ **Dark Pool:** Mild accumulation hints by institutions
---
### 📉 Technical Breakdown
* 🔹 Near 50/200 MA — Neutral Pre-Earnings Drift
* 🔸 Support: \$150 | Resistance: \$155
* 🔻 Volume: 0.53x avg → *Weak conviction*
---
## 🎯 TRADE SETUP
🛠️ **Strategy:** Long Call (Pre-Earnings Entry)
💰 **Strike:** \$152.50
📅 **Expiry:** 2025-08-01
💸 **Entry Price:** \$3.70
🧠 **Profit Target:** \$11.10+ (200–300%)
🛑 **Stop Loss:** \$1.85
📊 **Risk/Reward:** \~2.5:1
🕓 **Exit Timing:** 1–2 hrs post-earnings (to avoid IV crush)
---
### 🧪 Earnings Catalyst Trade
Chevron’s setup shows a **classic low-volume/high-upside IV play**. Risk tightly managed with a defined stop, but room for explosive move if earnings surprise to upside.
---
📦 **Trade JSON Snapshot:**
```json
{
"instrument": "CVX",
"direction": "call",
"strike": 152.50,
"expiry": "2025-08-01",
"confidence": 60,
"profit_target": 11.10,
"stop_loss": 1.85,
"size": 1,
"entry_price": 3.70,
"entry_timing": "pre_earnings_close",
"earnings_date": "2025-08-01",
"earnings_time": "AMC",
"expected_move": 5.0,
"iv_rank": 0.63,
"signal_publish_time": "2025-08-01 13:05:25 UTC-04:00"
}
```
---
📈 **#OptionsFlow #CVX #EarningsPlay #TradingViewSetups #LongCall #EnergySector #IVCrushProtection #PreEarningsTrade**

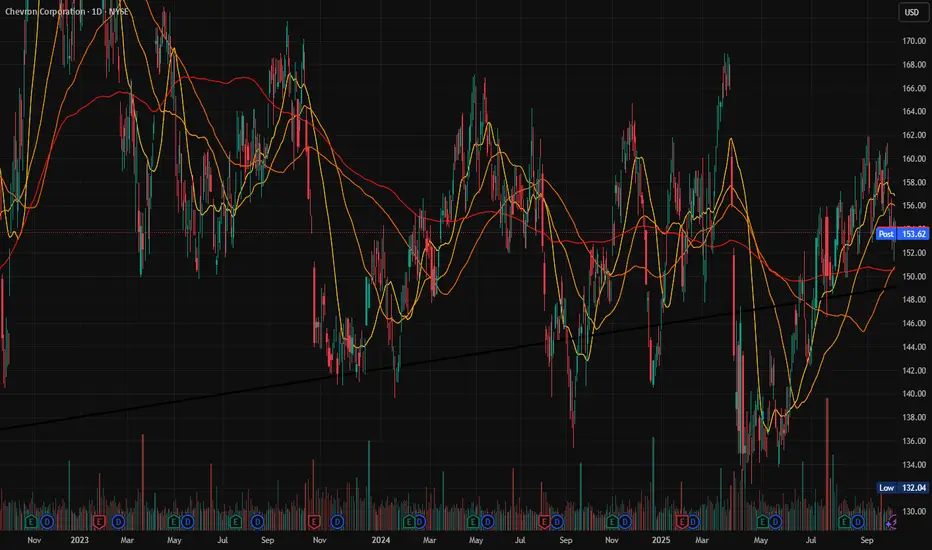
CVX & XOM: The Bull case for OilI review the the Daily and Weekly charts on CVX & XOM, showing tradable patterns that they have formed since 2022. These are longer term trading patterns but are still active and fun to watch.

CVX - Potential Swing Upside - Mid TermTimeline - now to 3 months
1. Bullish flag pattern sustained, form during Oct 2021.
2. Rounding bottom above 1D resistance at $130
- Last close is above Fib 88.6% - $154.36
- In the 2 days, weak selling pressure is noticed.
3. More attempts to break 88.6% Fib level opposed to $130 support line
- Bullish angle upthrust stays above 45 degrees
- Concludes high change of breaking 88.6% fib level, towards previous high of $169.66
3. Entry points
EP 1 - buy spot with 1 or 0.5 size
EP 2 - Enter another 1 or 0.5 size if closing prices stay above Fib 78.6% at $141.56

CVX Trade Setup — Catch the Bounce + Dividend PlayChevron ( NYSE:CVX ) is setting up for a potential bounce from strong support around $134.96 (S2 level). The trade aligns with both technical and fundamental tailwinds:
🟢 Technical Setup:
Holding just above S2, showing signs of base formation.
Clear risk/reward box:
Entry: ~$135
Target: $150.05 → ~+10.5%
Stop: $133.73 → ~-2.4%
R:R Ratio: ~4.6:1
MACD histogram flipping positive.
RSI rebounded from oversold and consolidating.
💰 Dividend Catalyst:
Ex-div date: May 19
Yield: 5.04% (quarterly payout of $1.71/share)
Chevron has increased its dividend for 37 consecutive years — strong income + growth combo.
This is a solid swing + yield capture setup. I’m long from $135.64.
📈 Watching for confirmation over $137 before scaling.
Do you think CVX hits $150 before ex-div? Drop your chart 👇

CVX – Waiting for Pullback to 0.382 Before Targeting Gap FillsChevron (CVX) recently broke structure to the upside after holding a 1D demand zone near $136.
I'm now watching for a pullback toward the 0.382 retracement (~$141.80) of the recent impulse. This level aligns with the breakout area and offers a potential continuation setup.
🎯 Trade Setup:
Bias: Long (on retracement)
Entry zone: $141.80 – $142.00
Targets:
📌 Gap 1 → ~$158
📌 Gap 2 → ~$166
Invalidation: Close below $138 would negate the bullish thesis.
🧠 Context:
Structure flipped bullish after BoS.
Gaps above remain unfilled, acting as magnet zones.
Pullback to 0.382 = logical spot to join trend continuation.

Bullish Outlook: Key Levels Signal Upside PotentialTargets:
- T1 = $140.50
- T2 = $144.00
Stop Levels:
- S1 = $134.50
- S2 = $133.00
**Wisdom of Professional Traders:**
This analysis synthesizes insights from thousands of professional traders and market experts, leveraging collective intelligence to identify high-probability trade setups. The wisdom of crowds principle suggests that aggregated market perspectives from experienced professionals often outperform individual forecasts, reducing cognitive biases and highlighting consensus opportunities in Chevron.
**Key Insights:**
Chevron's strong fundamentals and diversified portfolio provide a solid foundation amid fluctuating oil prices. Technical indicators show pivotal price levels forming, with potential upside supported by favorable global energy trends. Chevron has demonstrated resilience in managing legal uncertainties, keeping investor focus primarily on its operational strength and robust cash flow generation.
The company’s strategic push into renewables and low-carbon technologies complements its legacy oil and gas portfolio. This dual approach positions Chevron for both short-term performance in traditional energy markets and long-term sustainability amid global energy transitions.
**Recent Performance:**
Chevron has recently exhibited a steady consolidation near its current price level, reflecting broader market trends within the energy sector. The price movement has remained moderately volatile, with external events such as crude oil pricing and geopolitical dynamics heavily influencing its trajectory. The stock held its ground despite industry-wide challenges, showcasing its stability compared to several competitors.
**Expert Analysis:**
Market analysts are optimistic about Chevron’s ability to maintain growth through its strategic investments and operational efficiency. Technical sentiment reveals the stock is hovering around a crucial accumulation phase, suggesting higher probability for breakout scenarios. Current volumes and price actions indicate renewed investor interest, particularly as macroeconomic conditions favor energy demand.
Experts highlight Chevron’s ability to leverage its global operational footprint to mitigate risks associated with regional disruptions or commodity supply challenges. While the lawsuit against major oil companies introduces some uncertainty, Chevron’s financial health and legal expertise are expected to navigate this risk effectively.
**News Impact:**
Recent developments around rising oil prices due to supply chain constraints and geopolitical tensions remain the key market drivers for Chevron. Additionally, the ongoing legal challenges faced by top industry players, including Chevron, have slightly weighed on investor sentiment. However, these issues are manageable considering Chevron’s reputation for operational resilience and strategic focus. Positive developments in the renewable energy narrative could further boost the market outlook for Chevron.
**Trading Recommendation:**
Based on technical analysis and expert opinions, traders should consider taking a bullish position on Chevron at its current price level of $136.70. The stock's recent consolidation and key support levels provide an attractive entry point for upside gains. Favorable macroeconomic conditions and the company’s proven track record in navigating industry challenges further reinforce the likelihood of price appreciation toward the $140.50 and $144.00 levels. Setting tight stop-loss levels at $134.50 and $133.00 ensures adequate risk management while capitalizing on potential momentum-driven price movements.

Chevron wedge bull flagChevron stock is well below its intrinsic value, I found a decent setup based on technical analysis for my entry, because of the attractive dividend payouts I will buy and hold CVX for awhile and see what happens.

Quick View: $CVX(1 hour) Consolidation with Bullish EMAs
(weekly), good action above the ema 50
Watching $144 as key resistance.
Support → $139/$133

CVX demand zone!OptionsMastery:
🔉Sound on!🔉
📣Make sure to watch fullscreen!📣
Thank you as always for watching my videos. I hope that you learned something very educational! Please feel free to like, share, and comment on this post. Remember only risk what you are willing to lose. Trading is very risky but it can change your life!

Chevron: The Chart’s Reaching a Critical PointChevron is starting to look very interesting again — but let’s be clear from the start: Chevron, like every oil giant, lives and dies by the price of oil. If oil rips higher or collapses due to global politics, supply shocks, or economic chaos, Chevron NYSE:CVX follows. No exceptions.
That said, what we’re seeing on the chart right now is increasingly pointing toward a deeper correction — specifically down to the $113–$100 zone. That would make sense structurally as a Wave 4 retracement.
But there’s a technical nuance here. Wave 1’s high sits at $103 — and depending on how strict your Elliott Wave rules are, Wave 4 dipping into Wave 1 is bad territory. Personally, I’m okay with a brief touch into that range, but I don’t want to see price hanging around below $103 for long.
From a trend perspective, we’re clearly in a downward channel. We just saw a textbook bull trap:
Chevron broke out with a solid +7% move over two weeks,
Followed immediately by a massive 22% drop,
One of the sharpest two-week declines since — yeah — March 2020, pandemic levels.
Now, price is hovering around $130, and the setup is simple:
If this level holds, great — maybe we’re bottoming.
If it breaks, I’m looking to buy between $113 and $100. That’s where the structure aligns, the volume kicks in, and risk/reward starts to make sense again.
So here’s the real question:
Do we see $200 first — or $100?
I’m leaning $100 first.
Not because I’m bearish long-term— but because that level would clean up the chart, shake out the noise, and give us a real shot at riding the next strong leg higher with conviction.
Would love to hear what you think — where’s your bet?

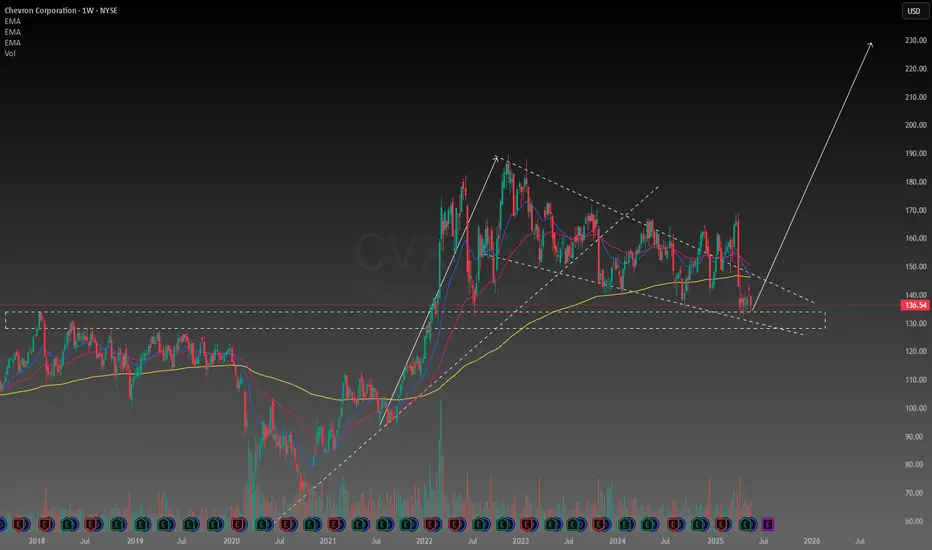
CVX - Similar Structures Similar structures along bullish trend line up on this Weekly chart
Due to the similarities i think the bulls can continue upwards along this trend line in green
Bullish on Weekly
