Netflix: A Correction Within a Strong UptrendNetflix: A Correction Within a Strong Uptrend
NASDAQ:NFLX has gone through a lot over the past few years, from huge growth to deep corrections, and lately we’ve seen a (healthy?) 20% pullback that brought the price right to the lower boundary of its long-term ascending channel.
At first glance, the break below the $1,150 level looked worrying, and it certainly brought some pessimism to the market . But the area between $1,070 and $1,100 is still a very strong support zone that shouldn’t be ignored. As long as this zone holds, the broader bullish structure remains intact. Let me share a zoom:
If the price drops below $1,050, that would be a sign of trouble, it would mean we’ve entered the previous correction zone and broken both key support and the lower line of the channel. That’s where the trade SL its logic, and cutting losses quickly becomes essential l. The downside risk from current levels is roughly 6%, which is acceptable in exchange for the potential upside.
On the bright side, the market remains bullish overall . Netflix keeps reinventing itself, improving margins, and showing solid fundamentals. Technically speaking, this correction looks textbook, the current pullback mirrors the size of the previous one (White arrows), and Fibonacci’s 61.8% retracement (blue arrow) level has once again acted as a key pivot point. This kind of pattern is a classic correction, not an impulse.
If the stock confirms a rebound from the channel support, the potential is significant: around +20% if price revisits previous highs, and up to +35% if Netflix breaks into new territory.
In short:
✅ Strong long-term uptrend still intact
✅ Correction looks healthy and technically clean
⚠️ Support at $1,070–$1,100 must hold
📈 Upside potential 20–35% vs. ~6% downside risk
Sometimes, opportunities like this appear only a few times in a cycle, Netflix might be one of them right now.
Trade ideas

Netflix (NFLX) - Elliott Wave Map to $25K📘 Netflix (NFLX) – The Final Act of Supercycle Wave III, Setting the Stage for Wave V to $25,000+
Symbol: NASDAQ:NFLX
Timeframe: Monthly
Published: October 2025
Current Price: ~$1,120
Framework: Elliott Wave | Fibonacci Extensions | Price Action | Smart Money Concepts (SMC) | Fundamentals
🔍 Structural Overview – Supercycle Journey
Netflix has been moving through a multi-decade Elliott Wave supercycle that began in the early 2000s. This structural roadmap is now approaching the final phase of Wave III, before setting up for a corrective Wave IV and ultimately a euphoric Wave V.
Supercycle Wave I completed in January 2004 — a powerful impulse that marked Netflix’s transition into a mainstream tech-growth story.
Supercycle Wave II followed, completing in 2008 with a healthy 50% retracement. This wave set the long-term demand foundation and concluded right as the global financial crisis unfolded.
We are now in Supercycle Wave III, which began in 2008 and is currently in its final macro wave — the most dynamic phase of the entire structure.
⚙️ Breakdown of Supercycle Wave III (2008–2026 est.)
Wave III itself subdivides into five clear macro waves, each respecting Fibonacci and structural principles:
Macro Wave 1 ran from the 2008 bottom into mid-2011, kickstarting the secular bull trend.
Macro Wave 2 ended in 2012 with a textbook 0.618 Fibonacci retracement , a classic sign of wave-based correction.
Macro Wave 3 , the most explosive move of the cycle, lasted until 2018 and terminated near a 2.618 Fibonacci extension — a key confluence area and institutional distribution point.
Macro Wave 4 then corrected from 2018 to 2022. However, this retracement was shallow, bouncing from the 0.236 level — preserving long-term bullish market structure and confirming continued institutional control.
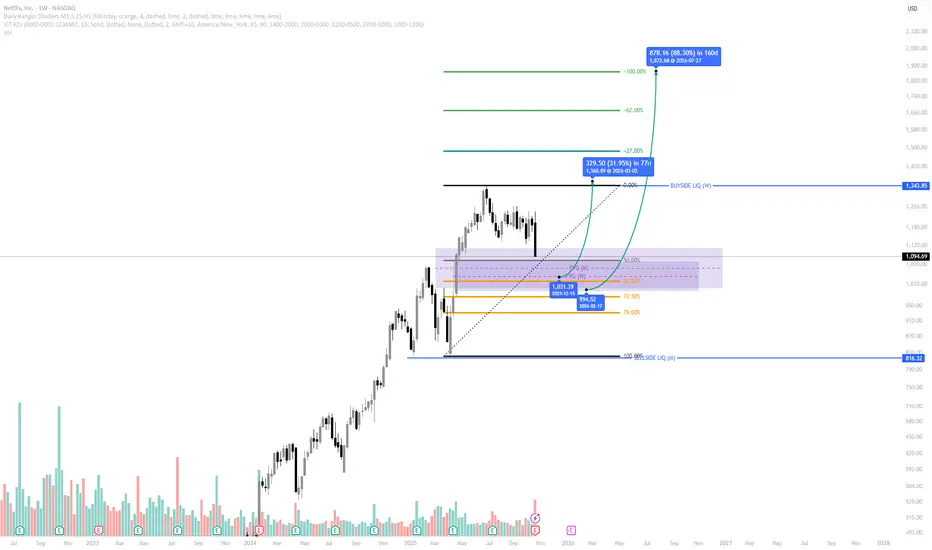
We are currently in Macro Wave 5 of Supercycle III . This leg is itself subdividing into five micro waves. Micro waves 1, 2, and 3 have already completed. Micro Wave 4 is now unfolding and is expected to bottom inside the Golden Pocket — the critical Fibonacci zone between approximately $771 and $548 .
Once Micro Wave 4 completes, Micro Wave 5 will initiate. This final thrust is expected to target the region near $7,447 — the 2.618 extension from prior waves. This level aligns with structural channel tops and institutional profit zones. It would also mark the formal completion of Supercycle Wave III .
🧭 What Comes Next: Supercycle Wave IV and V
After Wave III completes at the ~$7,44 7 area, a significant correction is expected.
Supercycle Wave IV will be the most complex corrective structure since 2008 — possibly multi-year, combining flat, zig-zag, or triangle formations. This wave will likely retrace a large portion of Wave III and reset sentiment across the broader market.
But this correction is not the end — it’s the setup.
Supercycle Wave V will emerge from the Wave IV base and drive Netflix into its ultimate secular top . Based on the Fibonacci 4.618 extension from the base of the cycle, Wave V is projected to reach the $24,774 to $25,332 range.
This would be the euphoric blow-off move where fundamentals, monetary policy, and sentiment combine to form a parabolic top — consistent with historical market cycle conclusions.
📐 Fibonacci Confluence Zones
Each major wave has respected key Fibonacci ratios . Wave II retraced to 0.50, Wave III extended to 2.618, and Wave IV retraced to 0.236. Current projections place Wave V near the 4.618 extension level — a historically significant threshold for secular tops.
The current Micro Wave 4 pullback is unfolding into the Golden Pocket zone — the 0.618–0.65 retracement range — which has repeatedly served as the institutional reaccumulation zone across prior waves.
🧠 Smart Money Behavior
Smart Money Concepts further validate this wave count:
In 2018 , we saw classic signs of institutional distribution at the top of Macro Wave 3 — including high-volume price exhaustion, deviation from trend, and liquidity sweeps.
Between 2018 and 2022, accumulation returned during Wave 4, as institutional players re-entered at discounted levels and retested key demand blocks .
The 2022 breakout into Macro Wave 5 has been efficient, clean, and impulsive — with minimal resistance and wide-range bullish candles, signaling continued institutional participation.
The current Wave 4 micro correction may again serve as a liquidity grab — offering another accumulation window before the final markup toward the $7,447 zone.
🔍 Netflix Fundamentals – Fueling the Cycle
Netflix's fundamentals are now structurally aligned with the technical setup:
Diversified Monetization:
The shift from pure subscription to a multi-layered model (ad-supported tiers, gaming, IP licensing, live events) is broadening both revenues and engagement.
Ad-Supported Growth:
Netflix’s advertising business is scaling rapidly, offering higher ARPU and access to price-sensitive users — a major tailwind for Wave V.
Global Expansion:
With strong localization strategies, Netflix continues to dominate key international markets, boosting user stickiness and content ROI.
Strong Financials:
Consistent free cash flow, improving margins, and disciplined content spend are creating a sustainable growth engine.
These dynamics are not just supporting price — they are helping to drive the type of institutional confidence needed for Wave V to materialize.
🎯 Strategic Levels and Outlook
Watch the Golden Pocket between $771–$548 — this is the high-probability completion zone for Micro Wave 4.
Once Micro Wave 5 begins, price is expected to rally toward $7,447 — the projected top of Supercycle Wave III.
After a broad correction during Wave IV, the final Wave V is projected to target $24,774 to $25,332 — where the entire super-cycle would culminate.
🔚 Final Word
Netflix is moving through the final stages of a 20-year Supercycle Wave III — one of the strongest impulsive phases in equity history. The micro pullback underway now is not a sign of weakness, but a preparation for the final push.
Wave IV will offer the last major reset before a euphoric Wave V redefines valuations. If the fundamental narrative continues to align, the $25K target is not speculative — it’s structural.
📘 Disclaimer: This analysis is for educational purposes and is not financial advice. Always do your own due diligence and risk management.
#NFLX #Netflix #NASDAQ #ElliottWave #TechnicalAnalysis #WaveTheory #Fibonacci #Supercycle #PriceAction #LongTermInvestment
💬 Respected traders and analysts!
Your insights matter. Share your views, confirmations, or constructive criticism in the comments below. Let’s build a high-quality discussion around Netflix’s structural evolution and long-term investment context.
— Team FIBCOS

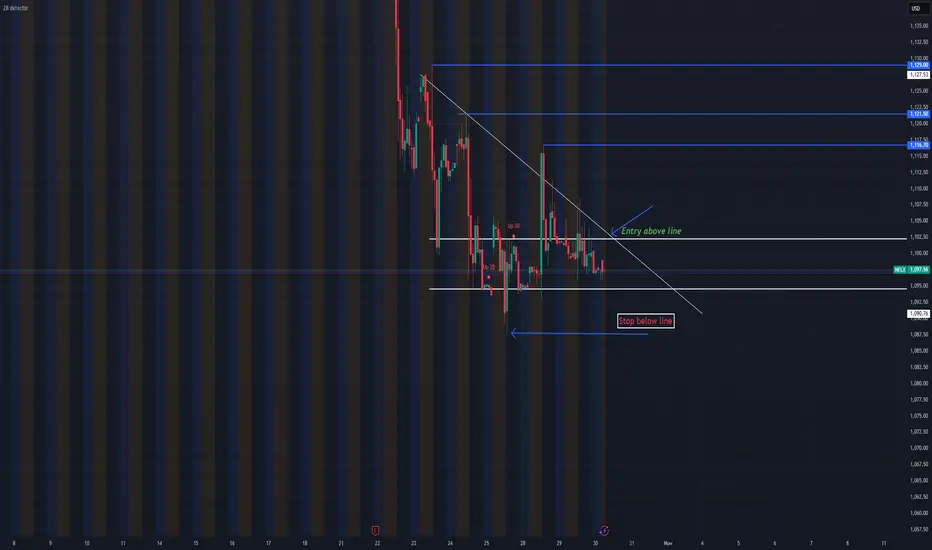
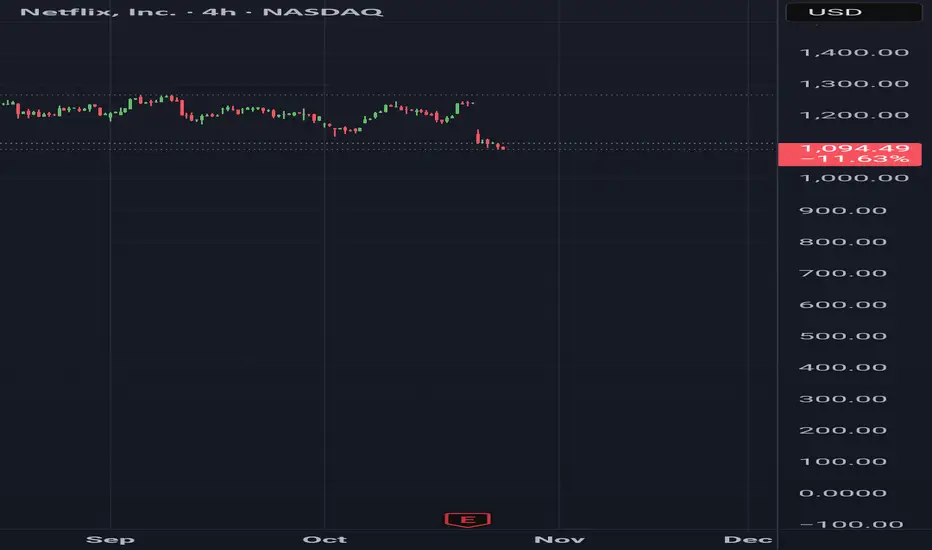
NFLX - 2B REVERSAL PATTERN FORMATIONSharp drop after earnings ERRANTE:NETFLIX seems to be forming a new bottom around $1,095. Consolidating for some now and a 2b pattern is developing.
A lower candle in the same time frame invalidates the pattern.
NFA.
Good luck
Netflix (NFLX) | FVG + OTE Entry Loading | Multi-Confluence ICT Netflix (NASDAQ: NFLX) is currently retracing into a high-probability multi-timeframe setup, aligning several ICT confluences that suggest a potential re-entry opportunity within a bullish continuation narrative.
Market Structure:
Price remains bullish overall, with clear higher highs (HH) and higher lows (HL). The recent decline represents a healthy retracement inside a developing higher-timeframe structure.
Fair Value Gap (FVG) Alignment:
The current pullback has driven price into an overlapping Monthly and Weekly FVG, an area of institutional interest where price has previously shown strong reactions.
This zone often serves as a re-accumulation region before expansion.
Optimal Trade Entry (OTE):
The FVG aligns directly within the 62%–79% Fibonacci retracement zone, known as the golden OTE zone.
This overlap of structural retracement and imbalance discount makes it a prime setup from a smart money perspective.
Liquidity & Target Zones:
- Discount Range: $944 – $1,033
- Primary Buyside Liquidity (BSL): $1,345
- Extended Target: $1,872 (100% expansion projection)
Each level aligns with liquidity pools and Fibonacci extension targets visible on higher timeframes.
Trade Bias:
Bullish, with focus on accumulation and confirmation within the OTE discount range.
A weekly bullish displacement or rejection candle within this zone would strengthen the case for long continuation plays.
Summary:
NFLX is presenting a multi-timeframe high-probability setup, where a clean retracement into an overlapping Monthly/Weekly FVG and OTE zone creates a strong case for re-entry.
If the discount zone holds, expect expansion toward buyside liquidity and potential continuation into 2026.
Netflix Earnings Market OverreactionAt this point we all know that Netflix is a common part of an average American's life. However, we came to terms with reality that the global field has a larger effect on the NASDAQ:NFLX than we might think. As we saw in the Q3 '25 earnings report, Brazil levied a one time tax bill on Netflix that charged them over half a billion in back taxes under a court ruling in local rules. This expense has not actually been paid yet, but has been reported on the financial reports as seen in the recent report. However, this should cause some eyebrows to raise as the stock has dropped over 18% from the all time high and over 8% this week. Most would assume that Netflix blew it on the earnings and that the stock should be toxic until 2026, but this may not be the case for those who look a little closer.
Firstly, lets tackle the elephant in the room. As stated before, Netflix showed nearly a $619,000,000 one-time tax expense levied by the Brazilian government concerning back taxes in revenues. Sure, this isn't necessarily good for their business, and it could be assumed that the Netflix was not very excited to report this on their statements. However, the nature of this tax should imply that this is not an ongoing part of their operations and this should not be expected in the quarters to come. Netflix also felt the need to state that operating margin would have beaten guidance had this not shown up on the income statement. So although this isn't good, it's not a core part of the companies health and operations continue to be profitable and should expect to stay that way.
Unfortunately, this odd tax expense overshadowed a key statistic, and no it's not some ratio or percentage. It's the Q3 stock buyback number which comes out to:
- 1,500,000 shares bought back
- Average price @ $1,220
- About $1.8 Billion in total spent on buybacks.
Even with these impressive numbers, we still cant fully capture just what Netflix is capable of in this aspect. Currently, they are sitting on $10 billion in pending authorization for stock buyback with no shelf registration. This means that Netflix is currently only allowed to buy their own shares back and not sell any to the financial markets until they file a shelving registration with the SEC. Now, there shouldn't be any need to explain why these metrics are bullish but the recent events show what was stated previously, and that is: the market has overreacted to the Netflix earnings miss.
So what's the course of action? The simple answer we can pose is to buy the dip. Simply buy the asset on discount and wait for it to rise, then sell for what should be a market beating profit. It also seems that some analysts are already on this case, with some projecting a 30% upside in the near future. I wouldn't disagree with them as Netflix looks to be a very attractive price. I wouldn't expect it to move in such a manner as my SanDisk callout but I also don't see a reason why this trade cant turn a nice profit going into the new year.
Basis Price @ $1,100
Time expectation: 1-6 months
Target price: $1,350-$1,500

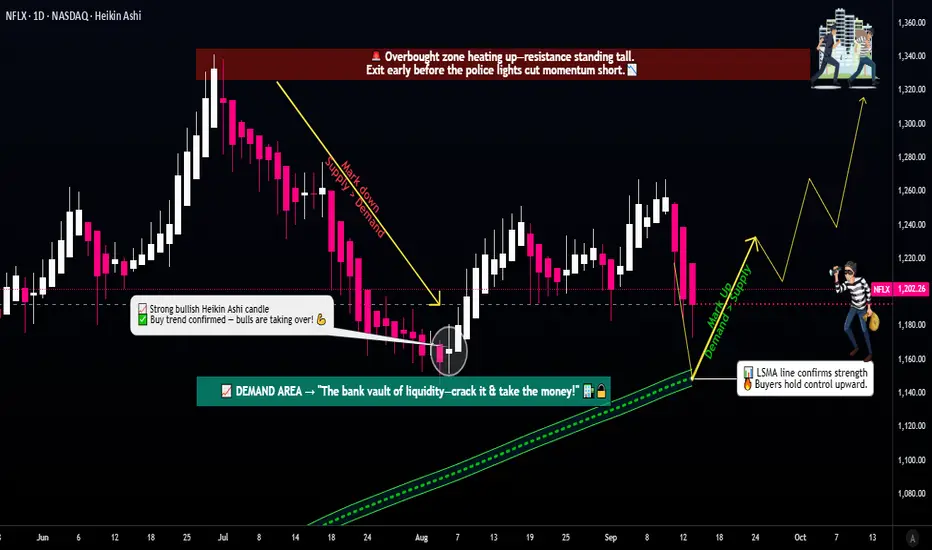
Popcorn Ready? Netflix Layering Setup for Bold Traders🎬 Netflix Stock | Thief Trader’s Profit Realization Blueprint 🍿💰
🧭 Market Outlook
Netflix (NFLX) is lining up for a bullish playbook — and here’s how the Thief Strategy goes down. This setup is purely educational and shares how I personally view price behavior with a layering approach.
🎯 Trading Plan (Swing/Day Trade Idea)
Entry (Layering Style 🥷): Instead of one-shot entries, the thief strategy is about multiple buy-limit layers. Example blueprint:
👉 1160 | 1170 | 1180 | 1190 | 1200 (more can be added if liquidity allows)
Stop Loss 🛡️: Thief-style SL ~1120 (after breakout levels are confirmed).
⚠️ Note to Thief OG’s: Manage your own SL & adapt risk. My level is an example, not a fixed call.
Target 🎯: Eyeing the 1340 zone, where resistance + overbought vibes + possible trap signals align. The thief rule? Escape before the crowd escapes 🚪💨.
⚠️ Again — not a fixed TP. Manage your own exits depending on profit goals & risk appetite.
🕵️♂️ Thief Trader Philosophy
This is not financial advice. It’s a “steal-and-escape” blueprint to show how layered entries can help smooth entries across zones instead of one rigid buy point. Adapt, manage, and steal profits like a pro before the market takes them back.
🔗 Related Assets to Watch
NASDAQ:AMZN — often shows correlation in big tech swings 📦
NASDAQ:AAPL — mega-cap sentiment driver 🍏
NASDAQ:MSFT — growth stock momentum check 💻
NASDAQ:QQQ — ETF to track Nasdaq 100 flow 📊
AMEX:SPY — broad market sentiment monitor 🏦
📌 Key Correlation Notes
Big tech stocks often move in sympathy — when Nasdaq pumps, Netflix usually gets extra popcorn 🍿 fuel.
Watch volatility spikes in TVC:VIX , as they can trap over-leveraged longs & shorts.
Macro cues (USD strength, yields, Fed talk) can shift momentum across all growth stocks.
✨ “If you find value in my analysis, a 👍 and 🚀 boost is much appreciated — it helps me share more setups with the community!”
#NFLX #Netflix #Stocks #SwingTrade #DayTrade #LayeringStrategy #Options #StockMarket #TradingView #ThiefTrader #Equities #QQQ #SPY #StockAnalysis
Netflix (NFLX) Shares See a Sharp DeclineNetflix (NFLX) Shares See a Sharp Decline
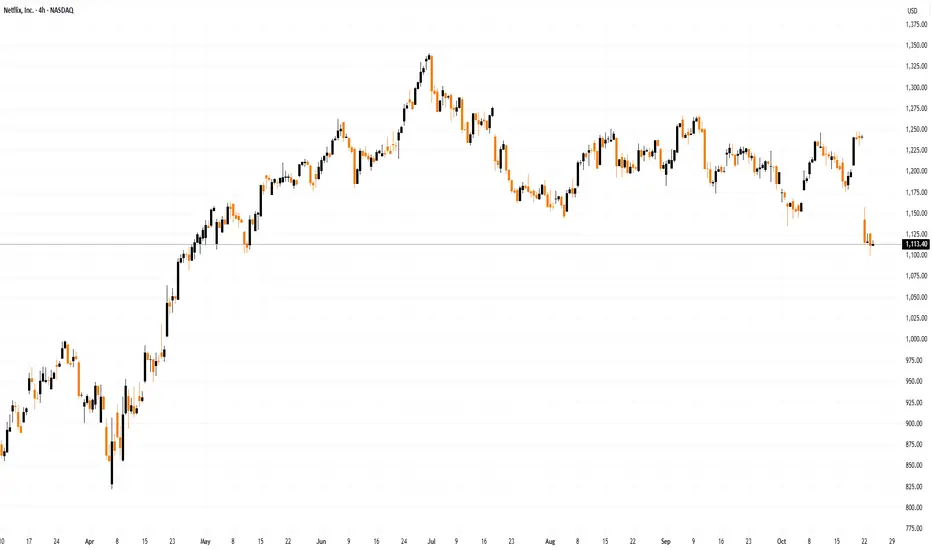
According to recent charts, Netflix (NFLX) shares have traded below $1,100 this week — for the first time since late May. The stock has fallen more than 17% from its July peak, while the S&P 500 index remains close to record highs.
Why Has Netflix (NFLX) Fallen?
The main catalyst for the drop was the company’s earnings report, which showed results well below expectations: actual EPS came in at $5.87 versus a forecast of $6.96 and a previous reading of $7.19.
Despite the success of several new releases, the figures were weighed down by a tax dispute in Brazil, which significantly dampened market sentiment. Nevertheless, the bulls still have reasons for cautious optimism.
Technical Analysis of the NFLX Chart
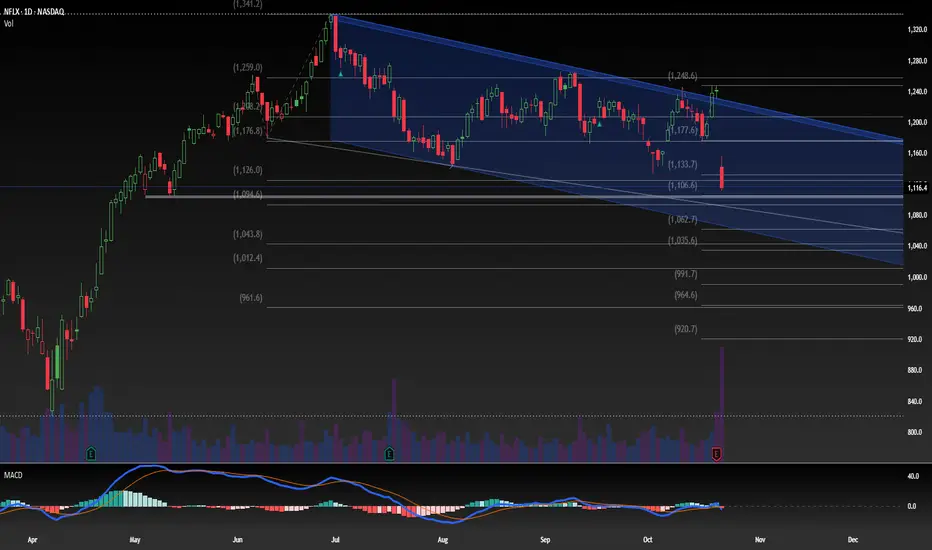
The NFLX share price remains within a long-term upward channel (marked in blue). It has now approached a key support zone formed by:
→ the lower boundary of the main channel, which previously provided support in April;
→ the lower line of a short-term downward trajectory (marked in red);
→ the psychological level of $1,100.
Bulls are taking encouragement from the fact that:
→ the RSI indicator has entered oversold territory;
→ the price previously moved confidently through the $1,000–$1,100 range, suggesting that strong buying interest may still persist in this area.
From the sellers’ perspective, however, attention should be paid to the large bearish gap formed earlier this week, with its lower edge near $1,100, which could now act as resistance.
Taking all this into account, it seems reasonable to assume that:
→ the current support zone may prevent further declines in NFLX shares;
→ the impact of the Brazilian tax case (reported losses of around $600 million) may already be priced in;
→ bulls could attempt to resume the broader uptrend, potentially turning the red trajectory into a bullish flag pattern.
On the other hand, failure to hold within the blue channel would expose the $1,000 level to another test.
This article represents the opinion of the Companies operating under the FXOpen brand only. It is not to be construed as an offer, solicitation, or recommendation with respect to products and services provided by the Companies operating under the FXOpen brand, nor is it to be considered financial advice.
NetflixHeard someone online talk about Netflix so I decided to throw this together real quick. Weekly levels are grey
Daily timeframe levels are red

BUY NFLXNFLX is due to fall down or short soon at 1,134.00 to 1,405.00, but for next week or maybe this week – it's time to BUY NFLX at 1,164.00, riding back up to 1,134.00 to 1,405.00 as Profit Targets, Stop Loss is at 1,132.00!
If anyone likes long mumbo jumbo garbage analysis, than this is NOT for you.
Also, if you are afraid of risk, failure, and want only a 100% sure thing, than
run as fast as you can from the market, because the market is NOT a sure thing,
so it is definitely NOT for you.
WARNING: This is just opinions of the market and its only for journaling purpose. This information and any publication here are NOT meant to be, and do NOT constitute, financial, investment, trading, or other types of advice or recommendations. Trading any market instrument is a RISKY business, so do your own due diligence, and trade at your own risk. You can loose all of your money and much more.

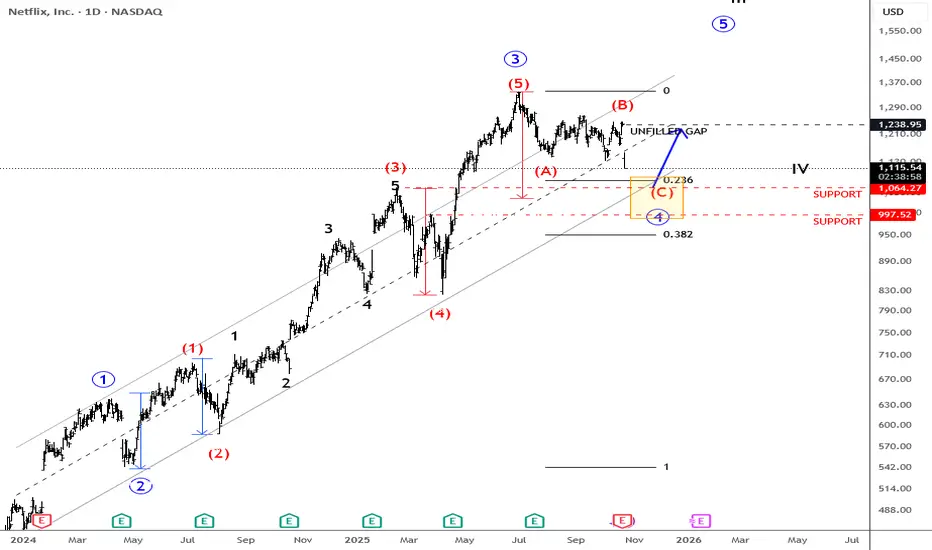
Netflix Down After Earning, But Its Hunting SupportNetflix is coming down after earnings and is currently trading more than 10% lower. Whenever we see such a sharp reversal, it’s important to zoom out and look at the broader trend. From the 2023 lows, there is still a very strong and impulsive recovery, so this could be just a temporary deeper corrective pause before the uptrend resumes.
In Elliott Wave terms, it looks like a potential fourth wave retracement that could start to stabilize somewhere around the previous wave three high near the 1060 area, or possibly a bit lower, closer to the 1K level. This whole zone could be quite attractive for a rebound, especially since some of the gaps above the current price may still be filled — something that often happens when a stock remains in an uptrend.
In my view, there’s still a good chance for a nice recovery and continuation higher in the weeks to come.
Grega
Highlights:
Trend: Bullish (consolidation in wave four approaching support)
Support: 1060, 1000
Resistance: 1260
Note: Stock can stabilize after wave 4 and try to fill the earnings gap at some point in the future.
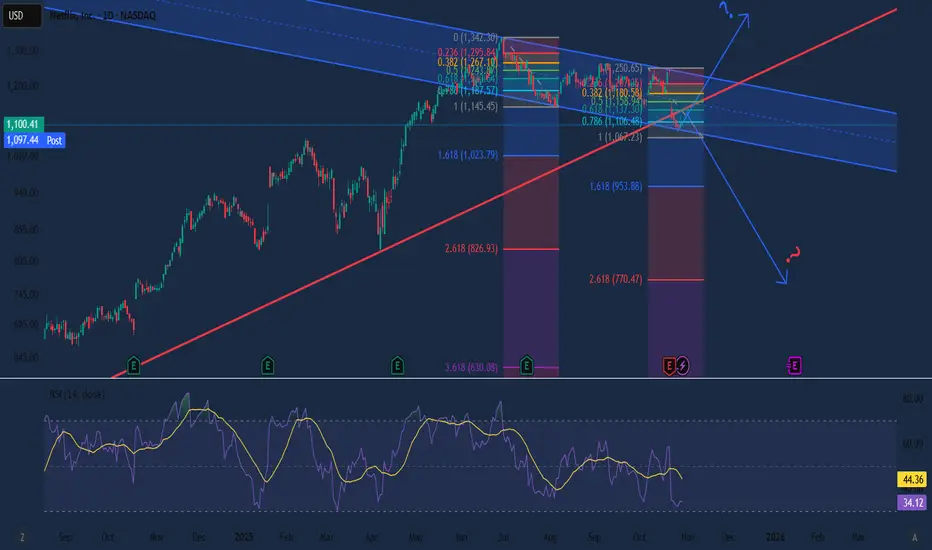
Netflix: Key Support Zone in sightNetflix shares have continued to decline since our last update. We have now provided additional detail on the ongoing turquoise wave 4, which is subdivided into a magenta three-part structure. Within this structure, wave is expected to push price further down into the turquoise Target Zone, between $962.77 and $845.22. The low point of the larger wave 4 is anticipated within this range. Only after reaching this level should wave 5 drive price back above the $1,341 mark. As such, the turquoise Target Zone presents long entry opportunities, which can be protected with a stop set 1% below the lower boundary of the zone. However, if price rises directly above the aforementioned resistance at $1,341, our alternative scenario would be triggered, and we would initially need to prepare for a higher wave alt.3 top (probability: 30%).

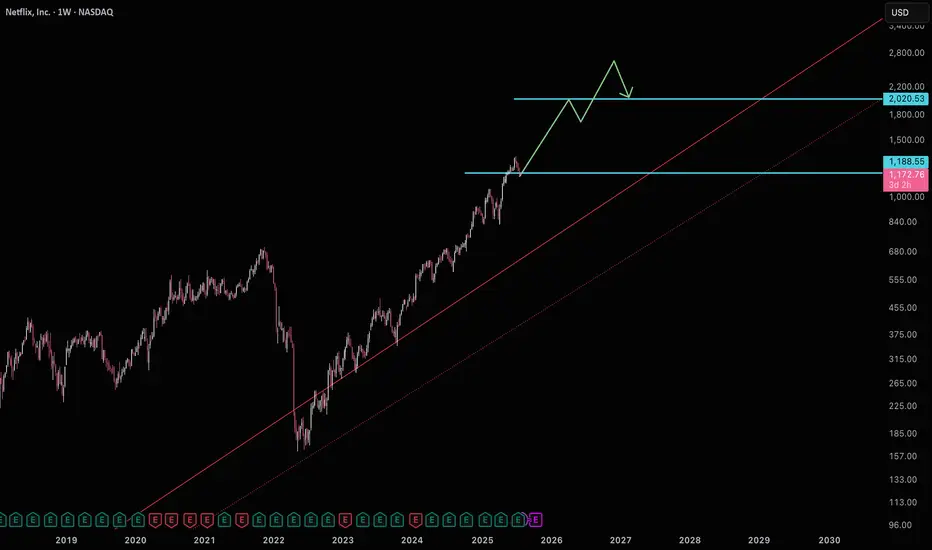
Netflix building support for $2000Netflix is currently sitting on support getting ready for a move to $2000.
Good luck!
Carry Trade Profits in the Global Market1. Understanding the Concept of Carry Trade
Carry trade refers to a financial strategy that exploits the difference in interest rates between two countries. Traders borrow funds in a low-yielding currency (called the funding currency) and invest them in a high-yielding currency (called the target currency). The profit from this strategy arises from the interest rate differential — known as the carry.
For instance, if Japan’s short-term interest rate is 0.1% and Australia’s is 4%, a trader can borrow in Japanese yen (JPY) and invest in Australian dollars (AUD). Theoretically, this generates a profit of 3.9% annually, assuming the exchange rate remains stable.
Carry trade profits are not merely theoretical; they are among the major drivers of cross-border capital movements and global liquidity. They depend heavily on macroeconomic stability, monetary policies, and risk appetite in the global market.
2. The Mechanism of Carry Trade
The process of executing a carry trade involves several steps:
Borrowing in the Low-Interest Currency:
Traders borrow funds in a currency where interest rates are minimal. Historically, currencies like the Japanese yen (JPY) and Swiss franc (CHF) have been popular funding currencies due to their ultra-low rates.
Converting and Investing in High-Yielding Assets:
The borrowed funds are converted into a high-yielding currency (such as the Australian dollar, New Zealand dollar, or Brazilian real) and invested in assets like government bonds, corporate debt, or even equities offering higher returns.
Earning the Interest Differential (Carry):
The profit is the difference between the interest paid on the borrowed currency and the interest earned on the invested currency.
Closing the Trade:
Eventually, the investor reverses the process—converting the investment back to the funding currency to repay the borrowed amount. If exchange rates have remained stable or moved favorably, profits are realized.
3. Historical Context and Examples
Carry trades have been instrumental in shaping financial markets over several decades:
Japanese Yen Carry Trade (1990s–2008):
After Japan’s economic bubble burst, the Bank of Japan cut interest rates to nearly zero. Investors borrowed cheap yen and invested in higher-yielding currencies like the U.S. dollar (USD), Australian dollar (AUD), and New Zealand dollar (NZD). This strategy thrived during periods of market stability, contributing to global asset bubbles before the 2008 financial crisis.
Swiss Franc Carry Trade:
The Swiss National Bank maintained low interest rates for years, making the franc an attractive funding currency. However, when the Swiss franc appreciated sharply in 2015 after the SNB removed its euro peg, many carry traders suffered significant losses.
Emerging Market Carry Trades:
Investors often exploit high interest rates in countries like Brazil, Turkey, South Africa, or India. For instance, borrowing in USD or JPY and investing in the Brazilian real (BRL) can yield high returns when emerging markets are stable.
4. The Role of Interest Rate Differentials
The heart of carry trading lies in interest rate differentials — the gap between the borrowing rate and the investment rate. Central bank policies significantly influence these differentials. When central banks like the Federal Reserve, European Central Bank (ECB), or Bank of Japan adjust their rates, global carry trade flows react instantly.
For example, if the U.S. Federal Reserve raises interest rates while Japan keeps them low, the USD becomes more attractive, potentially reversing yen carry trades. Traders must therefore monitor global monetary policies closely, as sudden shifts can either magnify profits or wipe them out.
5. Factors Affecting Carry Trade Profitability
Carry trade profits depend on multiple interconnected factors:
Exchange Rate Stability:
The biggest threat to carry trades is currency fluctuation. If the high-yielding currency depreciates against the funding currency, the losses from exchange rate movements can easily outweigh interest gains.
Interest Rate Differentials:
A widening differential boosts carry returns, while a narrowing one reduces profitability.
Risk Appetite and Market Sentiment:
Carry trades flourish during periods of global economic stability and investor optimism (risk-on environments). When fear or uncertainty rises (risk-off sentiment), traders rush to unwind carry positions, leading to sharp currency reversals.
Global Liquidity Conditions:
Easy monetary policies and quantitative easing increase global liquidity, encouraging carry trade activities. Conversely, tightening liquidity discourages such trades.
Geopolitical Risks:
Political instability, wars, or sanctions can disrupt currency markets, leading to unexpected volatility and losses.
6. Carry Trade and Exchange Rate Dynamics
Carry trading influences exchange rates globally. When investors borrow in a funding currency and invest in a high-yielding one, demand for the target currency increases, causing it to appreciate. This appreciation can reinforce returns in the short run. However, if markets suddenly turn risk-averse, the reverse occurs — massive unwinding of carry positions leads to depreciation of the target currency and appreciation of the funding currency, often triggering volatility spikes.
A notable example occurred during the 2008 global financial crisis, when investors unwound their yen-funded positions en masse, causing the yen to surge sharply while high-yielding currencies plunged.
7. Measuring Carry Trade Performance
Professional investors use several metrics to evaluate carry trade performance:
Interest Rate Differential (IRD):
The expected annual return from the interest rate gap between two currencies.
Forward Premium/Discount:
The difference between spot and forward exchange rates, reflecting market expectations.
Sharpe Ratio:
The risk-adjusted return measure used to assess the profitability of carry trades relative to volatility.
Uncovered Interest Rate Parity (UIP):
According to UIP, currency exchange rates adjust to offset interest rate differentials, meaning there should be no arbitrage profit. However, empirical evidence shows UIP often fails in reality — creating room for carry trade profits.
8. Benefits of Carry Trade
Attractive Yield Opportunities:
Investors can earn higher returns compared to traditional assets, especially when interest rate gaps are wide.
Portfolio Diversification:
Carry trades allow exposure to multiple currencies and economies, improving portfolio risk balance.
Liquidity and Leverage:
The forex market’s deep liquidity and access to leverage make carry trades easily executable and potentially highly profitable.
Macroeconomic Insights:
Understanding carry trades provides insights into global monetary policy trends, capital flows, and risk sentiment.
9. Risks and Challenges in Carry Trade
Despite its appeal, carry trade is inherently risky:
Exchange Rate Volatility:
Even small currency movements can nullify interest rate gains, especially with leverage.
Sudden Policy Shifts:
Central banks’ unexpected rate hikes or currency interventions can disrupt positions.
Liquidity Risk:
During crises, funding markets can freeze, making it difficult to close positions at favorable rates.
Crowded Trade Risk:
When too many traders hold similar carry positions, sudden reversals can amplify losses, as seen in the 2008 crisis.
Interest Rate Convergence:
Narrowing rate differentials can reduce profitability and make carry trades unattractive.
10. Modern Developments in Carry Trade
In recent years, technological and structural changes in financial markets have transformed carry trading:
Algorithmic and Quantitative Models:
Sophisticated algorithms now execute carry strategies using real-time macroeconomic data, optimizing entry and exit points.
ETFs and Derivative Products:
Exchange-traded funds (ETFs) and derivatives allow retail and institutional investors to gain exposure to carry trade returns without direct currency borrowing.
Emerging Market Focus:
Investors are increasingly targeting emerging economies offering high yields, though at the cost of higher volatility.
Impact of Global Rate Cycles:
The post-COVID monetary environment, characterized by aggressive rate hikes followed by normalization, has reshaped traditional carry trade opportunities.
11. Case Study: The Yen Carry Trade in the 2000s
Between 2003 and 2007, the yen carry trade became a dominant global phenomenon. Japan’s interest rates were near zero, while economies like Australia, New Zealand, and the U.S. offered higher yields. Investors borrowed trillions of yen to invest abroad, pushing global equity and commodity prices upward.
However, when the financial crisis hit in 2008, investors fled risky assets, causing a rapid unwinding of carry trades. The yen appreciated sharply against the dollar, and many investors suffered massive losses. This event demonstrated how carry trades can amplify both booms and busts in global markets.
12. The Future of Carry Trades
The profitability of carry trades in the modern global economy depends on several evolving dynamics:
Interest Rate Normalization:
As global central banks return to moderate interest rate levels, carry opportunities may reemerge, particularly between developed and emerging markets.
AI and Predictive Analytics:
Machine learning models are increasingly used to forecast exchange rate movements, improving carry trade timing.
Geopolitical and Inflationary Pressures:
Persistent geopolitical tensions, inflation, and deglobalization trends may increase currency volatility, posing new challenges for carry traders.
Green Finance and ESG Considerations:
Sustainable finance trends could influence capital allocation patterns, potentially affecting carry trade flows into emerging economies.
Conclusion
Carry trade remains one of the most powerful yet risky tools in global finance. Its allure stems from the ability to generate profits from simple interest rate differences — a concept that encapsulates the essence of international capital mobility. However, the strategy’s success depends on stable macroeconomic conditions, disciplined risk management, and accurate forecasting of currency dynamics.
In times of global stability and optimism, carry trades can deliver consistent profits and contribute to global liquidity. But in periods of uncertainty or crisis, they can reverse sharply, amplifying volatility and risk contagion. As the global economy continues to evolve through cycles of inflation, monetary tightening, and digital innovation, carry trade will remain a central, albeit double-edged, element of the international financial landscape.
Netflix Buying OpportunityNetflix shares have dropped sharply — losing around 10% of their value in just one day, wiping billions from its market cap. The decline followed disappointing earnings results and a one-off $619 million tax charge in Brazil, overshadowing strong revenue growth.
On the chart, price has tapped into a fair value gap created earlier — the gap between the first and third candle, where price hadn’t yet rebalanced liquidity. This area often acts as a strong demand zone, suggesting a potential short-term bottom.
If price holds above this level, the next possible targets could be:
🎯 $1,267 — about +13% from current levels
🎯 $1,341 — about +20% from current levels
Despite the sharp correction, Q4 guidance remains strong — Netflix expects revenue around $11.96B, a 17% YoY increase, and operating income near $2.86B.
⚠️ While volatility remains high, this drop may offer a strategic buying opportunity for those watching Netflix’s long-term growth story.

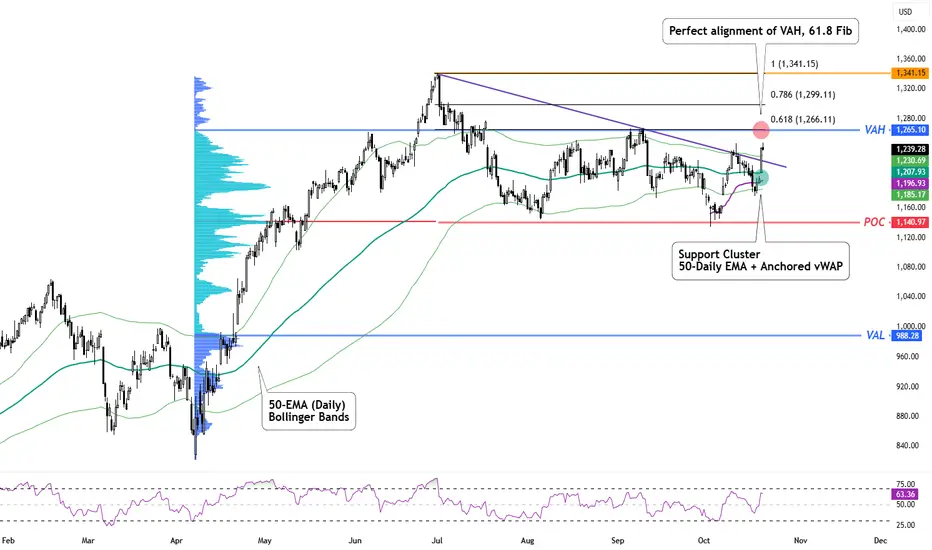
NFLX Earnings Today - Levels to WatchNetflix (NFLX) releases its Q3 earnings today, and sentiment is leaning bullish.
Analysts expect revenue around $11.5 billion (+17% YoY) and EPS near $6.96, supported by optimism around its ad-tier and paid-sharing model.
🌿 This signals growth.
For Q2 2025, Netflix posted revenue of about $11.08 billion, up roughly 15.9% YoY.
For Q3 2025, analysts are projecting around $11.51 billion in revenue, up ~17% YoY.
However, expectations are already high, meaning even a solid report might not trigger a strong rally unless guidance impresses .
Watch these levels:
$1,265 - Strong alignment of 61.8 Fib Resistance + Value Area High of April Rally
$1,196 - $1,207 - Cluster of Daily 50-EMA + Anchored vWAP of its recent mini rally
Overall bias: bullish but cautious — momentum favours the upside, but guidance and ad-tier results will decide if this breakout has real legs.
Nflx I think the top has being made and a correction will happens . monthly Macd showing bulls are exahusted history I think meta and nflx are done for a while better staying away from those two if going long but that’s just my opinion .

Key Levels to Watch for the Stock's Next MoveHas it broken the long-term trendline?
Is it the correction bottom and a reversal from the channel's lower bound?
De-Dollarization and Global Currency ShiftsIntroduction
For over seven decades, the U.S. dollar has been the undisputed king of global finance — the preferred reserve currency, the benchmark for international trade, and the foundation of global capital markets. However, recent years have seen increasing talk and tangible actions toward de-dollarization — the gradual movement away from dependence on the U.S. dollar in global trade, finance, and reserves. This shift is not merely theoretical but increasingly visible in trade agreements, reserve allocations, and cross-border payment systems. Understanding this process requires exploring its historical roots, current dynamics, major players, and the profound implications for the global economy.
1. Historical Dominance of the U.S. Dollar
The dollar’s dominance began after World War II, cemented through the Bretton Woods Agreement of 1944, which established the dollar as the central currency in the international monetary system. Under this system, other currencies were pegged to the dollar, which itself was backed by gold at a fixed rate of $35 per ounce. The U.S. economy, being the largest and most stable, became the anchor of global trade and finance.
Even after the Nixon Shock of 1971, when the U.S. abandoned the gold standard, the dollar maintained its supremacy due to America’s economic might, deep financial markets, and the establishment of the petrodollar system — where oil and other commodities were priced and traded in U.S. dollars. This gave the U.S. an “exorbitant privilege,” enabling it to run large deficits and influence global financial flows without losing credibility.
2. The Concept of De-Dollarization
De-dollarization refers to the global trend of countries reducing their reliance on the U.S. dollar for international trade, reserves, and financial transactions. It encompasses several dimensions:
Trade De-dollarization: Using alternative currencies for bilateral or multilateral trade settlements.
Financial De-dollarization: Diversifying reserves and foreign assets away from the dollar.
Institutional De-dollarization: Creating mechanisms that bypass U.S.-dominated systems like SWIFT.
While the dollar still dominates, de-dollarization is gradually reshaping the landscape, driven by economic pragmatism, geopolitical tensions, and the desire for monetary sovereignty.
3. Factors Driving De-Dollarization
a. Geopolitical Motivations
The most significant catalyst has been geopolitics. The U.S. has frequently used the dollar as a geopolitical weapon, imposing sanctions on nations like Russia, Iran, and Venezuela. This weaponization of the dollar has alarmed countries that fear similar vulnerabilities. For example, after Russia’s exclusion from the SWIFT system in 2022, Moscow and Beijing accelerated moves to use their national currencies for trade.
b. Economic Diversification
Emerging economies, especially China, India, Brazil, and Russia, are seeking greater autonomy in financial dealings. Holding large dollar reserves exposes them to U.S. monetary policy and inflation risks. Diversifying into gold, yuan, or euro assets reduces exposure to dollar volatility.
c. Rise of Alternative Economic Blocs
The BRICS alliance (Brazil, Russia, India, China, and South Africa) has become a strong advocate for a multipolar currency system. Their growing share of global GDP and trade makes it feasible to trade among themselves in local currencies, reducing the dollar’s centrality.
d. Technological Innovation and Digital Currencies
Blockchain technology and Central Bank Digital Currencies (CBDCs) are providing infrastructure for cross-border payments independent of the dollar system. China’s digital yuan and experiments by the European Central Bank and Reserve Bank of India are examples of monetary innovation accelerating de-dollarization.
e. U.S. Fiscal and Monetary Policies
Massive U.S. debt, persistent deficits, and inflationary pressures have raised concerns about long-term dollar stability. As the Federal Reserve’s interest rate policies cause volatility in global markets, many nations seek alternatives to reduce vulnerability to U.S. economic cycles.
4. Key Players in the De-Dollarization Movement
China
China is at the forefront of de-dollarization. Through its Belt and Road Initiative (BRI), it has expanded yuan-denominated trade and investment. The Cross-Border Interbank Payment System (CIPS) is Beijing’s alternative to SWIFT, facilitating international settlements in yuan. The digital yuan (e-CNY) further strengthens China’s ability to bypass the dollar in trade.
Russia
Following Western sanctions after the annexation of Crimea (2014) and the 2022 Ukraine war, Russia drastically reduced its dollar holdings, increasing reserves in gold and yuan. Russian oil and gas are now traded with countries like China and India in local currencies or through barter mechanisms.
India
India has begun signing bilateral trade agreements that allow settlement in Indian Rupees (INR). For example, the INR-Vostro account system facilitates trade with countries like Russia and Sri Lanka. India’s cautious yet steady participation highlights its interest in a diversified currency regime without abruptly destabilizing its financial relations with the West.
Middle East and Africa
Saudi Arabia, traditionally a key pillar of the petrodollar system, has signaled openness to accepting yuan or euros for oil sales, particularly with China. African nations engaged with BRICS and China’s infrastructure projects are also using local currency or yuan settlements, contributing to the multipolar trend.
European Union
The euro remains the second-most used currency in global reserves. The EU’s promotion of the euro in energy and technology trade aims to strengthen its global role and reduce dependence on U.S. financial systems, particularly in the face of unilateral sanctions.
5. Mechanisms of De-Dollarization
a. Bilateral Currency Swaps
Central banks are entering currency swap agreements, enabling direct trade in local currencies. China has over 40 such agreements worldwide, including with nations like Argentina, Pakistan, and Russia.
b. Local Currency Settlements
Countries like India, Brazil, and Indonesia are developing systems for local currency trade settlements, bypassing the dollar in invoicing and payment processing.
c. Multilateral Platforms
The Asian Infrastructure Investment Bank (AIIB) and the New Development Bank (BRICS Bank) are examples of financial institutions providing loans and investments in local currencies rather than dollars.
d. Gold Accumulation
Several nations have increased gold reserves as a hedge against dollar volatility. Central banks worldwide, led by China and Russia, are buying gold at record levels, viewing it as a neutral asset outside U.S. control.
6. Implications for Global Trade and Finance
a. Reduced Dollar Demand
As trade and financial flows diversify, global demand for U.S. dollars may decline gradually. This could weaken the dollar’s exchange rate and reduce the U.S.’s ability to finance its deficits cheaply.
b. Rise of Multipolar Currency System
A more balanced currency system may emerge, dominated by the U.S. dollar, euro, and Chinese yuan, with regional currencies playing niche roles. This diversification could enhance global stability but complicate exchange rate management and liquidity flows.
c. Shifts in Reserve Composition
According to IMF data, the dollar’s share of global reserves has declined from over 70% in 2000 to about 58% in 2024. This trend is expected to continue as central banks increase allocations to gold, yuan, and other assets.
d. New Trade Alliances
Countries prioritizing local currency trade are forming new alliances and payment networks, reshaping global trade routes. For instance, the India-Russia-China corridor and BRICS payment system are notable examples.
e. Impact on U.S. Influence
De-dollarization could gradually diminish U.S. geopolitical leverage. The ability to impose sanctions, control global liquidity, or influence monetary policy worldwide would be reduced. However, this process will likely be slow, given the depth and liquidity of U.S. financial markets.
7. Challenges and Limitations
While the momentum toward de-dollarization is real, several constraints limit its pace:
a. Lack of Deep Capital Markets
The U.S. still offers the largest, most liquid, and transparent capital markets. Alternatives like the yuan or rupee lack full convertibility, regulatory clarity, and global trust.
b. Network Effects
Once a currency dominates, it benefits from self-reinforcing network effects. Most global commodities are priced in dollars, and firms prefer it due to stability and universal acceptance.
c. Political and Institutional Trust
Many countries still view the U.S. legal and financial framework as safer than those of emerging powers. China’s capital controls and Russia’s geopolitical isolation hinder full global acceptance of their currencies.
d. Technological Fragmentation
Although CBDCs and digital platforms offer alternatives, interoperability and security issues remain unresolved. Competing systems could lead to inefficiency rather than integration.
8. Future Outlook: The Road Ahead
The world is unlikely to see the immediate end of the dollar era, but a gradual rebalancing is underway. The next decade could witness:
A tripolar currency system led by the U.S. dollar, euro, and Chinese yuan.
Expansion of digital and regional currencies for trade within Asia, Africa, and Latin America.
Declining U.S. dominance in global reserves but continued dollar primacy due to market depth.
Growth of commodity-backed and digital settlement systems to stabilize cross-border payments.
The dollar’s resilience should not be underestimated — it remains a symbol of trust, backed by strong institutions and deep markets. Yet, as emerging powers grow and technology disrupts traditional finance, the unipolar dollar era is transforming into a multipolar monetary order.
Conclusion
De-dollarization represents one of the most significant shifts in the global economic landscape of the 21st century. It is not an overnight revolution but a gradual evolution driven by geopolitical tensions, technological progress, and the rise of new economic powers. While the U.S. dollar will likely remain dominant for the foreseeable future, its uncontested supremacy is fading. The emerging multipolar currency world — led by the dollar, yuan, and euro — will redefine global finance, trade, and geopolitics.
In essence, de-dollarization is not just a financial adjustment; it is a statement of sovereignty, resilience, and the world’s ongoing journey toward a more balanced and diversified economic order.

Participants Coverage on the Global MarketIntroduction
The global financial market is a vast, interconnected ecosystem where capital flows across borders, industries, and asset classes. Every movement—whether in currencies, equities, bonds, or commodities—is influenced by a diverse set of participants. These market participants include institutional investors, retail traders, corporations, governments, and intermediaries such as brokers, exchanges, and regulators. Each plays a distinct role in ensuring market efficiency, liquidity, and stability. Understanding who these participants are, their objectives, and their impact on global markets is essential for comprehending how financial systems operate today.
1. The Structure of the Global Market
Before exploring the participants themselves, it’s important to understand the composition of the global market. Broadly, it consists of five major segments:
Equity Markets – Platforms where shares of companies are issued and traded. Examples include the New York Stock Exchange (NYSE), London Stock Exchange (LSE), and NSE India.
Fixed Income (Bond) Markets – Where governments and corporations issue debt securities to raise capital.
Foreign Exchange (Forex) Market – The largest and most liquid market globally, facilitating currency conversion for trade and investment.
Commodity Markets – Where raw materials like oil, gold, and agricultural products are traded via spot or futures contracts.
Derivatives Markets – Markets for instruments whose value derives from underlying assets (e.g., options, swaps, futures).
All these markets are influenced by a range of participants, each contributing to the dynamic flow of capital and information.
2. Key Market Participants
A. Institutional Investors
Institutional investors are large organizations that manage vast pools of money on behalf of others. They are the cornerstone of global finance, accounting for the majority of trading volume.
Types include:
Mutual Funds and Exchange-Traded Funds (ETFs): Manage diversified portfolios for retail investors.
Pension Funds: Invest to secure long-term retirement benefits.
Insurance Companies: Allocate premiums into safe or high-yielding assets.
Hedge Funds: Engage in complex strategies, including short selling, arbitrage, and derivatives trading.
Sovereign Wealth Funds (SWFs): State-owned investment funds managing national reserves (e.g., Norway’s Government Pension Fund, Abu Dhabi Investment Authority).
Impact on the market:
Institutional investors bring stability, depth, and liquidity. However, their large-scale movements can also create systemic risk if poorly managed—as seen during the 2008 global financial crisis.
B. Retail Investors
Retail investors are individual participants who invest their personal funds in stocks, bonds, mutual funds, or other assets. Over the last decade, the democratization of finance—driven by mobile trading apps and online brokers—has dramatically increased retail participation.
Characteristics:
Generally invest smaller sums compared to institutions.
Often motivated by personal goals like wealth creation or retirement.
May follow market sentiment, trends, or social media-based movements (e.g., GameStop and AMC “meme stock” rallies).
Influence on the market:
Retail investors contribute to liquidity and diversity of opinion in the market, though they may also introduce volatility due to herd behavior or lack of risk management.
C. Corporations
Corporations participate in financial markets both as issuers and investors. They issue equity (stocks) or debt (bonds) to raise capital for expansion, acquisitions, or working capital. Multinational corporations (MNCs) also engage heavily in foreign exchange markets to hedge currency exposure.
Example:
Apple Inc. issues corporate bonds to finance buybacks or R&D.
Toyota hedges yen-dollar exposure to protect export margins.
Market role:
Corporate actions—like stock buybacks, mergers, or dividend announcements—often trigger major market reactions and influence investor sentiment.
D. Governments and Central Banks
Governments and their monetary authorities play a crucial role as both market participants and regulators.
Key roles:
Issuing Sovereign Debt: Governments raise capital by issuing treasury bonds (e.g., U.S. Treasuries, Indian G-secs).
Regulating Markets: Through agencies like the U.S. SEC or India’s SEBI, governments ensure transparency and investor protection.
Central Bank Interventions: Central banks like the Federal Reserve, European Central Bank (ECB), and Reserve Bank of India (RBI) influence global markets via monetary policy—adjusting interest rates, managing inflation, and stabilizing currencies.
Influence:
Their decisions on rates, liquidity, and currency management directly impact asset prices globally. For example, a rate hike by the Fed strengthens the dollar but often weakens emerging market currencies.
E. Financial Intermediaries
Financial intermediaries bridge the gap between investors and markets. They include:
Brokers and Dealers: Facilitate buying and selling of securities.
Investment Banks: Underwrite new securities issues, assist in mergers and acquisitions, and provide advisory services.
Clearing Houses: Ensure the settlement of trades and reduce counterparty risk.
Custodians: Safeguard assets held by institutional investors.
These intermediaries form the backbone of market operations, ensuring liquidity, transparency, and efficiency.
F. Speculators, Arbitrageurs, and Traders
Speculators and arbitrageurs actively seek short-term profits by exploiting market inefficiencies.
Speculators: Take calculated risks by forecasting price movements.
Arbitrageurs: Profit from price discrepancies across markets or instruments.
High-Frequency Traders (HFTs): Use algorithms to execute trades in milliseconds, contributing to liquidity but sometimes amplifying volatility.
These participants keep markets efficient by correcting mispricings and improving liquidity, though their activities can heighten short-term volatility.
G. Credit Rating Agencies and Analysts
While not direct investors, rating agencies such as Moody’s, S&P Global, and Fitch play a vital role in assessing creditworthiness. Their ratings influence borrowing costs for governments and corporations and guide investor decisions globally. Similarly, financial analysts and research institutions provide data, forecasts, and sentiment analysis that shape investment flows.
H. Regulators and International Institutions
Regulatory bodies ensure the smooth and ethical functioning of markets. They protect investors, enforce transparency, and curb manipulation.
Examples:
SEC (U.S.)
FCA (U.K.)
SEBI (India)
ESMA (Europe)
Internationally, organizations like the IMF, World Bank, and Bank for International Settlements (BIS) coordinate financial stability efforts and monitor systemic risks.
3. Geographic Coverage of Market Participants
Global market participants are distributed across key financial centers:
North America: Dominated by U.S. institutions—Wall Street houses the largest hedge funds, banks, and asset managers like BlackRock and Vanguard.
Europe: London, Frankfurt, and Zurich are major hubs for banking, forex, and insurance.
Asia-Pacific: Hong Kong, Singapore, Tokyo, and Mumbai are leading centers for equity and derivatives trading.
Middle East: Rising influence due to oil wealth and sovereign funds (e.g., Qatar Investment Authority).
Africa and Latin America: Emerging participants with growing stock exchanges and commodity exposure.
This global coverage allows continuous 24-hour trading cycles, connecting markets through technology and capital flows.
4. The Interconnectedness of Global Participants
The modern financial system is highly interconnected. Institutional investors diversify globally; central banks coordinate on policy; and technology ensures real-time market reactions. This interconnection has benefits and risks:
Benefits:
Efficient capital allocation across borders.
Access to international funding and investment opportunities.
Diversification reducing country-specific risk.
Risks:
Contagion effects—financial crises in one country can quickly spread worldwide (as seen in 2008).
Increased volatility due to synchronized trading behavior.
Policy spillovers when major economies adjust monetary or fiscal measures.
5. Technology and the Rise of New Participants
The digital revolution has redefined market participation.
Algorithmic and Quantitative Funds: Use data-driven models and AI to make investment decisions.
Fintech Platforms: Empower retail investors with real-time trading, robo-advisors, and zero-commission brokerage.
Cryptocurrency Participants: A new segment of traders, miners, and blockchain investors now operate in digital asset markets—creating a parallel global market ecosystem.
Data Providers and Tech Firms: Companies like Bloomberg, Refinitiv, and FactSet provide analytics essential for decision-making.
Technology has democratized market access but also introduced cybersecurity and regulatory challenges.
6. Behavioral Dynamics among Market Participants
Each participant operates under different motivations and risk appetites, influencing overall market psychology.
Institutions seek steady, long-term returns.
Retail investors often react emotionally to news or trends.
Governments and central banks act strategically to balance growth and stability.
Speculators and traders thrive on volatility.
These behaviors collectively create market cycles of greed and fear, driving booms, corrections, and recoveries.
7. Challenges Faced by Global Market Participants
Regulatory Divergence: Different countries have varied financial regulations, complicating cross-border operations.
Geopolitical Risks: Wars, trade tensions, and sanctions disrupt capital flows.
Climate and ESG Pressures: Investors increasingly prioritize sustainability, forcing companies and funds to adjust portfolios.
Interest Rate Uncertainty: Central bank policies impact valuation models and investment flows.
Currency Volatility: Multinationals and investors must manage exchange-rate risks amid fluctuating global monetary policies.
8. The Future of Global Market Participation
The future will see a broader and more inclusive set of participants, driven by:
Digital Assets: Wider institutional adoption of cryptocurrencies and tokenized securities.
ESG Integration: Environmental and social governance becoming a standard investment metric.
AI and Automation: Machine learning optimizing portfolio management and risk analytics.
Retail Empowerment: Continued growth of individual participation through education and technology.
Cross-border Integration: Regional cooperation in Asia, Africa, and Latin America expanding investment networks.
The global market is evolving toward inclusivity, transparency, and digital transformation, creating new opportunities and challenges for every participant.
Conclusion
The global market is a living, breathing organism powered by a complex network of participants—each with unique objectives, time horizons, and influences. Institutional investors provide depth and capital; retail investors bring vibrancy and democratization; governments and central banks ensure stability; and intermediaries maintain operational efficiency. Together, they form the backbone of global finance.
In an era of accelerating globalization, technology, and policy interdependence, understanding market participants’ roles is more critical than ever. The health of the global economy ultimately depends on how these diverse actors interact—balancing risk, opportunity, and regulation in pursuit of sustainable financial growth.

Netflix: Decoded AnalysisNetflix upper supports are noted at $895 & $700 with a very strong support at $608.
Middle supports are observed at $298 and $125.
However, if the $600 support level is broken, the next major support this quarter is around $125.
The lowest support is projected for July/Oct 2026 at $4.22.
Above resistance noted at $1711 and $1760 for the first & second quarter of 2026.
This message is for educational purposes.
Always DYOR
Note: Tradingview view doesn't allow me to share my technical analysis chart.
NFLX: The Wyckoff mark-down phase is confirmed!The pre-earnings rally to $1,238 was a classic Wyckoff bull trap, an Upthrust After Distribution (UTAD). The earnings miss was the catalyst, and today's chart shows the devastating "effect" of the "cause" built during that distribution.
The volume-momentum indicators are in a "Red-to-Red" state, indicating a "strong continuation of a bearish trend".
Short into a rally near $1,150 - $1,165. (e.g., Buy Nov $1150 Put, Sell Nov $1100 Put)
Globalization and DeglobalizationIntroduction
Globalization has been one of the most defining forces of the modern era. It refers to the process by which businesses, cultures, technologies, and governments across the world become interconnected and interdependent. From the late 20th century onwards, globalization accelerated rapidly due to advances in communication, transportation, and digital technologies. This process transformed the global economy into an integrated system, allowing for free trade, capital flows, and cultural exchange on an unprecedented scale.
However, the 21st century has also witnessed the emergence of an opposite trend — deglobalization. This refers to the gradual slowing down, reversal, or reconfiguration of globalization. Rising nationalism, trade wars, pandemics like COVID-19, and geopolitical tensions have encouraged countries to reconsider global interdependence. Understanding both globalization and deglobalization is crucial to comprehend how today’s world economy and politics are evolving.
Concept of Globalization
Globalization can be defined as the increasing integration and interdependence of national economies and societies through the cross-border flow of goods, services, technology, capital, and information. It breaks down barriers between countries, fostering economic cooperation and cultural exchange.
The phenomenon of globalization is not new — it began centuries ago with trade routes such as the Silk Road, connecting Asia and Europe. However, the modern wave of globalization began in the late 20th century, following the end of World War II, the creation of international institutions like the IMF, World Bank, and WTO, and the liberalization of markets worldwide.
Drivers of Globalization
Technological Advancements
Innovations in communication (like the internet, smartphones, and social media) and transportation (such as air travel and container shipping) have dramatically reduced costs and time barriers, making the world more connected.
Trade Liberalization
Free trade agreements (FTAs), the reduction of tariffs, and the establishment of the World Trade Organization (WTO) have encouraged global trade, allowing goods and services to move freely across borders.
Foreign Direct Investment (FDI)
Multinational corporations (MNCs) have expanded operations across countries, investing in developing nations and creating global production chains.
Outsourcing and Offshoring
Companies increasingly locate production in countries with cheaper labor or better resources. For example, manufacturing moved to China and India became a hub for IT services.
Financial Integration
Capital markets have become interconnected, enabling investments and capital to move globally with ease.
Cultural Exchange
The spread of media, tourism, and migration has led to a blending of cultures, making the world more cosmopolitan.
Dimensions of Globalization
Globalization has multiple dimensions:
Economic Globalization – Integration of national economies through trade, investment, and capital flow.
Political Globalization – Growing influence of international organizations and global governance structures such as the UN, WTO, IMF, and World Bank.
Cultural Globalization – The spread of ideas, languages, and lifestyles, often leading to cultural homogenization.
Technological Globalization – Rapid global diffusion of technologies, especially in communication and automation.
Environmental Globalization – Global cooperation in addressing issues like climate change and sustainability.
Positive Impacts of Globalization
Economic Growth
Globalization has led to rapid growth in many developing countries. By opening markets, nations like China, India, and Vietnam have lifted millions out of poverty.
Access to Technology and Knowledge
It allows developing nations to access advanced technologies and global expertise.
Employment Opportunities
New industries and global supply chains create millions of jobs, especially in emerging markets.
Cultural Exchange and Diversity
Globalization promotes multiculturalism, allowing people to experience different cuisines, fashions, and entertainment.
Global Cooperation
It enhances international cooperation in tackling global issues like pandemics, climate change, and terrorism.
Negative Impacts of Globalization
Economic Inequality
While globalization increases wealth, it often benefits the rich more than the poor, widening the gap between developed and developing nations.
Exploitation of Labor and Resources
Multinational companies may exploit cheap labor in developing countries, leading to poor working conditions and environmental degradation.
Cultural Homogenization
Local cultures and traditions are overshadowed by Western consumer culture.
Job Losses in Developed Nations
Outsourcing and relocation of industries to low-cost regions lead to unemployment in advanced economies.
Environmental Challenges
Increased industrial activity and global transportation contribute to pollution and climate change.
The Emergence of Deglobalization
After decades of rapid integration, the world is now witnessing a phase of deglobalization. Deglobalization refers to the process of reducing interdependence and integration between nations. It does not mean the end of globalization but rather a reconfiguration or slowdown of global integration.
The early 21st century saw signs of this shift, with trade tensions, supply chain disruptions, and rising nationalism. Events like the 2008 global financial crisis, Brexit, the U.S.-China trade war, and the COVID-19 pandemic intensified the trend.
Causes of Deglobalization
Geopolitical Tensions
Rivalries between major powers like the United States and China have disrupted global trade and technology partnerships.
Economic Protectionism
Many countries are adopting protectionist measures to safeguard domestic industries, reversing decades of trade liberalization.
Pandemic Disruptions
COVID-19 exposed vulnerabilities in global supply chains, prompting companies to adopt “localization” or “nearshoring” strategies.
Technological Nationalism
Nations are increasingly prioritizing self-sufficiency in critical technologies like semiconductors, defense, and energy.
Environmental Concerns
Global supply chains are criticized for their carbon footprint, leading to policies encouraging local production.
Populist and Nationalist Movements
Political leaders in several countries emphasize nationalism, sovereignty, and “self-reliance,” often at the expense of global cooperation.
Characteristics of Deglobalization
Shift from global to regional supply chains.
Rising tariffs and trade barriers.
Greater emphasis on domestic manufacturing (e.g., “Make in India,” “America First,” “China’s Dual Circulation”).
Increased scrutiny of foreign investments for national security reasons.
Slower global trade growth compared to GDP growth.
Reassessment of global dependencies, especially in energy, food, and pharmaceuticals.
Impact of Deglobalization
Economic Impact
Deglobalization may slow global growth and reduce trade efficiency. However, it can strengthen domestic industries and reduce external vulnerabilities.
Supply Chain Restructuring
Companies are diversifying or relocating supply chains to minimize risks — a shift from “just-in-time” to “just-in-case” production models.
Shift in Investment Patterns
FDI flows are becoming more regional, and investment in strategic sectors is prioritized over global expansion.
Technological Decoupling
The U.S. and China are developing separate ecosystems in technology, telecommunications, and AI, creating a fragmented digital world.
Social and Political Impact
Rising nationalism can lead to social polarization, xenophobia, and less international cooperation.
Environmental Outcomes
While local production reduces transport emissions, duplication of industries globally may increase overall resource consumption.
Globalization vs. Deglobalization
Aspect Globalization Deglobalization
Economic Focus Free trade, open markets Protectionism, self-reliance
Supply Chain Global, interconnected Regional, localized
Cultural Impact Cultural exchange, hybridization Preservation of local culture
Political Approach Global cooperation National sovereignty
Growth Model Efficiency-driven Resilience-driven
Technology Flow Shared innovations Restricted technology access
Examples from Around the World
United States
The U.S. has shifted toward protectionism with policies like “America First” and reshoring manufacturing from China.
China
China’s “Dual Circulation Strategy” emphasizes domestic consumption while reducing reliance on exports.
European Union
The EU promotes “strategic autonomy,” aiming to be less dependent on external suppliers for energy and defense.
India
India’s “Atmanirbhar Bharat” (self-reliant India) initiative encourages local manufacturing and innovation while maintaining global engagement.
Global South
Many developing nations are balancing between globalization’s benefits and the need for self-sufficiency in food, energy, and technology.
Future of Globalization and Deglobalization
The world is unlikely to witness a complete end to globalization. Instead, the future will likely involve “selective globalization” — a hybrid model that balances global efficiency with local resilience.
Digital globalization will continue to grow through online services, data flows, and virtual collaboration.
Regional trade blocs (like RCEP, ASEAN, and EU) may replace full-scale global integration.
Nations will cooperate in areas like climate change, health, and technology, while competing in strategic sectors.
This evolving structure may lead to a multipolar world — with multiple centers of power and influence instead of a single dominant global order.
Conclusion
Globalization has been a transformative force shaping the modern world, driving economic growth, technological innovation, and cultural exchange. Yet, it has also produced inequalities, environmental stress, and geopolitical vulnerabilities. Deglobalization, in contrast, represents a corrective phase — a rethinking of excessive interdependence and a move toward resilience and regionalism.
The challenge for the future is to strike a balance between the efficiency of globalization and the security of deglobalization. The goal should not be to isolate nations but to build a sustainable, inclusive, and resilient global order that benefits all. In the decades to come, the world’s prosperity will depend not on retreating from globalization but on redefining it to serve humanity in a fairer, more balanced way.
NFLX LongReasoning:
Strong volume day before earnings, stock may gap up on earnings!!!
Remember: Every long-term investment alert can also be played as a swing trade.
Long-Term Investors (3-12 Month Holds)
Entry: Full position on breakout
Profit Taking: Sell 1/4 to 1/5 at Goal 1
Exit Signal: Close below 20-day EMA (your trend guide) or 50EMA
Why: Strong moves are hard to time at the top, but the 20EMA acts as a reliable trend filter
Swing Traders (2-6 Week Holds)
Entry: Full position on breakout
Profit Taking: Sell 1/3 at Goal 1
Final Exit: Remainder at Goal 2
