NVDA to $170? AI Bubble Risk, Big Money Exits & Heavy Shorts !I f you haven`t bought NVDA before the previous earnings:
Now you need to know that NVIDIA has dominated 2023–2025, becoming the face of the global AI boom. But the higher the climb, the harder the fall. While NVDA is still seen as “untouchable,” several major signals suggest the stock could revisit levels near $170 — a healthy correction of 10–15% from here.
1. Major Investors Are Exiting — SoftBank Dumped Everything
SoftBank, one of Nvidia’s earliest and most influential institutional backers, sold its entire stake in late 2025, worth roughly $5.8 billion.
Smart-money exits near all-time highs should never be ignored.
SoftBank rarely sells unless it believes:
- the sector is overheated
- the valuation has run too far
- risk/reward becomes asymmetric
This mirrors their strategy in 2021–2022 when they unloaded overvalued tech before the correction.
SoftBank’s full exit is a red flag for anyone ignoring the possibility of an AI bubble.
2. Michael Burry Bought Massive Puts — A Direct Bet Against the AI Mania
Michael Burry — famous for predicting the 2008 crisis — has quietly increased his put positions on NVIDIA and other AI names.
Why does this matter?
Because Burry doesn’t short “normal” overvaluations.
He shorts bubbles.
His AI thesis:
- expectations are unrealistic
- revenue growth is priced as infinite
- companies are spending billions on AI with no short-term monetization
- chip demand could normalize faster than markets expect
When a contrarian with Burry’s track record bets against a trend, it’s worth paying attention.
3. NVIDIA’s Valuation Is Stretched Even for a Hyper-Growth Company
Even bulls agree: NVDA’s multiples are once again aggressively priced.
Key issues:
• Price-to-Sales historically elevated
NVDA is trading at a P/S ratio that would be insane for any company approaching a $5 trillion market cap.
• Revenue growth expectations assume perfect long-term AI adoption
If AI monetization slows or plateaus even slightly, NVDA’s valuation collapses fast.
4. Are We in an AI Bubble? Many Indicators Say Yes
Top analysts, academics, and even bullish investors admit:
AI has bubble-like behavior.
Evidence of a bubble:
- Stock prices rising faster than actual earnings growth
- Companies buying GPUs “because everyone else is doing it”
- Zero clarity on monetization for many AI firms
- AI startups valued at billions with no revenue
- Media hype similar to 1999 dot-com sentiment
Harvard Business Review, Wired, and Investopedia already discuss the “AI bubble thesis.”
If AI expectations don’t materialize fast enough, NVDA becomes the single most vulnerable stock on the market.
Trade ideas

Nvidia nov-dec 2025 end yearPrice in the middle of weekly range ($178.91–$200.05) at phase 1 to 2
EMA alignment confirms bearish weekly trend
i believe NVIDIA might dip to $160 - $170 (near the gap it has created/ 1 x A Fib extension levels), with downward pressure due to overvaluations

Pre-Nvidia Q3 2025 EARNINGS - Two Scenarios to WatchNVDA is sitting right on the Anchored VP POC with an oversold Stoch RSI and price trading under the EMA-20 Bollinger band (1 std). That’s the same setup that has triggered reversion bounces multiple times this year.
Scenario 1 — Bounce and Band Chop (Green Path)
If NVDA holds the POC, the most natural move is a bounce back into the EMA-20 band's high.
From there, expect price to whip around inside the band because that’s been its early 2025 behaviour: revert → chop → retest.
The upper band sits just under $200, a psychological and structural resistance.
This is the high-probability scenario if earnings are neutral or strong.
Scenario 2 — Break Below POC and Turn It into Resistance (Red Path)
If earnings disappoint and NVDA gaps below the POC tomorrow, that same level becomes a potential resistance on any intraday bounce.
But — and this is the part many people miss —
Scenario 1 is still valid unless we get a clear rejection from the underside of POC.
Meaning:
A break below POC is not automatically a trend shift
A failed reclaim with a clean rejection is the real confirmation
Only then do we look toward the next structural level at the Jan Top zone around 155–160.
NVDA is at a decision point. Earnings drop after today’s close — the real move will be at tomorrow’s open. Whether we bounce into the band or reject off the POC will tell you everything about the next leg.

How dip can this get ?,bulls needs to defend 181-180 rangeNASDAQ:NVDA bears pushed market lower from a high of 196 ;looking at the chart we see price breaking-through our channel and price trading below our 50 day moving Average ,bulls have to defend 181-180 range a break will signal more selling pressure with remediate support at 177 and 164
NVDA HAGIA SOPHIA!The Hagia Sophia pattern has now fully formed; it just needs the crack! and the Hook!
No matter what your vague hunches and feelings are about AI, the charts will always win.
You can't "buy the dip" unless you know when to "Sell the Rip"!
If you can't see this resistance area, I don't know what to tell you.
Everyone is bullish at the top of a bubbliotious market without exception!
Click boost, Like, Subscribe! Let's get to 5,000 followers. ))
$NVDA | Fib Expansion Points to $212.81 → Is the AI Supercycle JWaverVanir International LLC | Weekly Fibonacci Roadmap
📅 June 25, 2025 | +7.27% Day | Post-Stock Split Momentum
NVIDIA ( NASDAQ:NVDA ) continues to dominate the AI-driven tech rally. After reclaiming the 1.618 Fibonacci level ($128.35), price has broken above the 0.886 retracement ($146.72) and is now pressing higher with bullish volume.
🧠 Fibonacci Insights:
🔺 1.786 Fib Extension: $207.76
🎯 Primary Target: $212.81 (Golden Projection)
🚀 Long-term Fib targets extend into $250–290+ zone (2.618–3.0 extensions)
🔻 Red trendline below signals well-respected diagonal support since early 2023
📊 Price Outlook:
Current Price: $154.31
Short-term Path: Bullish breakout → $168.21 → $178.43
Next Major Resistance: $212.81
Support to Hold: $139.93 / $128.35 (previous Fib clusters)
🧩 Catalysts Ahead:
Q2 Earnings (Late August 2025) – Focus on AI/data center revenue acceleration.
NVIDIA Blackwell GPU shipments – Institutional uptake will confirm pipeline robustness.
AI Sovereign Demand – U.S., UAE, Singapore and Saudi Arabia investing in GPU infrastructure.
AI Arms Race – Competitive moat widening vs. AMD, Intel.
AI App Ecosystem Expansion – Surge in demand for inferencing chips (L4, L40, GB200).
Post-Stock Split Rotation – Retail inflow and fresh institutional allocations.
📌 Summary:
NVIDIA is not just a chipmaker — it’s the core of the modern AI stack. With clear Fibonacci structure and geopolitical tailwinds, the next target is $212.81. Watch dips into $140s for potential reload zones.
🔖 Hashtags:
#NVDA #NVIDIA #AIstocks #WaverVanir #FibExtension #FibonacciTrading #AIboom #BlackwellGPU #GPUpower #PostSplit #TechLeadership #TradingView #SMC #AIarmsrace

NVIDIA (NVDA): Where Are We in the Cycle?Ticker: NVDA
Category: Market Structure / Elliott Wave Analysis
Author’s note: Educational analysis — not financial advice.
🧠 Market Context
NVIDIA has been one of the strongest growth stories in the last market cycle. However, after such a powerful move, many traders are now asking: Where are we in the broader structure — and what could come next?
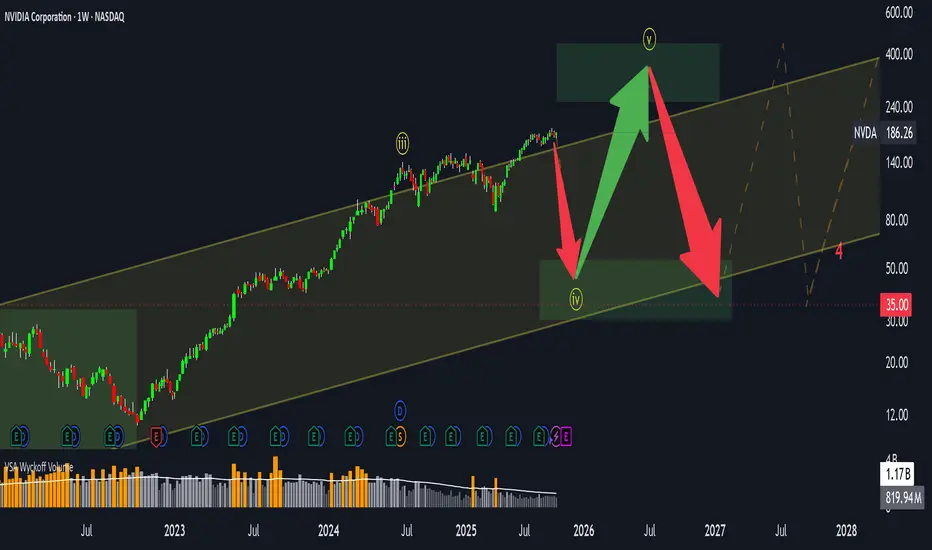
From a structural perspective, NVDA appears to have completed its third Elliott Wave, with the fourth wave currently in progress. This phase often reflects a period of consolidation, where the market digests previous gains before potentially starting the fifth wave.
📊 Elliott Wave Structure
Through the lens of Elliott Wave theory:
Wave 3 — likely completed after the parabolic advance that marked NVIDIA’s latest all-time highs.
Wave 4 — a corrective phase, potentially forming a sideways or slightly downward structure.
Wave 5 (ahead?) — may still occur, possibly extending above the upper boundary of the current price channel.
However, once the fifth wave completes, markets typically enter a longer consolidation or corrective phase — often retracing 50–60% of the total move from the highs.
⚙️ Volatility and Price Range
Currently, NVDA is trading within a broad channel, roughly between $100 and $400+.
Volatility remains elevated — which suggests that the sideways phase could persist for several months, or even longer.
Such behavior is common in late-cycle stages when large market participants distribute part of their holdings while retail interest remains high.
📈 Key Takeaways
The main impulsive move seems to have already played out.
The market may enter a range-bound or sideways phase, with local rallies still possible.
Correction risks are gradually increasing, especially if the fifth wave develops and fails to sustain new highs.
In short, this might not be the best time to chase — but rather to observe how price behaves within the current channel.
💬 Final Thoughts
This analysis is purely educational and reflects one possible scenario based on market structure.
No one can predict the exact timing or depth of the next move — the market always decides.
👉 What do you think?
Are we already in the correction phase, or is there still one more leg up left for NVDA?
Share your view in the comments below 👇
NVDA PUT Trade — QuantSignals Katy High-Conviction ShortNVDA | QuantSignals Katy 1M Prediction (2025-11-21)
Current Price: $178.81
Predicted Close: $173.03 (-3.23%)
30-min Target: $177.19 (-0.91%)
Trend: Bearish
Confidence: 75%
Volatility: 49.6%
Trade Signal
Direction: PUT
Entry: $178.81
Target: $174.18
Stop Loss: $181.49
Expected Move: -3.23%
Summary: 1 trade signal generated from 1 successful analysis.

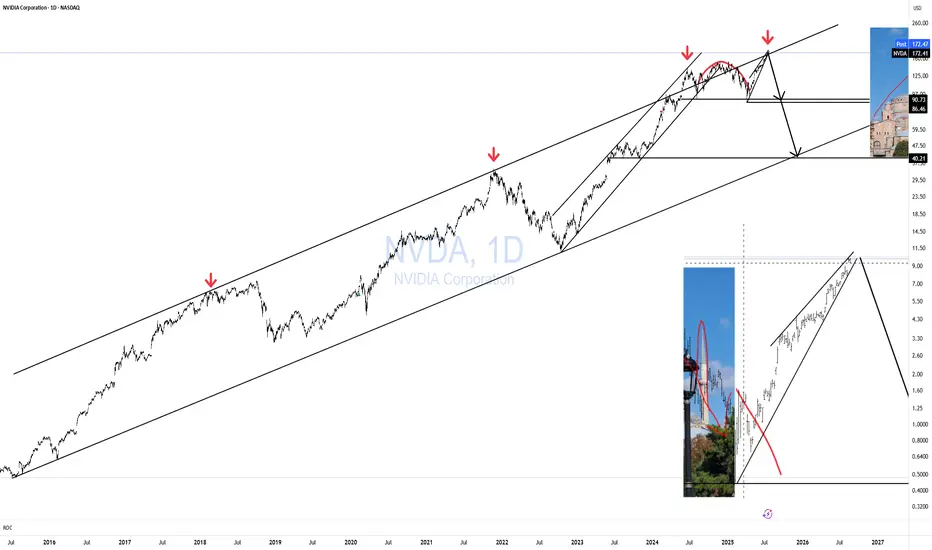
NVDA - The Truth About Nvidia's ReversalAfter an impulse wave always comes a correction. Here you see the wave A going down and the wave B going up. The unexpected reversal everyone is talking about is the start of wave C to the downside.
The insane wave B has run its course and hit the ceiling. There's no more room to go. That's why there was a reversal. It has nothing to do with external forces or circumstances. It's the nature of the Elliott Wave.
All the optimism for Nvidia has been factored into wave B. You can easily tell by how long and extended the wave is. High optimism always accelerates the price, which results in longer impulse waves. In other words, all the juice has been squeezed and there's no more juice to squeeze. Nothing lasts forever. It's time for wave C to make an appearance.

NVIDIA hourly patteren✅ Resistance Levels
Near ~$198.50 as a third resistance point.
Around ~$194.97 as a second resistance zone.
A prior high close‑to ~$212 from recent months that may act as a major ceiling.
✅ Support Levels
Support identified at ~$183.33.
A lower support zone near ~$179.79.
Broad support zone in the ~$182‑187 range from another study.

NVDA Rebounds From Demand Zone, Eyeing $210 Supply AreaNASDAQ:NVDA has shown a strong rebound from the $177–$180 demand zone, signaling potential bullish momentum after a steep correction. The 1-hour chart shows a shift in structure, with higher lows beginning to form, suggesting renewed buyer interest.
As long as the price holds above $182, the short-term outlook remains constructive. A breakout above $190 could accelerate the move toward the $210–$213 supply zone, where sellers previously regained control.
However, if NVDA fails to maintain above $182, the bullish setup may be invalidated, and price could revisit the $177 support.
🟢 Entry: $186–$188
🔴 Invalidation: Below $177
🎯 Target: $210–$213

Nvidia - Squeezing every single bear!🧯NVidia ( NASDAQ:NVDA ) is finally breaking out:
🔎Analysis summary:
Over the course of the past couple of months, Nvidia has been rallying +125%. Considering the market cap of Nvidia, this is already an insane move but clearly not the end. We can still see another +25% from here, before Nvidia will then retest the next resistance.
📝Levels to watch:
$250
SwingTraderPhil
SwingTrading.Simplified. | Investing.Simplified. | #LONGTERMVISION

NVIDIA – Best Buy of the Decade (4T Record but now resistance)🚀🔥 NVIDIA – Best Buy of the Decade Post #6
💡📉 Great but why am I taking half profits Today?
Back in July 2021, I named NVIDIA "The Best Buy of the Decade. " Today, it just hit a mind-blowing milestone — becoming the first company to reach a $4 trillion market cap. But here's the thing... that happened right at major resistance.
From our initial call in 2021 , to the target at $143.85 drawn via parabola in 2023, to the April 2025 re-entry at $95, it’s all on the chart — and it's been a textbook ride so far.
At the current level of $163.89, we’re pressing into serious overhead resistance. This doesn’t mean the story is over — not even close. But it could mean we take a breather before the next leg higher.
🧭 Targets ahead remain unchanged:
🔹 First stop: $182.85
🔹 Long-term vision: $227.41
What started as a bold macro call in 2021 has now become a multi-year thesis with precision updates along the way. This is post #6 in the NVIDIA journey — and if you scroll back through the chart, each piece has built on the last with clarity and conviction.
🎯 NVIDIA is not just a tech stock — it’s the AI backbone. But every cycle has pauses, and this one looks ready for a short rest before we see the next breakout.
Stay sharp, follow the structure, and honor the parabola.
One Love,
The FX PROFESSOR 💙
Additional info, for those who like to dive deeper into NVDA:
🔍 Technical Breakdown Version
For the chartists and structure followers, here’s the breakdown:
📌 2021: Original call — "Best Buy of the Decade"
📌 2023: First parabola plotted, projecting toward $143.85 — target hit precisely
📌 April 2025: Market offered $95 re-entry — second parabola begins
📌 Now: Price sits at $163.89, testing resistance from both structure and Fibonacci
📌 Next levels:
- $182.85 → Key extension level
- $227.41 → Long-term target based on full parabolic arc
Current structure suggests a possible pause before continuation. No need for panic — parabola remains valid unless structure is broken. Volume still supportive, and price action is following projection beautifully.
🧠 AI Macro Narrative Version
The big picture? NVIDIA isn't just another semi stock — it’s the nervous system of the AI revolution.
From gaming → crypto → AI, NVIDIA has consistently been first to adapt, and now it’s the leader in AI hardware infrastructure. The $4 trillion milestone is more than symbolic — it represents capital reallocation toward AI as the next dominant sector.
🧠 Key macro takeaways:
AI demand is insatiable
Data centers need NVIDIA
Generative AI isn't slowing down
Institutions are still buying — not selling
The resistance we see now isn’t weakness — it’s the market pausing to digest before another acceleration. Just like every past cycle... we ride, retrace, reload, and resume.
Disclosure: I am happy to be part of the Trade Nation's Influencer program and receive a monthly fee for using their TradingView charts in my analysis. Awesome broker, where the trader really comes first! 🌟🤝📈

NVDA Weekly Options SignalNVDA Weekly Options Analysis – 2025-11-12
Current Price: $192.38
Trend: Neutral (Weekly Momentum: Bearish -1.73%)
Confidence: 58% | Conviction: Low
Expiry: 2025-11-14 (2 days)
Recommended Strike: $192.50
Technical Overview:
Price in the middle of weekly range ($178.91–$200.05)
EMA alignment confirms bearish weekly trend
VWAP at $190.89 offers near-term support
Volume spike (26.4x previous week) indicates potential capitulation
Options Flow:
Extremely bullish, PCR 0.42 → heavy call buying
Max volume at $262 call shows institutional positioning
High gamma risk, volatility potential elevated
Trade Setup:
Direction: Buy Calls (Long)
Entry: $2.74
Target 1: $3.70 (+35%)
Target 2: $4.50 (+64%)
Stop Loss: $2.05 (-25%)
Position Size: 2% portfolio (Low conviction)
Summary Insight:
Katy AI shows neutral/bearish signals, but options flow suggests bullish institutional interest
High-risk, low-conviction setup; small position recommended
Mixed technicals and news sentiment → use tight risk management
⚠️ Risk Warning:
Conflicting signals → only small size recommended
Not financial advice; educational commentary for QS Premium members

$NVDA NVIDIA CORPORATIONExecutive Summary:
NVIDIA Corporation ( NASDAQ:NVDA ) has demonstrated remarkable resilience and sustained growth over multiple market cycles, consistently defending its leadership position despite intense competition within the semiconductor and AI sectors. This analysis outlines a structured, multi-layered support framework derived from Fibonacci retracement theory, which identifies strategic price levels for potential entry. Our primary area of interest converges around the $150.00 psychological level, which aligns with a key Fibonacci midpoint and is anticipated to serve as a robust zone for buyer participation.
Detailed Technical Framework:
1. A History of Defending Its Turf:
NVDA's impressive performance is not merely a function of bullish markets but a testament to its fundamental dominance, particularly in the parallel processing and AI revolutions. The company has repeatedly validated its market strength by navigating competitive threats and leveraging its technological moat, which in turn has created a foundation of strong investor confidence. This fundamental strength is often mirrored in its technical charts, where pullbacks are frequently met with aggressive buying at key value areas.
2. The Fibonacci Support Ladder: A Tiered Defense System
By applying Fibonacci retracement levels to a significant prior upward swing, we can map a hierarchy of potential support zones. These levels do not operate in isolation but represent a cascading series of defenses where buyers have historically stepped in. Our analysis identifies the following critical tiers, from shallowest to deepest:
First Line of Defense (Shallow Pullback):
23.6% Level ($182.53): This level represents a mild, healthy pullback. A hold here would signify exceptionally strong momentum and would likely be a continuation pattern rather than a deep correction.
Secondary Support Zone (Moderate Correction):
38.2% Level ($164.02): A retracement to this level indicates a more pronounced correction but remains within the bounds of a strong uptrend. This is a common level for institutions to begin accumulating positions.
50.0% Level ($149.39): The halfway point of the prior major move is a critical psychological and technical battleground. A successful bounce from this level suggests the overall bull trend remains intact and that market sentiment has found a balance.
Tertiary & Deep Value Zones (Significant Correction):
61.8% Level ($134.58): Known as the "Golden Ratio," this is a deep retracement that often holds in volatile but fundamentally sound assets. A test of this level would indicate a major correction is underway, presenting a higher-risk but potentially high-reward entry point for long-term believers.
78.6% Level ($113.49): This is a deep, rarely-tested retracement level. A move to this zone would signal a severe market downturn or a fundamental reassessment of the stock, but it would also represent a potentially profound long-term value opportunity.
The Ultimate Major Support:
The $100.00 Psychological Level: Beyond the Fibonacci structure, the triple-digit benchmark at $100.00 stands as a monumental psychological and technical support. It represents a round number that often attracts immense buying interest and would be considered a "line in the sand" for the long-term thesis.
3. Primary Strategic Interest & Risk Management:
While the Fibonacci ladder provides multiple potential entry points, our primary area of strategic interest converges around the $150.00 level. This is not a single price point but a zone encompassing the 50% Fibonacci level at $149.39. The rationale for favoring this zone is twofold:
Technical Significance: It is a classic "value area" in a strong trend, offering a favorable balance of potential upside and managed risk.
Psychological Strength: The $150 level is a major round number that is easy for the market to identify and act upon.
A decisive reversal at or near this $150 zone, confirmed by bullish price action (e.g., hammer candlesticks, increased volume on up-days), would provide a strong signal for capital deployment. As with any investment, this thesis requires disciplined risk management; a sustained break below the deeper supports, particularly the $134.58 (61.8%) level, would necessitate a re-evaluation of the near-term bullish outlook.

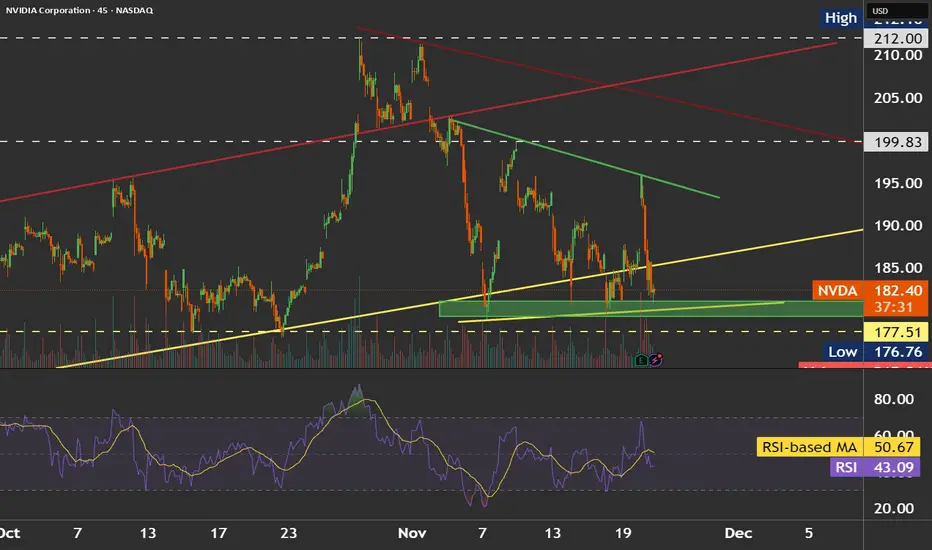
Inflection Point NVDA has a hammerhead candle on a key level and the 50 EMA and the 0.786 Fibonacci level.
Oscillators are flashing oversold. For bullish activity we need a bullish candle with a close above 188.15 and next resistance will be around 191 or 190.70. If price breaks below the 50 EMA(185.19) next key level will be 177.10

NVIDIA Technical Breakdown – November 2025Structure : Price broke out of a descending channel, retested the breakout zone, and is now hovering near a double top resistance.
Fibonacci Confluence: Price is reacting near the 50–61.8% retracement zone, a key decision area for continuation or rejection.
Liquidity Grab: A red-marked zone below shows where stop-losses were likely triggered before reversal — classic accumulation behavior.
Volume & RSI: Volume faded post-breakout, and RSI shows early signs of divergence — momentum is slowing, but not yet reversing.
Scenario Planning:
Bullish: Break and hold above double top zone with volume → target $206–$214.
Bearish: Rejection + RSI divergence → pullback to $183–$178 support.
Watching for confirmation above the double top zone. Liquidity grab + fib confluence suggest potential continuation, but momentum needs to align.
Follow @GoldenZoneFX for more content and valuable insights.

I'm betting for a big pullback in NVDANVDA is still strong in the broader sense, but the shorter-term internal strength (momentum, volume) is waning. If it busts above ~$190-195 with volume, it could resume big.
If it doesn’t, beware the risk of a pullback or consolidation.
Choose your option path accordingly.
NVDA is still strong in the broader sense, but the shorter-term internal strength (momentum, volume) is waning. If it busts above ~$190-195 with volume, it could resume big.
If it doesn’t, beware the risk of a pullback or consolidation. Choose your option path accordingly.

NVDA Big Move Loading. TA for Nov. 12–15NVDA at a Critical GEX Compression Zone
NVDA has been moving like a stock caught between two worlds — heavy enough to stay suppressed, but supported enough to avoid a real breakdown. When you zoom out, the candles almost look like they’re waiting for someone to flip a switch.
In reality, NVDA is not being moved by momentum alone — it’s being shaped by something deeper:
gamma exposure (GEX) compression.
And this GEX structure is telling a very clear story about what’s coming next.
4H Chart — Structure Meets Hidden Liquidity
NVDA has been respecting a rising structural band that stretches across early November. Every major reaction — every sweep, every bounce — has happened along this diagonal liquidity path.
This is not random.
It’s where past BOS and CHoCH events have clustered, and it’s also where NVDA’s GEX shifts from defensive to neutral.
Price recently tapped this diagonal trendline again and stabilized right above the 178–180 GEX shelf. The reaction wasn’t explosive — but it was steady. That’s exactly what you see when larger players are quietly absorbing liquidity.
The story here is simple:
NVDA is compressing toward a decision.
1H Chart — Short-Term Drift Toward a Break
On the 1H timeframe, NVDA’s price is drifting inside a narrow pocket between 188–196. Sellers are pressing from above, but bulls are defending from below — and neither side is gaining ground.
This is classic GEX neutral-pocket behavior:
* Low volatility
* Wicks on both ends
* Lack of follow-through
* Clean candles but no conviction
The moment NVDA breaks OUT of this pocket, the move will be far more decisive than anything we’ve seen this week.
GEX Data — The REAL Battlefield
(Refer to screenshot below)
This GEX landscape is incredibly clear and incredibly important.
🔹 Positive GEX cluster at 200–210
This is the heavy CALL/GEX shelf that acts like a magnet AND a ceiling.
When NVDA pushes into this zone, hedging flows stabilize the move, but upside becomes controlled.
This is why the last rally failed at 202–205.
🔹 Neutral GEX zone between 188–196
This is the pocket where NVDA is trading right now.
Neutral pockets compress price and load energy for the next breakout.
This is where NVDA is stuck — for now.
🔹 Negative GEX zone below 185
This is the danger zone.
If NVDA breaks below 185, hedging pressure flips aggressively bearish.
That’s why 185 is your key line in the sand.
🔥 Trading Suggestions Based on Structure + GEX
📌 Bullish Scenario (Higher Probability)
ONLY valid if NVDA holds above 188–190 and breaks above 195.
ENTRY ZONE:
193–195 (1H reclaim)
TARGETS:
* 197.50 (first GEX magnet)
* 202.50 (second GEX shelf)
* 210.00 (major GEX wall / highest positive NET GEX)
STOP-LOSS:
Below 188
(Below this, NVDA re-enters GEX compression = chop)
WHY IT WORKS:
As soon as NVDA clears 195, it enters a staircase of positive GEX levels. These levels act like magnets and guide price toward the CALL walls.
📌 Bearish Breakdown Scenario
ONLY valid if NVDA loses 185 with conviction.
ENTRY:
Break below 184.80
TARGETS:
* 181.00
* 178.90 (big negative GEX shelf)
* 175.00
STOP-LOSS:
Above 188
WHY IT WORKS:
Below 185, NVDA enters a negative GEX zone, where dealer hedging accelerates selling.
🔥 Options Trading Suggestions (GEX-Based)
📌 Bullish Options Play (if NVDA reclaims 195)
Buy:
NVDA 200C or 205C (1–2 weeks out)
Reason:
These levels sit directly in the positive GEX zone, where price often drifts upward in controlled channels.
Safer Play:
195/205 Call Debit Spread
Perfect for GEX-guided upside.
📌 Bearish Options Play (if NVDA breaks 185)
Buy:
NVDA 180P or 175P
Reason:
Once NVDA enters the negative GEX field, volatility expands downward and puts gain value quickly.
Safer Bearish Spread:
185/175 Put Debit Spread
📌 Neutral Play (if price stays stuck 188–196)
This is a premium-decay zone.
Sell Premium Strategy:
* Short Strangle
* Iron Condor
* Credit Spread
Neutral GEX = low volatility = high time decay.
My Thought
NVDA is sitting in one of the cleanest GEX compression structures we’ve seen all month. Price is wedged between a rising liquidity structure and a neutral gamma pocket that’s choking volatility.
This kind of setup usually leads to a single explosive move, not a slow grind.
The roadmap is simple:
* Above 195 → NVDA targets 202–210
* Below 185 → NVDA slides into negative gamma
* Inside 188–196 → chop and premium decay
The next breakout is going to be clean — and GEX is already showing where the path of least resistance lies.
This outlook is for educational purposes only and not financial advice. Always manage your risk and trade your plan.

NVDA Weekly Call Alert — AI Recovery + Institutional Flow🧭 Overview
Ticker: NVDA
Current Price (Entry): $187.50
Trend: Bullish (Analyst + AI recovery)
Expiry: 2025-11-21 (7D)
Strike: $187.50 (ATM, Delta 0.521)
Position Size: 4% of portfolio
📊 AI & Technical Forecast
Katy AI Target: Recovery sequence $185 → $190, timing for momentum reversal
Analyst Price Target: $250
PCR / Flow Intel: 0.33 → bullish institutional positioning
RSI: 80.9 → overbought, expect short-term dip before upward move
VIX: 19.84 → favorable volatility entry before expansion
Insights:
Friday entry captures weekend theta premium
Light weekly volume (0.6x) → monitor for institutional confirmation
Dip to $185.50 may provide optimal entry for maximum upside
🎯 Trade Setup
Parameter Value
Direction CALL
Strike $187.50
Entry $7.50
Target 1 $12.00 (+60%)
Target 2 $15.00 (+100%)
Stop Loss $4.50 (–40%)
Expiry 2025-11-21
Position Size 4% portfolio
Confidence 60%
⚡ Key Advantages
ATM call → balanced risk/reward vs OTM alternatives
Tight stop aligns with AI critical support at $184.44
Institutional bullish flow + AI recovery pattern → asymmetric reward potential
Timing advantage: Monday-Tuesday momentum reversal
🚨 Risk Notes
Low AI confidence (50%) → disciplined sizing required
Overbought RSI → short-term upside may be capped
Rising VIX → daily premium decay risk, consider scaling entry
Avoid holding past Wednesday if Target 1 isn’t reached
Summary
NVDA presents a medium-conviction weekly call leveraging AI recovery trajectory, institutional flow, and analyst support. Ideal for disciplined traders seeking timed momentum entry into a 7-day horizon.
NVDA Pullback or Trend Break? (Nov 10–14)Full Multi-Timeframe Outlook
NVDA just had one of its sharpest weekly pullbacks in months, and this week is all about figuring out whether this drop is simply a reset inside the bigger bullish trend or the start of a deeper correction. I’ll walk through each timeframe so traders can understand the structure clearly.
1. Weekly Timeframe (1W)
Macro Structure
NVDA finally tapped the top of the long-term rising wedge and rejected aggressively. Even with the deep weekly red candle, the bigger structure hasn’t broken yet — NVDA is still sitting above the main weekly trendline that carried the entire 2023–2025 bull run.
Weekly demand starts around 153–160. Price hasn’t reached that level yet, but the rejection candle shows sellers finally stepping in with size.
Weekly MACD is rolling over for the first time since mid-summer. Stoch RSI is turning down from overbought. Both suggest momentum is cooling on the larger timeframe.
Weekly Trade View
Watch how NVDA reacts around the trendline near 184–188. As long as NVDA stays above 153–160, the larger trend remains bullish, but a break below 184 adds pressure.
Weekly GEX Perspective
Below 180, negative GEX expands heavily, which tends to increase volatility on the downside.
Above 200, positive GEX slows the upside.
This places NVDA in the middle of a high-energy zone — whichever way it breaks next will likely extend for days.
2. Daily Timeframe (1D)
Daily Trend and Structure
The daily chart is where the weakness is more visible. We already printed a downside CHoCH, confirming a short-term trend shift. NVDA has also broken its rising channel from September, which means sellers took control temporarily.
Key daily support sits at 176–184. That’s a demand cluster plus the midpoint of the previous impulse. The daily candle you posted shows NVDA sitting right on this zone.
Daily MACD crossed bearish and continues to widen. Stoch RSI is oversold but hasn’t curled yet — usually a sign that a bounce needs more time to develop.
Daily Trade View
Hold 184 → NVDA can bounce back toward 195 then 202.
Break 176 → opens a deeper retracement toward 164 and even 153.
Daily GEX View
There is a major put wall around 178–180.
This level often acts like a gravitational pull, especially in pullbacks.
The next put concentration is near 164.
Unless NVDA reclaims 190–195 quickly, the daily structure still favors a retest of these lower zones.
3. 1-Hour Timeframe (1H)
Short-Term Structure
You can see NVDA has been sliding down the descending intraday channel for days. The most recent BOS is bearish, but the latest CHoCH shows buyers finally trying to step in around 178.
Price is now approaching the 190 resistance — this is the intraday pivot for the week.
1H MACD is curling upward, showing the first momentum shift since early November. Stoch RSI is rising fast, confirming short-term buyers entering.
1H Trade View
Above 190 → opens room toward 195 then 202.
Reject 190 → NVDA likely rolls back toward 184 then 178.
The 190 break is the whole game for intraday momentum.
4. 15-Minute Timeframe (15M)
Intraday View
The 15M shows the cleanest structure:
A strong BOS just formed, and NVDA broke the intraday trendline. This is the first real bullish sign since the selloff started.
However, the CHoCH that printed after the BOS is sitting right underneath the 188–190 ceiling. That means the sellers still sit overhead waiting.
MACD on 15M is trending strongly upward — momentum is on the bulls’ side right now.
15M Trade View
Break and hold above 188–190 → intraday long toward 195.
Reject 188–190 → expect a fade back toward 184.
This level aligns across all lower timeframes, which makes it extremely important for Monday and Tuesday.
5. GEX Map & Options Strategy
GEX Interpretation for NVDA (This Week)
The GEX chart shows:
Positive GEX at 195–205
Negative GEX at 178–180
A major put wall at 178.91
A major call wall at 202–205
What this means:
Under 180 → volatility expands downward as dealers hedge.
Over 195 → upside will feel slower and grindy, not explosive.
202–205 → heavy call wall likely to act as a ceiling unless NVDA has strong momentum.
Options Strategy
If NVDA rejects 188–190:
Short-dated puts targeting 180 or 178 make sense.
If NVDA reclaims 190 and holds:
Short-dated calls targeting 195 or 202 are the better play.
Avoid chasing anything above 205 — that’s deep inside positive GEX and tends to stall.
My Thought
NVDA is in a very interesting spot going into the week. Higher timeframes are still bullish, but the daily and intraday charts clearly show the momentum shift to the downside. Everything comes down to how price reacts between 188 and 190.
Rejecting that zone keeps the pullback alive toward 184–178.
Breaking above that zone starts the recovery toward 195–202.
This is a week where levels matter more than bias. The reaction at 188–190 will decide which side controls NVDA next.
Disclaimer
This analysis is for educational purposes only and not financial advice. Always trade your own plan and manage your risk. If you want a breakdown on another ticker, just drop it in the comments.


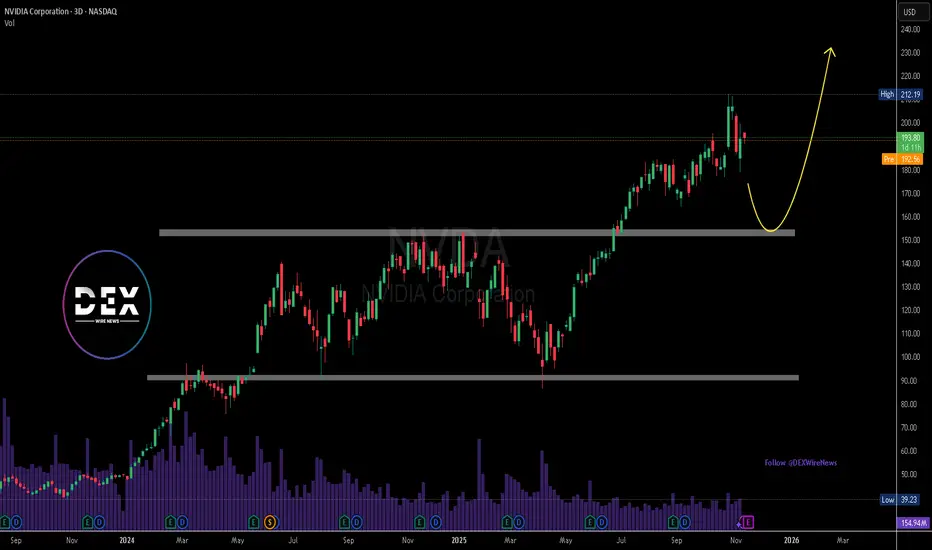
Nvidia Denies $1B Mexico Plan, Eyes Key SupportNvidia Corporation (NASDAQ: NASDAQ:NVDA ) came under brief scrutiny on Wednesday after reports suggested a $1 billion investment in a new data center project in Nuevo León, Mexico. The tech giant has since denied any financial involvement, clarifying that its role in Latin America remains limited to collaborative initiatives, research, and talent development, not direct infrastructure spending.
The confusion began when the state’s governor, Samuel García, publicly announced the investment alongside individuals presented as Nvidia representatives. However, later corrections confirmed that the green hydrogen data center would actually be built by CIPRE Holding, utilizing Nvidia’s technology rather than capital.
Despite the miscommunication, the news had little fundamental impact on Nvidia’s long-term growth narrative. The company remains the dominant force in AI semiconductors, with global demand for GPUs powering everything from data centers to generative AI models. However, short-term volatility persists amid global tech supply pressures, tighter U.S.–China chip export controls, and broader market repricing ahead of potential U.S. interest rate cuts in December.
From a technical perspective, NVDA recently hit resistance near the $212 high before retracing. The chart suggests potential for a healthy correction toward the $155 support range, which coincides with a strong accumulation zone from mid-2025. A rebound from this level could fuel a continuation toward $230–$240, resuming Nvidia’s dominant uptrend.
Investors remain focused on upcoming quarterly earnings and the broader market’s reaction to monetary easing expectations. A confirmed rate cut could renew institutional appetite for high-growth tech names, keeping Nvidia positioned as one of the most favored equities in the AI sector.