Pfizer (PFE): Undervalued Pharma Giant Amid #Economy Resilience?Pfizer (PFE): Undervalued Pharma Giant Amid #Economy Resilience? $28.90 in Sight? 📈
At $24.04 (+0.04%), PFE offers a compelling entry with its low P/E of 12.72 and robust 7.15% dividend yield, trading well below analyst targets of $28.90 (20% upside potential)—could resilient economic forecasts boost healthcare demand and spark a rally? 🚀
**Fundamental Analysis**
Pfizer boasts EPS (TTM) of $1.89 and revenue (TTM) of $63.83B, with a PEG ratio of 0.96 signaling undervaluation relative to growth prospects; DCF models suggest intrinsic value above current levels given strong cash flows of $16.02B, though patent expirations weigh on margins.
- **Positive:** High dividend yield supports income-focused portfolios; diversified pipeline in oncology and vaccines drives long-term revenue stability.
- **Negative:** Elevated enterprise value/EBITDA at 9.15 reflects debt from acquisitions; regulatory hurdles could delay new approvals.
**SWOT Analysis**
**Strengths:** Broad product portfolio and global reach; strong R&D investment.
**Weaknesses:** High debt levels post-acquisitions; dependency on blockbuster drugs.
**Opportunities:** Expanding into emerging markets amid economic growth; AI-driven drug discovery partnerships.
**Threats:** Generic competition; geopolitical tensions impacting supply chains.
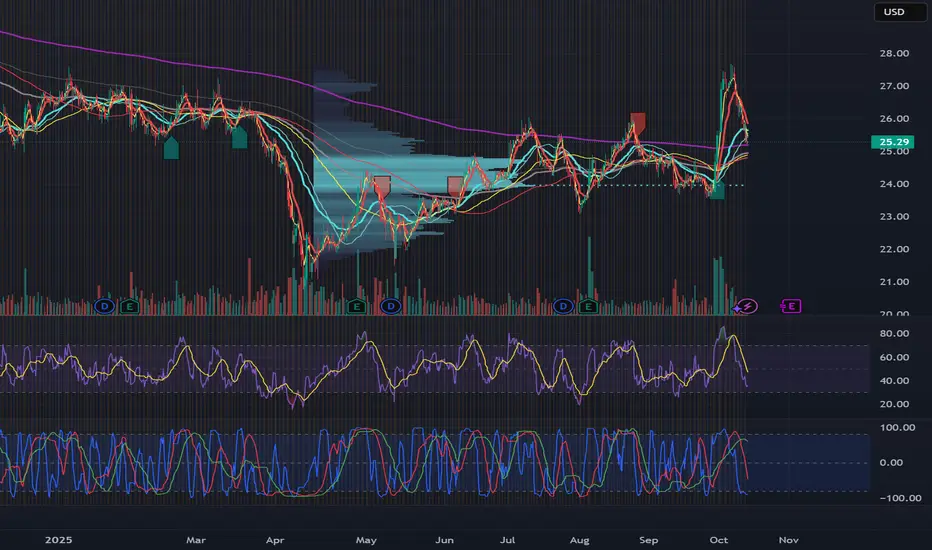
**Technical Analysis**
Chart shows consolidation in a tight range with emerging bullish momentum. Price: $24.04, VWAP $24.10.
Key indicators:
- RSI: 45 (neutral, room for upside without overbought risk).
- MACD: Positive crossover signaling building momentum.
- Moving Averages: 50-day at $25 (potential breakout level), 200-day at $26 (long-term trendline).
Support/Resistance: Support at $23, resistance at $25. Patterns/Momentum: Ascending triangle forming, favoring bulls on volume increase. 📈 Bullish | ⚠️ Bearish.
**Scenarios and Risk Management**
- **Bullish:** Entry above $25 on volume, DCA in dips to average down for 20% upside to targets.
- **Bearish:** Drop below $23 on weak earnings, exit positions.
- **Neutral:** Sideways trade between support/resistance amid macro waits.
Risk Tips: Set stops at 5% below entry, limit position to 2-3% of portfolio, diversify across sectors, and apply DCA to mitigate volatility. ⚠️
**Conclusion/Outlook**
Bullish bias if economic resilience sustains healthcare spend. Watch Fed remarks. Fits value theme with #Economy upside. Take? Comment!
PFE trade ideas

Pfizer and Pharma Stocks Rise After Trump DecisionPfizer Inc. (PFE) and Other Pharmaceutical Stocks Rise Following Trump’s Decision
According to media reports, US President Donald Trump launched a website allowing Americans to purchase medicines directly. He announced that Pfizer would offer some of its drugs on this platform and introduce new medicines to the US market at reduced prices. Trump added that his administration is working with other companies, including Eli Lilly, to reach “similar agreements.”
Reports state that Pfizer’s deal with the Trump administration will enable patients to receive significant discounts. In return, the company will receive a three-year exemption from any tariffs.
The news pushed pharmaceutical stocks to the top of yesterday’s gainers list:
→ Pfizer Inc. (PFE) rose by 6.8%
→ Merck & Co Inc. (MRK) rose by 6.8%
→ Eli Lilly and Co. (LLY) rose by 5.0%
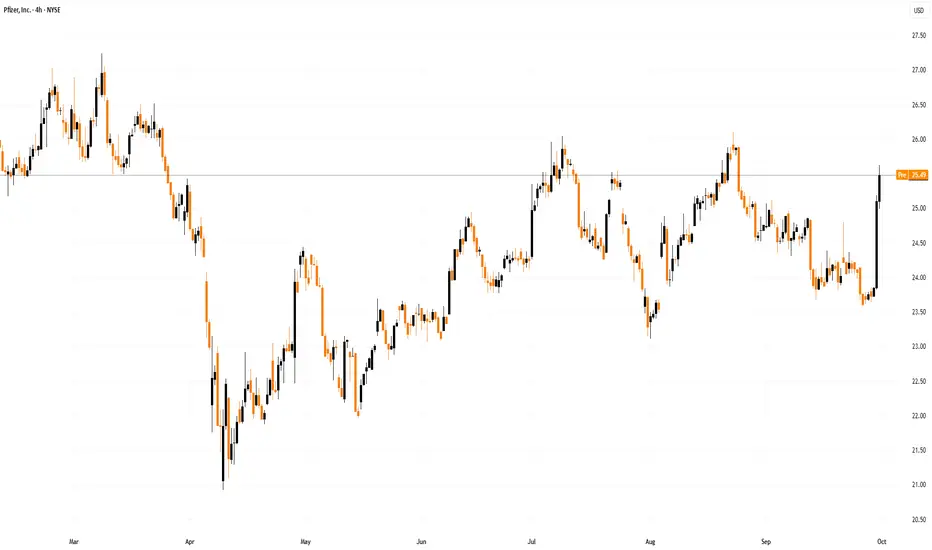
Technical analysis of the PFE chart
The chart indicates that:
→ In the long term, PFE’s share price remains in a bearish trend, highlighted by the descending orange channel.
→ However, in April the stock reached its lowest level in nearly 13 years, after which the price began showing an upward trajectory, forming higher highs and higher lows within the ascending blue channel.
A strong fundamental driver yesterday caused PFE’s share price to rebound sharply from the lower boundary of the blue channel towards its median, encountering little resistance when breaking through the September local barrier at $24.75.
It is possible that positive market sentiment will persist and be leveraged by bulls to extend the rally. However, the real test of their resolve might come at resistance near the summer highs around $26.00.
A more substantial obstacle might lie in the $27–27.50 area, where multiple resistances converge, including:
→ the upper boundaries of both the blue and orange channels;
→ key highs from the first half of 2025.
Nonetheless, assuming the fundamental backdrop continues to be supported by positive news on progress in cancer treatments (Pfizer is conducting large-scale developments in this area, aided by its acquisition of Seagen, a pioneer in antibody-drug conjugates, or ADCs), this could lead to an attempt to break the long-term downward trend as early as this year.
This article represents the opinion of the Companies operating under the FXOpen brand only. It is not to be construed as an offer, solicitation, or recommendation with respect to products and services provided by the Companies operating under the FXOpen brand, nor is it to be considered financial advice.
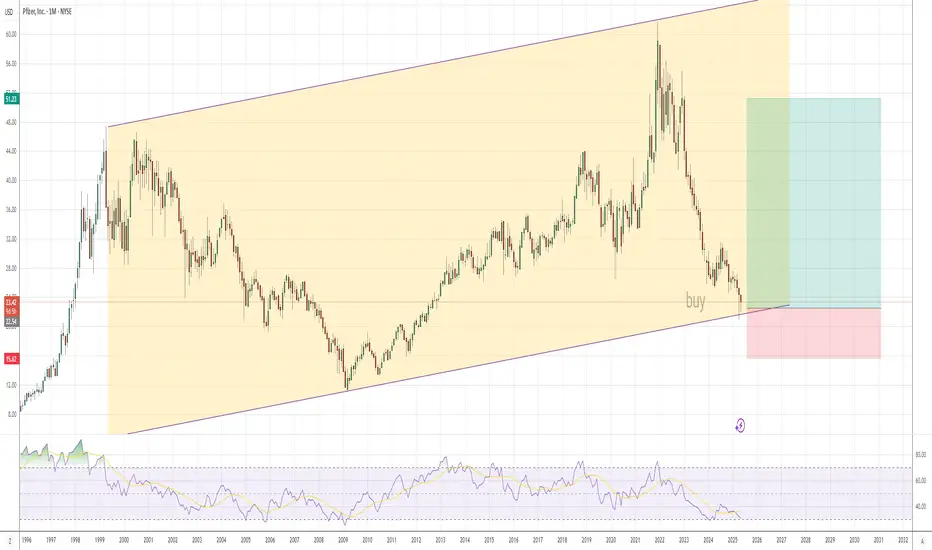
Pfizer medium term outlook.This giant might not make you rich, but its in my opinion a safe bet for 2025>2026.
I have personally opened a long position due to my analysis.
Check my old bitcoin predictions from 4 years ago and you will see my eye is strong for longer term moves.
Make your own analysis and decision, this is just my personal approach.
Take care and trade safe.

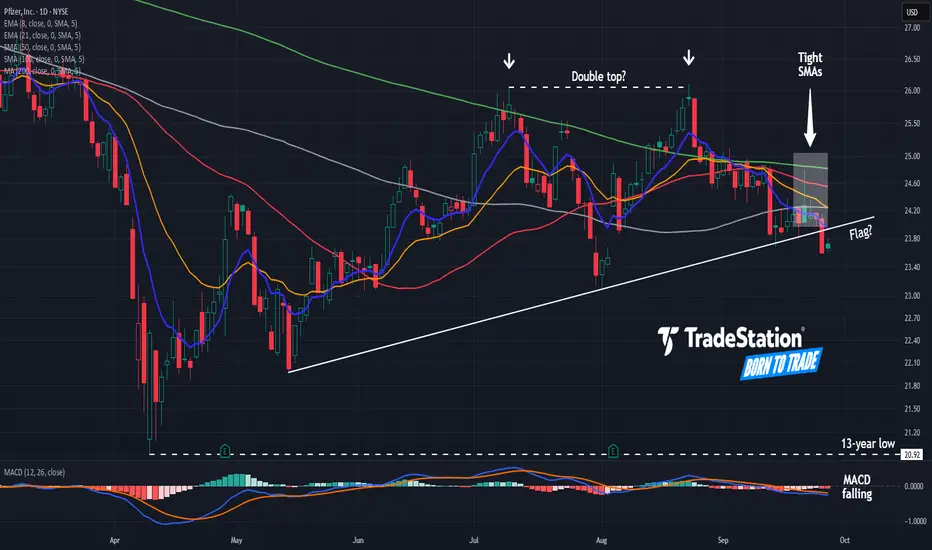
Pfizer: Long-Term Downtrend Still in Effect?Pfizer has spent almost two years consolidating after a major slide. Now some traders may see the long-term downtrend reasserting itself.
The first pattern on today’s chart is the pair of highs in July and August just above $26, which could be viewed as a double-top reversal pattern.
Second, the drugmaker made a series of higher lows since May. It closed yesterday under that trendline: a potential bear-flag breakdown.
Third, the 50-, 100- and 200-day simple moving averages are close to each other. That illustrates the long period of consolidation, which may open the door to renewed movement.
Fourth, MACD is falling and the 8-day exponential moving average (EMA) is below the 21-day EMA. Those signals could suggest that bears are taking control in the short-term.
Next, technicians may see odds favoring a retest of April’s low under $21.
Finally, PFE is an active underlier in the options market. (It trades more than 100,000 contracts per session, according to TradeStation data.) That could help traders take positions with calls and puts.
TradeStation has, for decades, advanced the trading industry, providing access to stocks, options and futures. If you're born to trade, we could be for you. See our Overview for more.
Past performance, whether actual or indicated by historical tests of strategies, is no guarantee of future performance or success. There is a possibility that you may sustain a loss equal to or greater than your entire investment regardless of which asset class you trade (equities, options or futures); therefore, you should not invest or risk money that you cannot afford to lose. Online trading is not suitable for all investors. View the document titled Characteristics and Risks of Standardized Options at www.TradeStation.com . Before trading any asset class, customers must read the relevant risk disclosure statements on www.TradeStation.com . System access and trade placement and execution may be delayed or fail due to market volatility and volume, quote delays, system and software errors, Internet traffic, outages and other factors.
Securities and futures trading is offered to self-directed customers by TradeStation Securities, Inc., a broker-dealer registered with the Securities and Exchange Commission and a futures commission merchant licensed with the Commodity Futures Trading Commission). TradeStation Securities is a member of the Financial Industry Regulatory Authority, the National Futures Association, and a number of exchanges.
Options trading is not suitable for all investors. Your TradeStation Securities’ account application to trade options will be considered and approved or disapproved based on all relevant factors, including your trading experience. See www.TradeStation.com . Visit www.TradeStation.com for full details on the costs and fees associated with options.
Margin trading involves risks, and it is important that you fully understand those risks before trading on margin. The Margin Disclosure Statement outlines many of those risks, including that you can lose more funds than you deposit in your margin account; your brokerage firm can force the sale of securities in your account; your brokerage firm can sell your securities without contacting you; and you are not entitled to an extension of time on a margin call. Review the Margin Disclosure Statement at www.TradeStation.com .
TradeStation Securities, Inc. and TradeStation Technologies, Inc. are each wholly owned subsidiaries of TradeStation Group, Inc., both operating, and providing products and services, under the TradeStation brand and trademark. When applying for, or purchasing, accounts, subscriptions, products and services, it is important that you know which company you will be dealing with. Visit www.TradeStation.com for further important information explaining what this means.
PFE: Bears Trapped at Multi-Year Lows - Spring Ready to Uncoil📍 **To see my confluences and/or linework:**
Step 1: Grab chart 📊
Step 2: Unhide Group 1 in object tree 🎯
Step 3: Hide and unhide specific confluences one by one ✨
Step 4: Double-click the screen to show RSI, MFI, CVD, and OBV indicators alongside divergence markings 📈
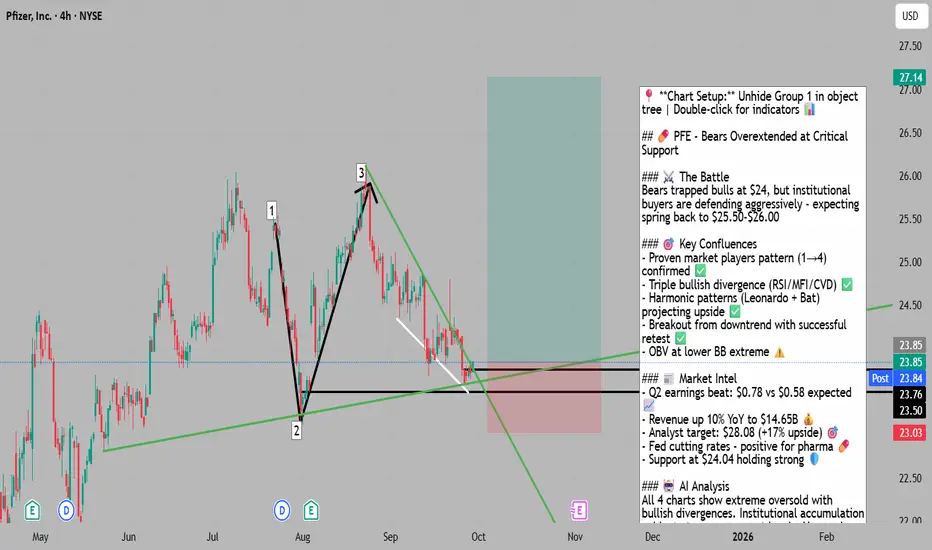
Title: 💊 PFE: Bears Trapped at Multi-Year Lows - Spring Ready to Uncoil
The Market Participant Battle:
Bears have systematically beaten bulls into submission at the $24 level, creating a compression zone where institutional buyers are quietly accumulating positions. The repeated tests at this proven support level (points 2 and 4 on the chart) demonstrate that smart money is defending this zone aggressively. With RSI and MFI showing bullish divergence while price makes lower lows, the bears have overextended their hand. Price is expected to spring back toward the $25.50-$26.00 resistance zone as trapped shorts cover and sidelined bulls rush back in.
Confluences:
Confluence 1: Proven Market Players Pattern (Points 1-4)
The chart reveals a sophisticated accumulation pattern where point 3 closing above point 1 confirms point 2 as a proven market player zone. Point 4's return to this level, combined with bullish divergences across multiple indicators, suggests institutional defenders have established a floor. The pattern indicates smart money has been systematically absorbing selling pressure at these levels, setting up for a powerful reversal.
Confluence 2: Multiple Bullish Divergences
While price created a lower low at point 4, RSI, MFI, and CVD all printed higher lows - a triple divergence rarely seen at market bottoms. The RSI has entered oversold territory below 30, while MFI shows accumulation despite price weakness. This divergence cluster signals exhausted selling pressure and hidden institutional buying beneath the surface.
Confluence 3: Statistical Extremes & Harmonic Patterns
Price has dropped below the 1st standard deviation and bounced, showing potential institutional entries. The presence of two harmonic patterns (Leonardo and Bat) both projecting upside targets adds geometric confluence to the reversal thesis. The OBV touching the lower Bollinger Band at point 4 indicates selling volume extremes typically associated with reversals.
Confluence 4: Breakout from Strong Downtrend
The successful breakout from the descending channel, followed by a backtest that holds above the breakout level, represents a classic trend reversal setup. The 5th standard deviation reaction using the major trend provides a statistical edge for mean reversion traders.
Web Research Findings:
- Technical Analysis: PFE holds support from accumulated volume at $24.04 with potential for an upward reaction when this support is tested . Current price sits precisely at this critical level.
- Recent Earnings: Q2 2025 earnings showed revenue of $14.65 billion, up 10% year-over-year, with adjusted EPS of $0.78 beating expectations of $0.58
- Analyst Sentiment: Of 15 analysts covering Pfizer, the stock receives a consensus "Hold" rating with a one-year price target of $28.08, representing 14.19% upside potential
- Data Releases & Economic Calendar: Next earnings report scheduled for November 4, 2025, with potential catalyst for movement
- Interest Rate Impact: The Fed cut rates by 25 basis points to 4.0-4.25%, with lower rates generally supporting pharmaceutical stocks through reduced borrowing costs and improved valuations
Layman's Summary:
Pfizer's stock is sitting at a crucial support level that has held multiple times before. The company is making more money than expected, beating earnings estimates significantly. While analysts are cautiously optimistic with price targets around $28 (about 17% higher than current levels), the technical setup suggests the stock is oversold and due for a bounce. Recent Fed rate cuts should help pharmaceutical companies like Pfizer by making it cheaper to borrow money for research and operations. The combination of strong support, oversold indicators, and improving fundamentals creates a favorable risk/reward setup for a potential bounce trade.
Machine Derived Information:
- Image 1: 4-hour chart showing channel patterns with numbered pivot points - Significance: Confirms the participant battle narrative with clear support/resistance zones - AGREES ✔
- Image 2: Clean V-bottom pattern from point 2 to 3 - Significance: Demonstrates powerful reversal capability from these levels - AGREES ✔
- Image 3: Multiple indicator divergences (RSI, MFI, CVD, OBV) - Significance: Extreme oversold conditions with bullish divergences signal imminent reversal - AGREES ✔
- Image 4: Leonardo and Bat harmonic patterns with trend analysis - Significance: Multiple geometric patterns converging at current levels project upside targets - AGREES ✔
Actionable Machine Summary:
All four charts unanimously support the bullish reversal thesis. The proven market player pattern, combined with extreme oversold readings and multiple bullish divergences, creates a high-probability bounce setup. The harmonic patterns provide clear upside targets around $25.50-$26.00, offering a favorable 1:2 risk/reward ratio with stops below $23.50. The technical evidence strongly suggests bears have exhausted their ammunition at these levels.
Conclusion:
Trade Prediction: SUCCESS
Confidence: High
The convergence of proven support levels, multiple bullish divergences, harmonic patterns, and improving fundamentals creates a compelling long setup. With RSI oversold, institutional accumulation patterns evident, and analyst targets 17% higher, the risk/reward heavily favors the bulls. Key catalyst: Any positive news or market strength should trigger short covering and propel price toward $25.50-$26.00 initial targets.
Back test before continuationNYSE:PFE after breaking out on trump deal and now working with him to sell their products through TrumpRx launching next year. They are also exempt from tariffs for 3 years and plan to invest 60B in the US. good support/resistance flip could take place here would like to hold 25 but 24 is possible. Next stop $30 could take a while. They've gotten hammered past 4 years the momentum up will be strong. I did well with ATM calls last run up will probably do it again month or two out.
Pfizer: Bearish Setup Points to Further Downside Risk Current Price: $23.76
Direction: SHORT
Targets:
- T1 = $22.50
- T2 = $21.50
Stop Levels:
- S1 = $24.50
- S2 = $25.30
**Wisdom of Professional Traders:**
This analysis synthesizes insights from thousands of professional traders and market experts who have been following Pfizer’s recent struggles. Combining the collective intelligence of skilled professionals helps pinpoint high-probability trade setups that align with developing market sentiment. Currently, the consensus among traders suggests that Pfizer could continue facing downside pressure due to deteriorating fundamentals and bearish technical indicators.
**Key Insights:**
Pfizer has encountered significant revenue headwinds in 2025, primarily stemming from the expiration of patents on key drugs and muted vaccine demand. Reduced fulfillment for COVID-related products has weighed heavily on the company's earnings potential, leading to revised guidance for the fiscal year. Additionally, increasing competition in the immunology and oncology spaces further pressures Pfizer's growth story as it strives to pivot toward pipeline development and innovation for long-term recovery.
From a technical perspective, Pfizer's stock remains bearish after failing to hold a support level above $25 earlier this month. The stock’s Relative Strength Index (RSI) lands below 40, suggesting persistent oversold conditions, while volume data confirms the dominance of sellers. With its 50- and 200-day moving averages trending downward, a continued bearish trend appears probable ahead of Pfizer’s next earnings release in Q4. Traders report resistance near $25.50, a level the stock is struggling to reclaim, setting the stage for further declines.
**Recent Performance:**
Pfizer’s stock has dropped substantially over the last quarter, declining roughly 16% from its 2025 peak of $28. The healthcare sector as a whole has been underperforming, with Pfizer particularly impacted due to broader market rotations favoring cyclical stocks amidst elevated interest rates. The stock’s downward trajectory reflects clear institutional selling, particularly in high-volume days driving prices lower. This sustained weakness positions the stock deep below critical moving average levels—a bearish signal for technical traders.
**Expert Analysis:**
Market analysts have downgraded expectations for Pfizer’s year-end financial results. Rising R&D expenses alongside declining margins are seen as major obstacles for the company, even as it doubles down on its strategic initiatives like mRNA vaccine development and oncology advancements. Technical professionals highlight that the break below $25 signals bearish momentum, with lower highs and consistent failures to reverse selling pressure confirming short-term downside risk. Traders also note a bearish MACD crossover, reinforcing negative sentiment and suggesting further weakness.
**News Impact:**
Pfizer’s recent restructuring plans and ongoing cost-cutting measures have dominated headlines but failed to instill confidence among investors. The company faces growing skepticism regarding its ability to sustain long-term growth in core areas like immunology. Additionally, disappointing data on COVID-19 vaccine-related revenue has underscored challenges in adapting to waning pandemic-related demand. These developments are fostering bearish sentiment and keeping downward pressure on the stock.
**Trading Recommendation:**
Pfizer’s sustained weakness presents a compelling short opportunity for traders looking to capture downside potential. The break below key support levels, coupled with bearish technical signals and disappointing fundamentals, suggests the stock could revisit targets in the $22-$21 range. Initiating a short position at current levels could deliver a favorable risk-reward setup, particularly with stop-loss levels firmly placed above $24.50 and $25.30 to mitigate potential reversals. Short sellers can leverage this momentum to capitalize on further downside risks.
Do you want to save hours every week? Register for the free weekly update in your language!

PFE - in buy zone area - LONG !Hi, PFE seems to be very overslod right now. Its in buy zone. Of course it might fall more but when it happens im buying more and more. I belive this is golden opportunity right now. In 5 years it can grow at least 100%. Regards.

Pfizer’s Next Big Shot: COVID Levels Back on the Table?Huge Crisis or Groundbreaking Discovery?
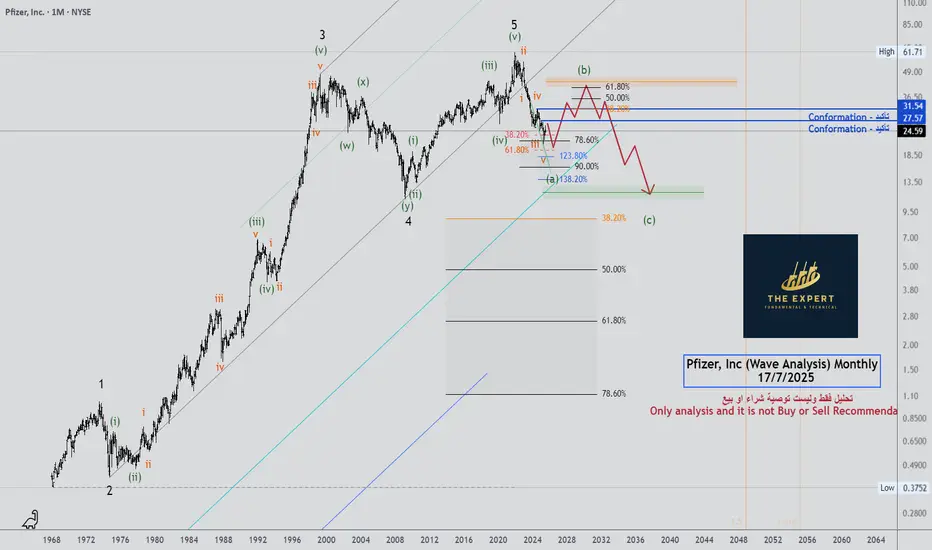
This scenario suggests that once the running flat correction is completed — which we are very close to — the price is set to explode by at least 300% in the coming years (see red box).
Why do I think so?
• The running correction is approaching its final target zone, meaning the price should soon stop, reverse, and start pumping.
• After the correction phase comes the impulse, and we are expecting Wave 3 — the most volatile and dynamic wave of all.
• Minimum target: $108
It’s only a matter of sooner or later.

Buy the panic ?Sentiment is terrible in the vaccine sector right now which could make for a good buying opportunity. I've shown you 2 potential wave counts as to how things can play out.

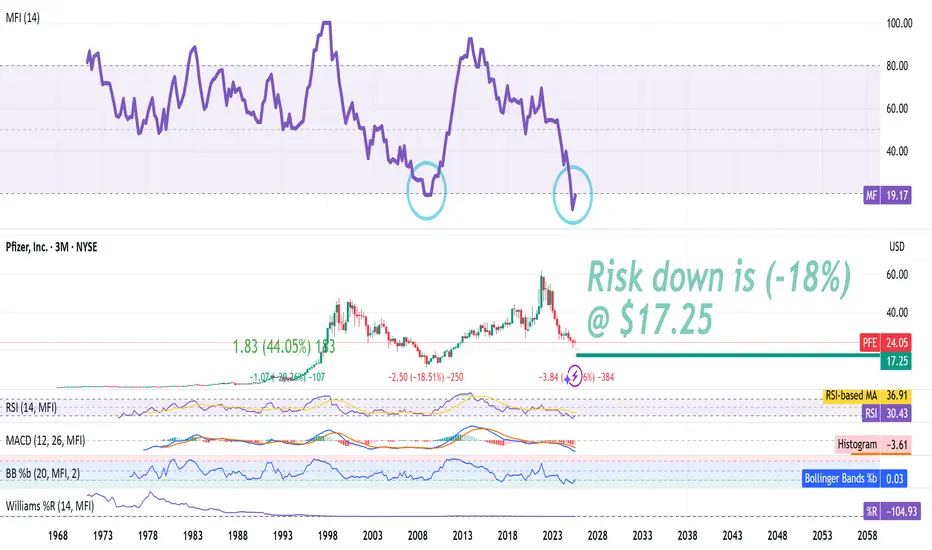
PFE is forming a trough no questions asked! 3Ms is so oversold !Using only the Money flow index is dangerous game do your own analysis!...
The Money Flow Index (MFI) is a technical indicator that uses price and volume to identify overbought or oversold conditions in a security, similar to the Relative Strength Index (RSI) but incorporating volume data. It's a momentum oscillator ranging from 0 to 100, with readings above 80 often suggesting an overbought market (potential sell signal) and readings below 20 indicating an oversold market (potential buy signal). Traders use the MFI to confirm price trends, identify divergences (warnings of trend reversals), and gauge investor conviction behind price moves
PfizerPfizer short is currently up i have 21st Nov (23$) put
Will be looking for a TP around the resistance and SL is a just below recent high

Pfizer's Weekly Supply Rejection Points to Possible TriggerPfizer Inc. recently retested a significant weekly supply zone, experiencing a rejection that suggests the market may revisit this level again. This retest could serve as a setup for a potential decline toward the daily demand area. Additionally, seasonal analysis indicates that the stock may continue its bearish trend, supporting the possibility of further downside movement. Traders should monitor these technical levels and seasonal signals for potential trading opportunities aligned with the ongoing bearish outlook.
✅ Please share your thoughts about PFE in the comments section below and HIT LIKE if you appreciate my analysis. Don't forget to FOLLOW ME; you will help us a lot with this small contribution.

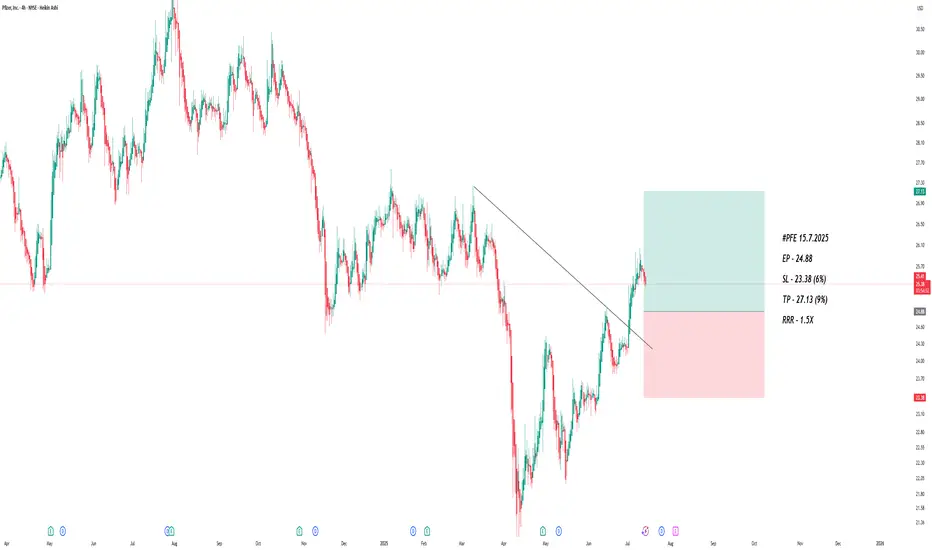
Pfizer stocks Buy Trade with Take Profit - Stocks SPOT ACCOUNTStocks SPOT ACCOUNT:
NYSE:PFE stocks my buy trade with take profit.
This is my SPOT Accounts for Stocks Portfolio.
Trade shows my Buying and Take Profit Level.
Spot account doesn't need SL because its stocks buying account.

Pfizer, Inc (Wave Analysis) Monthly - Update 17/7/2025Pfizer, Inc (Wave Analysis) Monthly - Update 17/7/202
See the chart
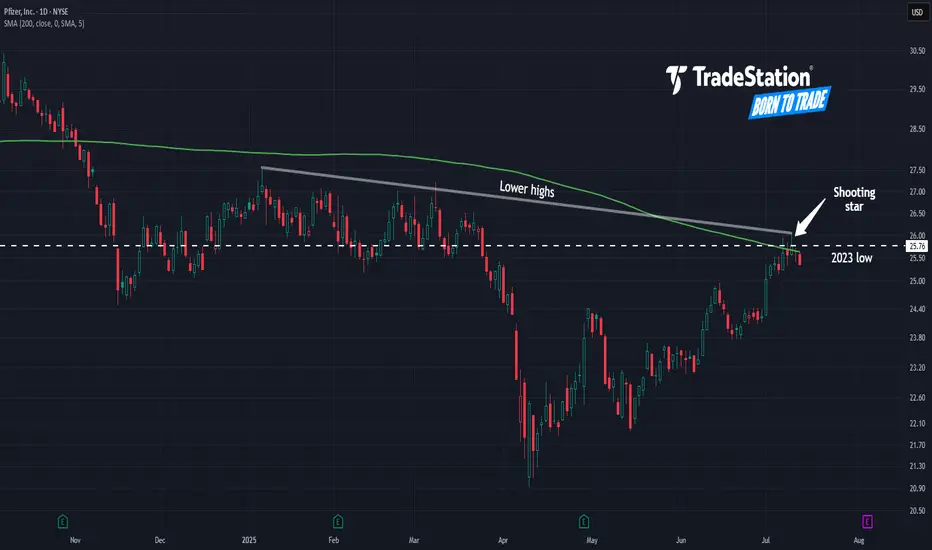
Pfizer May Be StallingPfizer has limped higher since April, but some traders may think the pharmaceutical giant is at risk of stalling.
The first pattern on today’s chart is the series of lower highs since January. PFE potentially just made another lower high at this falling trendline, which may suggest resistance is taking effect.
Second, the peak is occurring near the 200-day simple moving average. That could indicate its long-term trend is pointing lower.
Third is the 2023 low of $25.76. At the time, it was the lowest price in the preceding decade. After spending more than a year on either side of this level, PFE is now stalling in the same area. Has old support finally turned into new resistance?
Fourth, the candles of July 8 and July 10 showed prices trying and failing to cross the same long-term level. Such “shooting star” candlesticks may be short-term reversal patterns.
Finally, PFE is an active underlier in the options market. (It’s averaged more than 90,000 contracts per session in the last month, according to TradeStation data.) That might help traders take positions with calls and puts.
TradeStation has, for decades, advanced the trading industry, providing access to stocks, options and futures. If you're born to trade, we could be for you. See our Overview for more.
Past performance, whether actual or indicated by historical tests of strategies, is no guarantee of future performance or success. There is a possibility that you may sustain a loss equal to or greater than your entire investment regardless of which asset class you trade (equities, options or futures); therefore, you should not invest or risk money that you cannot afford to lose. Online trading is not suitable for all investors. View the document titled Characteristics and Risks of Standardized Options at www.TradeStation.com . Before trading any asset class, customers must read the relevant risk disclosure statements on www.TradeStation.com . System access and trade placement and execution may be delayed or fail due to market volatility and volume, quote delays, system and software errors, Internet traffic, outages and other factors.
Securities and futures trading is offered to self-directed customers by TradeStation Securities, Inc., a broker-dealer registered with the Securities and Exchange Commission and a futures commission merchant licensed with the Commodity Futures Trading Commission). TradeStation Securities is a member of the Financial Industry Regulatory Authority, the National Futures Association, and a number of exchanges.
Options trading is not suitable for all investors. Your TradeStation Securities’ account application to trade options will be considered and approved or disapproved based on all relevant factors, including your trading experience. See www.TradeStation.com . Visit www.TradeStation.com for full details on the costs and fees associated with options.
Margin trading involves risks, and it is important that you fully understand those risks before trading on margin. The Margin Disclosure Statement outlines many of those risks, including that you can lose more funds than you deposit in your margin account; your brokerage firm can force the sale of securities in your account; your brokerage firm can sell your securities without contacting you; and you are not entitled to an extension of time on a margin call. Review the Margin Disclosure Statement at www.TradeStation.com .
TradeStation Securities, Inc. and TradeStation Technologies, Inc. are each wholly owned subsidiaries of TradeStation Group, Inc., both operating, and providing products and services, under the TradeStation brand and trademark. When applying for, or purchasing, accounts, subscriptions, products and services, it is important that you know which company you will be dealing with. Visit www.TradeStation.com for further important information explaining what this means.
Attempting a breakout The price is attempting a breakout of the blue resistance.
Daily 200-period SMA is also located at $25.10.
It’s important to watch today’s closing price, if the breakout is confirmed, the next target will be the light blue resistance at $26.60

PFIZER INC. (NYSE)For all vaccine enthusiasts, Pfizer shares are currently among the best options.
At the time of publication, the price is holding steady at $24.83 . Our forecast is that the price will rise to $27.48 (minimum)! Most likely by August.
Personally, I don't trade stocks, as I have decided to change my market preference, but I can say that if I were Warren Buffett , I would recommend buying it.
✅ The price is low.
✅ The brand is well-known.
✅ Pharmaceuticals is a profitable sector of the economy, on par with IT and other new technologies.

Aggressive Trend Trade 1HAggressive Trend Trade 1H
- short trend
+ volumed T1
+ support level
+ biggest volume 2Sp+
Daily Trend
+ long impulse
+ T2 level
+ support level
+ 1/2 correction"
Monthly CounterTrend
"- short balance
+ expanding ICE
+ support level
+ unsuccessful biggest volume manipulation"
Yearly Trend
"+ long impulse
+ 1/2 correction
- below exhaustion volume?
- below SOS"
Will add more when 5M, 1H or 1D will show entry point

PFIZER is taking Viagrathe stock price of Pfizer is about to overdose on viagra. Looking at the bounce from the downfall due to corona virus there is solid support from previous wave 4. With the news of Vaccines, Pfizer is promising to produce one. I am looking at a target price of $45.00

BUY Pfizer (PFE) growth by Viagra
Tomorrow, I’m entering a position in Pfizer Inc. (NYSE: PFE)—a globally recognized pharmaceutical giant with strong fundamentals and an attractive technical setup.
Pfizer maintains a solid revenue base, reporting $62.46 billion in total revenue in the last fiscal year. Despite recent fluctuations, its profitability remains intact, with a gross profit of $45.15 billion. The company continues to invest in drug innovation and strategic acquisitions, ensuring long-term growth.
Pfizer is a consistent dividend payer, making it an attractive choice for income-focused investors. Its dividend yield remains competitive, reinforcing its appeal as a long-term hold.
I see strong upside potential — both technically and fundamentally. Now is the perfect time to enter.