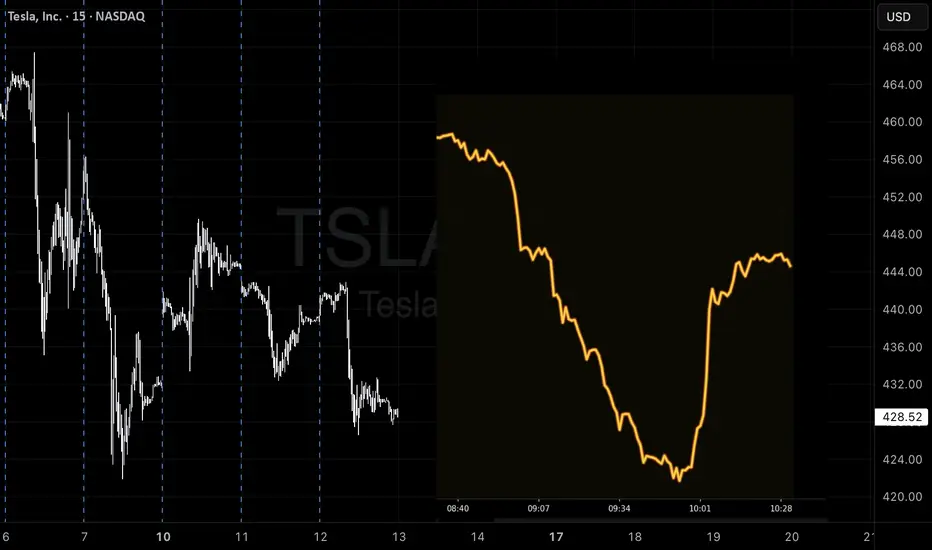
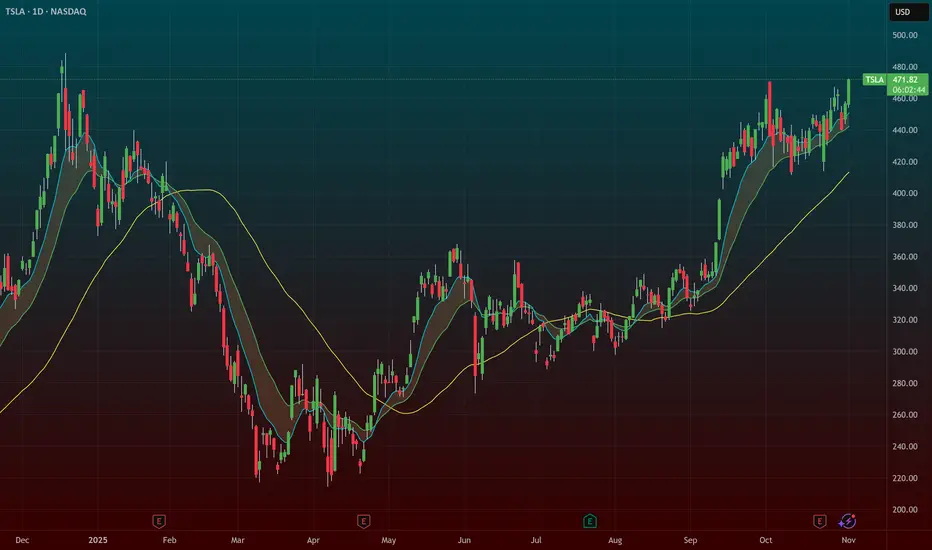
Tesla – Demand Reclaim After Liquidity SweepTesla swept liquidity below 440 and reacted strongly from a clean demand zone.
The bearish leg completed a full imbalance fill, and price is now rejecting that discount area.
As long as price stays above 440, I’m expecting continuation toward 470–474 (previous supply zone).
If 436 breaks, the bullish idea becomes invalid and deeper reaccumulation may follow.
#TSLA #SmartMoneyConcepts #LiquiditySweep #FVG #PriceAction #ICT #Stocks
Trade ideas

Tesla: Potential Breakout Coming?Tesla has consolidated for more than two months, and some traders may think a breakout is coming.
The first pattern on today’s chart is the $436.23 level, a previous record weekly close from December. The EV maker has fluctuated on either side of that price since late September without backing down. Is long-term resistance fading?
Second, TSLA has made higher highs and mostly higher lows since October 10. (The only exception came on October 23 following quarterly results. Even then, prices quickly recovered from the opening drop.)
Third, the 8-day exponential moving average (EMA) has stayed above the 21-day EMA. That may reflect a bullish short-term trend.
Next, Wilder’s Relative Strength Index (RSI) has moderated from above 80 while staying over 50. That may suggest an overbought condition has faded without direction turning south.
Finally, TSLA is an active underlier in the options market. (Its average volume of 2.3 million contracts per session ranks second in the S&P 500, according to TradeStation data.) That could help traders take positions with calls and puts.
TradeStation has, for decades, advanced the trading industry, providing access to stocks, options and futures. If you're born to trade, we could be for you. See our Overview for more.
Past performance, whether actual or indicated by historical tests of strategies, is no guarantee of future performance or success. There is a possibility that you may sustain a loss equal to or greater than your entire investment regardless of which asset class you trade (equities, options or futures); therefore, you should not invest or risk money that you cannot afford to lose. Online trading is not suitable for all investors. View the document titled Characteristics and Risks of Standardized Options at www.TradeStation.com . Before trading any asset class, customers must read the relevant risk disclosure statements on www.TradeStation.com . System access and trade placement and execution may be delayed or fail due to market volatility and volume, quote delays, system and software errors, Internet traffic, outages and other factors.
Securities and futures trading is offered to self-directed customers by TradeStation Securities, Inc., a broker-dealer registered with the Securities and Exchange Commission and a futures commission merchant licensed with the Commodity Futures Trading Commission). TradeStation Securities is a member of the Financial Industry Regulatory Authority, the National Futures Association, and a number of exchanges.
Options trading is not suitable for all investors. Your TradeStation Securities’ account application to trade options will be considered and approved or disapproved based on all relevant factors, including your trading experience. See www.TradeStation.com . Visit www.TradeStation.com for full details on the costs and fees associated with options.
Margin trading involves risks, and it is important that you fully understand those risks before trading on margin. The Margin Disclosure Statement outlines many of those risks, including that you can lose more funds than you deposit in your margin account; your brokerage firm can force the sale of securities in your account; your brokerage firm can sell your securities without contacting you; and you are not entitled to an extension of time on a margin call. Review the Margin Disclosure Statement at www.TradeStation.com .
TradeStation Securities, Inc. and TradeStation Technologies, Inc. are each wholly owned subsidiaries of TradeStation Group, Inc., both operating, and providing products and services, under the TradeStation brand and trademark. When applying for, or purchasing, accounts, subscriptions, products and services, it is important that you know which company you will be dealing with. Visit www.TradeStation.com for further important information explaining what this means.

TSLA 1M AI Prediction📊 TSLA 1M AI Prediction – 2025-11-12
Current Price: $442.35
Trend: Neutral
Confidence: 55%
Volatility: 14.7%
Trade Signal:
Direction: Short
Entry Price: $442.35
Target: $440.50 (-0.52%)
Stop Loss: $448.99
Expected Move: -0.52%
30min Target: $440.31 (-0.46%)
Insight:
Katy AI predicts a small downward move in the short term
Low-moderate confidence; trade with proper risk management
Market trend is neutral, so position sizing should remain cautious
$TSLA: in a trading rangeNASDAQ:TSLA seems to be in a trading range to complete wave (4) of 3, and wave 4. Buying at the range low ($420-$430) and selling $450, $460 call options is my TSLA strategy for now for short term shares. I also have uncovered long term shares.

TSLA CCREALLY GOOD premium and volatility here.... wow. Pay package means
Buy low, sell high. It's at a high spot right now.

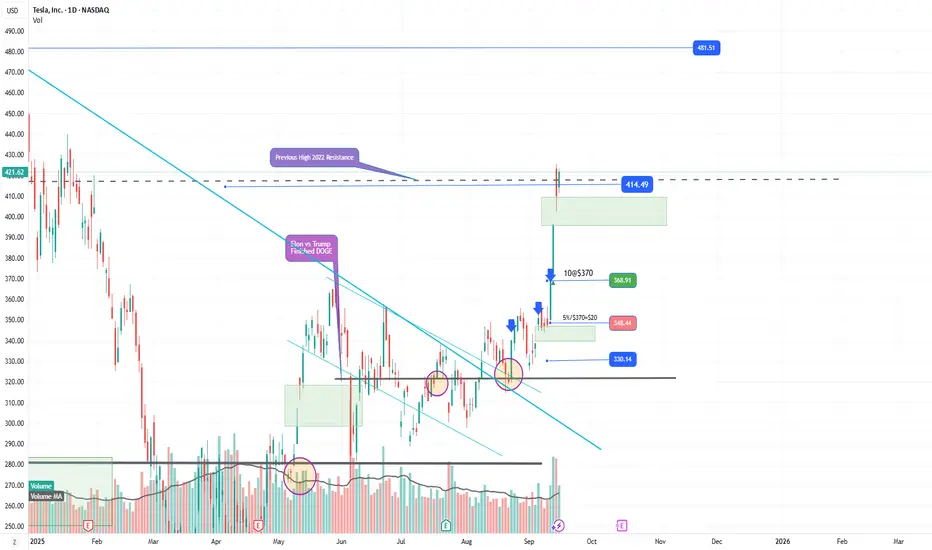
#TSLA Analysis, Elon breaks the Key level ^.^^Elon pours Big Money $$$ into TSLA stock recently causing Rally!
Price has gone up significantly, I don't think it will drop below $400 any time soon.
Strong Greenbar breaks out from the wedge with large volume increases.
Short sellers are getting squeeze out.
More investors are coming to catch smokey train.
Price Target next $480.
Come and join the Rally.
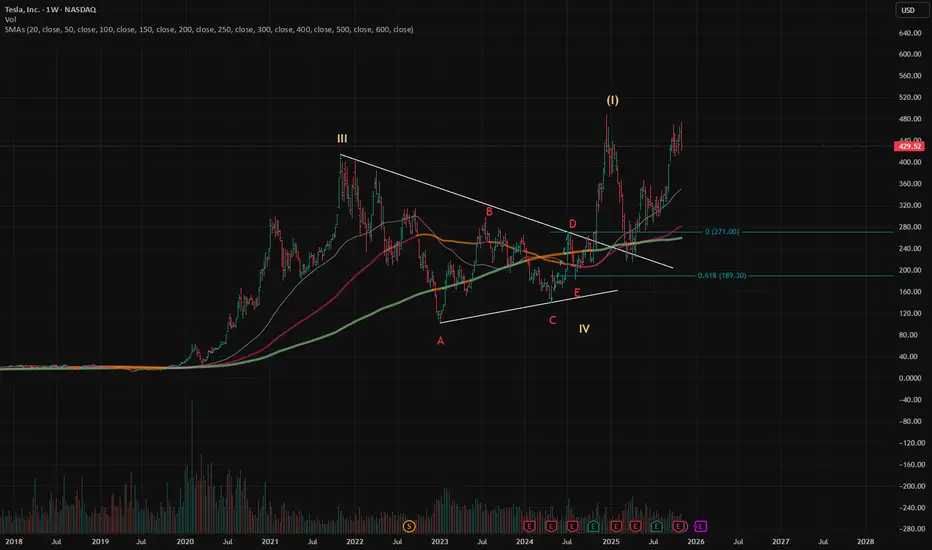
$TSLA: Weekly BullishNASDAQ:TSLA Weekly: I consider TSLA to have completed Wave III. Triangles are more likely to appear in Wave IV. We are in an extending Wave V.
Wave (I) of V has completed. Wave (II) appears to be a very sharp zigzag.
Tsla weekly chartI think it's time to sell tsla
We got a bad signal down trend candlestick & down trend RSI
GOOD LUCK 4ALL

Tesla / Palantir Fractal STILL playing out STRANGELY ACCURATEMillions of people
...buying Trillions of dollars of assets
...at random times
...on random days
but somehow these 2 assets move together on the x-axis & the y-axis??
Cansomeone explain this to me mathematically?
May the Truth be with you.

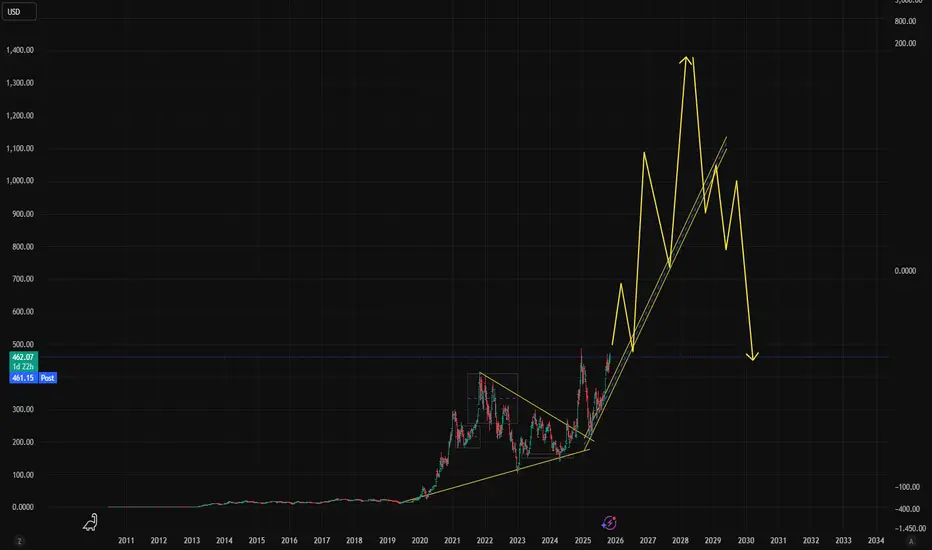
$TSLAHi we are back again with another banger: NASDAQ:TSLA
This is not financial advice but it is very much just key insight.
Here we have NASDAQ:TSLA trading at $462.07 with a potential %, which can bring 100%+ in profits.
Elon musk is doing great things for humanity, and TSLA is going to be a pillar of earths future success. With saying that we know Elon wont let earth of his NASDAQ:TSLA share holders down.
Possible bull market until the end of 2026 which is where we can start to see a break down in trend which would possibly be above $1000+ per share.
Don't forget to use your NASDAQ:TSLA shares to vote today :)
Thank You Elon Musk for everything !!
Don't forget to Comment Like & Share with a friend for good luck, peace out !!
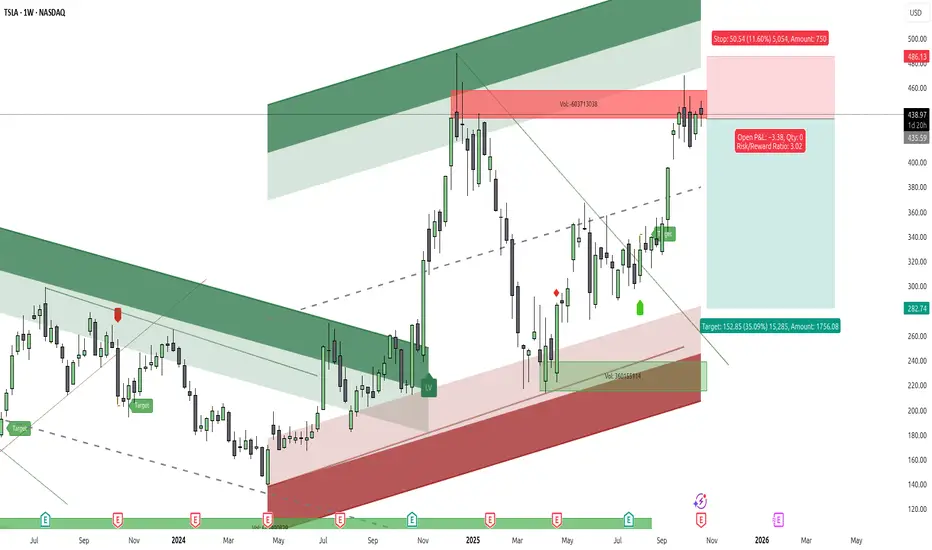
$TSLA: Gravity Reasserts ItselfGreetings, traders.
The NASDAQ:TSLA chart is currently painting a picture of a profound test of market physics. This isn't a "battle"; it's a conflict of impersonal forces.
On one side, we have "Lift"—the powerful, almost unnatural force of a narrative focused on AI, robotics, and a limitless future. This force defies traditional valuation and pushes the price to high altitudes.
On the other, we have "Gravity"—the undeniable, constant pull of fundamental reality, which just made itself known in the Q3 earnings report.
The chart is our laboratory, and we are here to observe these forces at work.
The Technical Landscape
The Macro View: The weekly chart shows the narrative's 'Lift' failing at a critical altitude. The price has been decisively rejected from the " gravitational ceiling " of its multi-year ascending channel (approx. $480-$500). This is a level where the weight of reality has consistently proven too strong. The most recent large, bearish candle is not an attack; it is simply the pull of gravity reasserting its dominance over upward momentum.
The Tactical View: The daily chart shows why this 'Lift' is failing. We saw a classic bearish MACD divergence on the final push to the highs—price floated higher, but the underlying force (momentum) was fading. The MACD has now crossed bearishly, confirming the shift. Price is now coiled in a tight daily wedge, a tactical "decision point" where we will see if 'Lift' can be re-established or if 'Gravity' will take full control.
The Philosophy: A Tale of Two Forces
To understand NASDAQ:TSLA $, you must understand the two opposing forces that define its physics.
The 'Lift' (The Narrative Camp): The bull case is a qualitative vision. It's about Robotaxis, Optimus, and AI. This crowd is rightfully unconcerned with a single quarter's auto margins because, in their view, they are buying a different company—one that exists 10 years in the future. Their conviction is deep and provides a powerful upward force.
The 'Gravity' (The Quantitative Camp): The bear case is a spreadsheet. It's about the "now." The Q3 earnings report is the catalyst for this "counter-force."
EPS Miss ($0.50$ vs $0.53$) Severe margin compression from aggressive price cuts. A fundamentals-based valuation (e.g., Morningstar's $250 FVE) that is miles away from the current price.
This setup is a clear piece of the puzzle.
It shows what happens when the powerful force of 'Lift' (Narrative) reaches its apex and meets the immovable, constant pull of 'Gravity' (Macro Supply + Fundamental Reality). At this specific junction, 'Gravity' is in control.
An Illustrative Setup
We do not predict; we observe and we react.
The confluence of a failing 'Lift' at a 'gravitational ceiling,' combined with the new "weight" of a fundamental catalyst, provides a high-probability, asymmetric setup. This is not about being "right"; it is about defining risk.The chart illustrates a potential short setup based on this confluence:
Entry: ~ $435.00$ (Sell Short)
Stop-Loss: ~ $486.00$
Target: ~$282.00$
Risk-to-Reward Ratio: ~3
The confirmation for this thesis would be a breakdown from the daily wedge (around $430), signaling that 'Gravity' has taken firm hold.The stop-loss at $486$ is the "escape velocity" point. If the price breaks above it, the 'Lift' force has overcome 'Gravity,' the thesis is invalidated, and we step aside.
One cannot argue with the market's physics.
Respect the level; it is your anchor to reality.
Disclaimer: This is not financial advice. It is for educational and informational purposes only. Please conduct your own research and manage your risk accordingly.
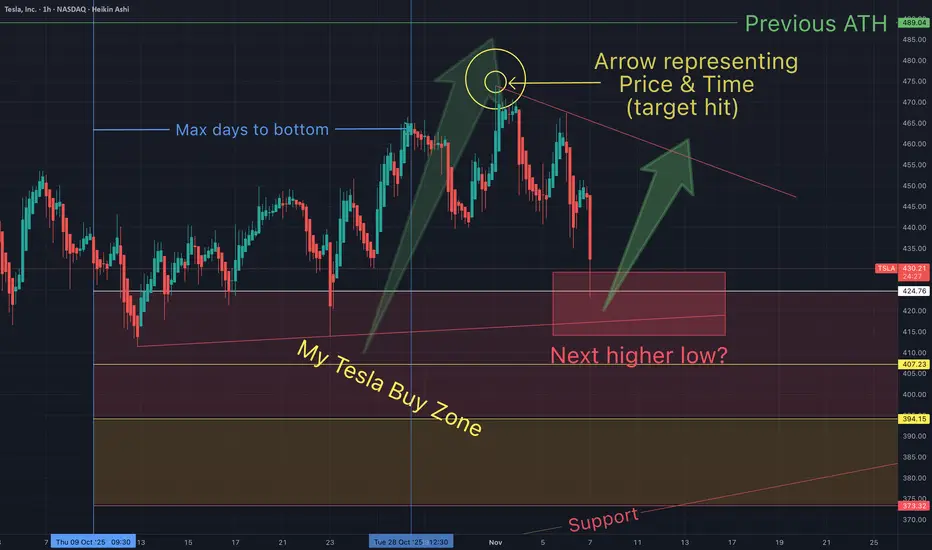
My Last Tesla post before ALL TIME HIGHOn Oct 21st I said I was adding to my positions (price at the time below):
Some of my target hit. We may even go lower.
What do you think?
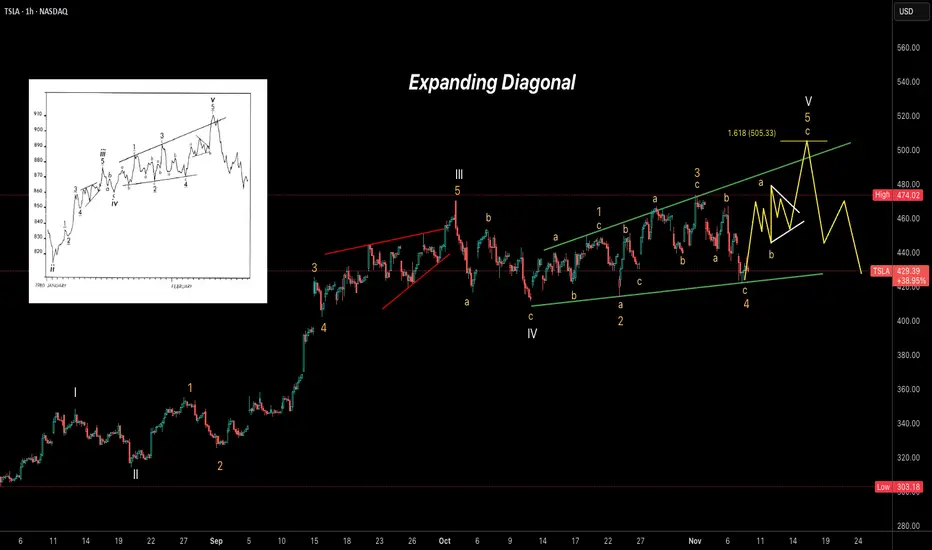
TSLA – Expanding Diagonal in Progress Tesla (TSLA) appears to be forming an Expanding Ending Diagonal pattern on the 1-hour chart, suggesting the final stages of a larger impulsive structure. Wave (V) seems to be unfolding with internal subdivisions visible, possibly targeting the 1.618 Fibonacci extension near 505 before a sharp reversal.
Key observations:
Structure resembles a textbook expanding diagonal (5-3-5-3-5).
Wave 4 found support near the lower trendline.
Wave 5 projection aims toward the 500–505 area.
Expecting a potential pullback or reversal once the diagonal completes.
TSLA 3-Drive & ABCD Pattern – Path to $500 Before a PullbackThis chart highlights multiple harmonic and Elliott structures aligning for a potential bullish extension in Tesla (TSLA). A well-defined ABCD pattern and 3-Drive pattern suggest momentum building toward the $500 zone, supported by Fibonacci projections and channel resistance.
The current wave structure points to an imminent 5-wave advance, likely completing the “Drive 3” and pattern D confluence area near $500–505. Following that move, a corrective pullback (ABC) is anticipated, possibly retesting prior support near $440–400.
Key elements featured:
ABCD completion zone: around $500
3-Drive pattern: confirming exhaustion at upper trendline
Elliott 5-wave projection: short-term bullish continuation
Possible corrective phase: after the final wave up
📈 Watching for confirmation of Wave iii and potential exhaustion signals near $500 before considering downside setups.

TSLA: one more leg down potential NASDAQ:TSLA
Watching for one more leg down into the 430–400 mid-term support zone to potentially complete the corrective structure, if price remains unable to break out above the October/November highs.
Chart:
Alternatively, if price manages to break-out and stay above above recent resistance, odds favor continuation to 555-630 resistance zone.
Chart:
Previously:
• On macro bottoming potential (Jun 6):
tradingview.com
• On support (Sep 19):
• On mid-term support (Oct 7):

Tesla IdeaShort to
430 then
up again
___________________________
summary
Tesla, Inc. continues to make bold promises about autonomous driving, robotaxis, Cybercab, and Optimus robots that remain unfulfilled or face legal and technological barriers.
TSLA's $1.5 trillion valuation is extremely high at a 348X Forward GAAP P/E, making the stock risky if Elon Musk's ambitious vision fails to materialize.
Despite repeated delays, broken promises, and shifting timelines, somehow investor enthusiasm for TSLA persists, driven by Musk's compelling narrative.
TSLA investors should exercise caution and conduct thorough due diligence rather than relying solely on Musk's visionary promises.
I continue to recommend a strong sale or even a long-term short of TSLA stock

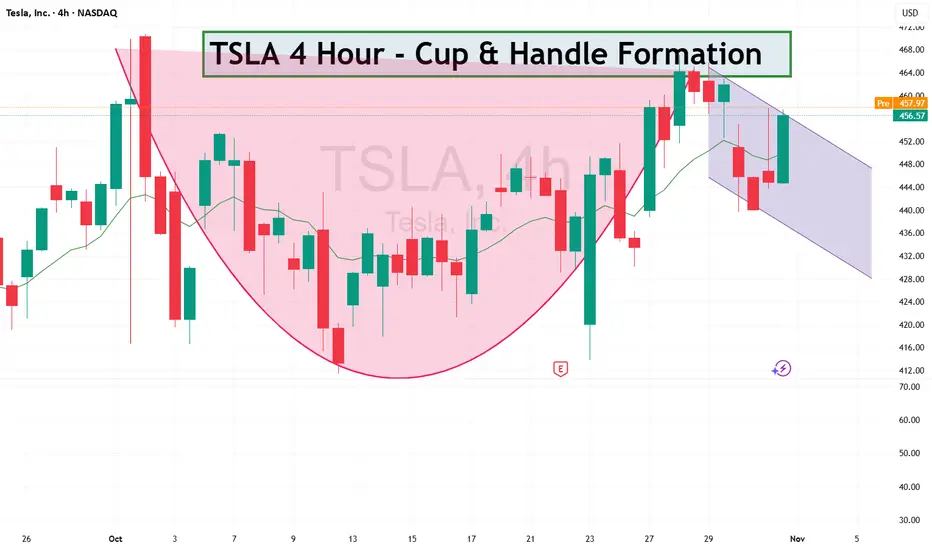
TALS - Cup and Handle FormationTSLA looks quite bullish, as you can see cup and handle formtion on 4 hour.
#TSLA #Tesla #Stocks #Trading #StockMarket #TechnicalAnalysis
TSLA Pitchfork Breach | Neutral RSI, Weak VolumeFollow GoldenZoneFX for more content and valuable insights about financial markets.

Tesla at a Breakout Crossroad
The Tesla (TSLA) daily chart shows a classic Cup & Handle pattern nearing a critical resistance zone. The key level sits around $450, aligning with a long-term descending trendline (in blue).
Technical Overview:
General Trend:
Since early 2025, TSLA has been in a steady uptrend.
The 50-day moving average (SMA 50) near $220 acts as strong dynamic support and is still trending upward.
The structure indicates Tesla is finishing the “handle” phase of the pattern — a decisive moment is approaching.
Bullish Scenario:
If the price breaks and holds above $450 with strong volume, it would confirm the Cup & Handle breakout.
Potential upside targets:
Short-term target: $503
Mid to long-term target: $565 (based on cup depth projection)
Stop loss: Below $410
A breakout above $450 could trigger a strong continuation rally as investors re-enter on technical confirmation.
Bearish Scenario:
Failure to break above $450 and a drop below $410 could invalidate the bullish setup, leading to a deeper correction.
Potential downside targets:
Short-term target: $375
Long-term target: $320
Stop loss: A confirmed close back above $445
This would suggest that the handle failed, and selling pressure could accelerate toward lower supports.
Timeframe Summary:
Short-term (1–3 weeks):
Expect consolidation between $410–$450, with bias toward a breakout if the tech sector remains strong.
Long-term (3–6 months):
A confirmed breakout above $450 opens the path toward $565.
If rejected, expect a correction toward $375, possibly forming a new accumulation base.

$TSLA – Breakout Setup Targeting ATHs → $500 ZoneTesla ( NASDAQ:TSLA ) looks ready for liftoff. After months of absorbing negative headlines and post-earnings volatility, it’s finally setting up for a major breakout that could take it back to all-time highs — and possibly the $500 level.
🔹 The Setup:
NASDAQ:TSLA has shaken off every piece of bad news — earnings, delivery headlines, margin fears — all absorbed without breaking trend.
The stock is now coiling under major resistance, and the tape is showing accumulation.
The narrative has flipped from “EV slowdown” to autonomous driving and robotics, giving the stock new life.
🔹 Why This Setup Has Juice:
It’s the last major leader yet to make a big move — the rotation setup is real.
Market sentiment is improving, and NASDAQ:TSLA is showing relative strength.
Volume expansion here could mark the start of the next major leg higher.
🔹 My Trade Plan:
1️⃣ Position: Added $500 calls (2 weeks out) at the open this morning.
2️⃣ Stop: If the stock goes under $450, I’m out — keeping risk tight.
3️⃣ Targets: First stop at ATHs, then a potential run toward $500 if momentum holds.
Why I Love This Chart:
The structure is perfect — long base, trendline reclaim, sector rotation lining up.
NASDAQ:TSLA has flipped from “bad news reaction” to “no sell reaction,” a clear sentiment shift.
Risk/reward is ideal here with a tight stop and clear upside roadmap.
C&H on TESLABuy and hold, strong move towards 700-800 USD
CUP and HANDLE PATTERN USUALLY HAS HIGHEST PROBABILTY TO BREAK UPSIDE

TeslaI have taken 2 time frames to get confused. 😇 The 15-minute time frame shows a resistance breakout out and the hourly time frame shows a descending channel resistance.
It is always better to take less risky trade entries.
If the price is unable to break the channel's resistance and fall, watch whether the price is showing bullish strength around the 440 to 444 zone. If there is bullish strength, buy above 445 with the stop loss of 440 for the targets 449, 454, 459 and 464.
Always do your analysis before taking any trade.

TSLA shorts may get toastedA rising trendline acting as strong dynamic support from the August lows.
Resistance zone near $470–475 (yellow line, recent double-top area).
Current price at $456, holding above trendline support.
Support floor near $290, far below current levels — indicating we’re in a mid-term uptrend phase, not deep correction.
This pattern fits a rising channel consolidation near resistance — the next move depends on whether the trendline holds.
📈 Bullish Scenario
Setup:
TSLA is holding the ascending trendline while consolidating just below resistance — a classic bullish continuation structure.
Confirmation Triggers:
Break and daily close above $470–475 (clear breakout).
Follow-through volume or a strong gap-up session confirming momentum.
Short-Term Targets:
$490–495 → initial breakout target (projected move from last swing).
$510–520 → extended target if buyers sustain momentum.
Catalysts:
Broader tech strength (QQQ, NASDAQ rally).
Positive EV demand data or production updates.
Institutional accumulation at the breakout level.
Invalidation:
Break and close below $445, violating trendline support.
Probability: ~60% (uptrend intact, momentum favors bulls).
📉 Bearish Scenario
Setup:
If TSLA fails to break $470 again and loses the $445 trendline, momentum could unwind toward prior support.
Confirmation Triggers:
Close below $445 with increased volume.
Failed retest near $450–455 forming lower high.
Short-Term Targets:
$420–425 → first support zone from early October.
$390–400 → deeper correction toward base of last breakout.
Catalysts:
Weak market sentiment or NASDAQ pullback.
Negative headlines on delivery numbers or margins.
Broader EV sector weakness.
Invalidation:
Breakout above $475 with strong follow-through.
Probability: ~40% (depends on strength of support at $445).
⚖️ Neutral / Sideways
If TSLA oscillates between $445–475, expect continued range consolidation along the trendline — typically preceding a directional breakout in 1–2 weeks.
🧩 Summary Table
Bias Confirmation Target Zone Invalidation Notes
Bullish Close > $475 $490 → $520 < $445 Continuation of uptrend
Bearish Close < $445 $425 → $400 > $475 Trendline break
Neutral Range $445–475 — — Coiling near apex
🕒 2–3 Week Projection
Bullish path: Hold $450–455 → breakout above $475 → reach $495–500 by mid-Nov.
Bearish path: Reject $470 → break below $445 → pull back to $420 by late Nov.
