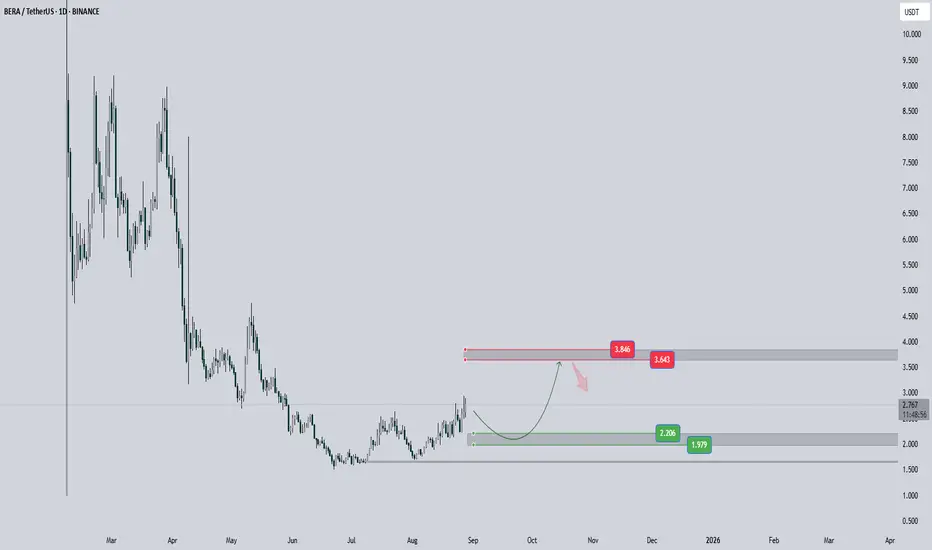
Bera Analysis (12H)From the point where we placed the green arrow on the chart, it seems that a corrective bullish phase has started, which appears to be either a diametric or symmetrical pattern.
Note that we are not looking for a buy/long position on this asset; we will only enter a sell/short position if the price

BERAUSDT Forming Bullish MomentumBERAUSDT is displaying a strong bullish momentum pattern, signaling a potential continuation of its upward trend. The market structure shows clear accumulation at lower levels, followed by a decisive breakout that highlights growing buyer confidence. This kind of price behavior often acts as a precu

BERAUSDT 1D#BERA has bounced off the support zone on the daily chart and is currently facing the daily SMA100. Consider buying some #BERA here and near the support levels of $2.125 and $1.952.
Our targets are:
🎯 $2.656
🎯 $2.987
🎯 $3.317
🎯 $3.788
🎯 $4.388
⚠️ Always remember to use a tight stop-loss and mainta

beraas i consider how pathetic can it be to imagine the outcomes of the situations escalated from the things that we maintained during our lives.

What I'd Like to See from BeraAfter a significant drop in its initial days following the launch and listing, the BINANCE:BERAUSDT has finally recovered, stabilizing at the $1.50 mark. This sharp decline was likely due to the project's free airdrop.
However, we are now seeing a strong performance from Bera, which has grown by
BERALooks like that the long waited return for Bera has come and to me the target is very clear, at the resistance point.
good luck to all who trades it.

BERAUSDT Forming Bullish MomentumBERAUSDT is showing a strong bullish momentum as the price has started recovering from recent lows and is now approaching a key resistance zone. The chart structure indicates growing buyer confidence, with consistent higher lows signaling the possibility of a sustained uptrend. With good trading vol

BERACHAIN Reversal You see this pattern here, the one in blue? This is a classic reversal pattern. Whenever this pattern shows up the market tends to stop producing new lows.
We are looking at BERAUSDT on the daily timeframe, notice the really high volume just two days ago. The high volume came the day EMA55 was bein

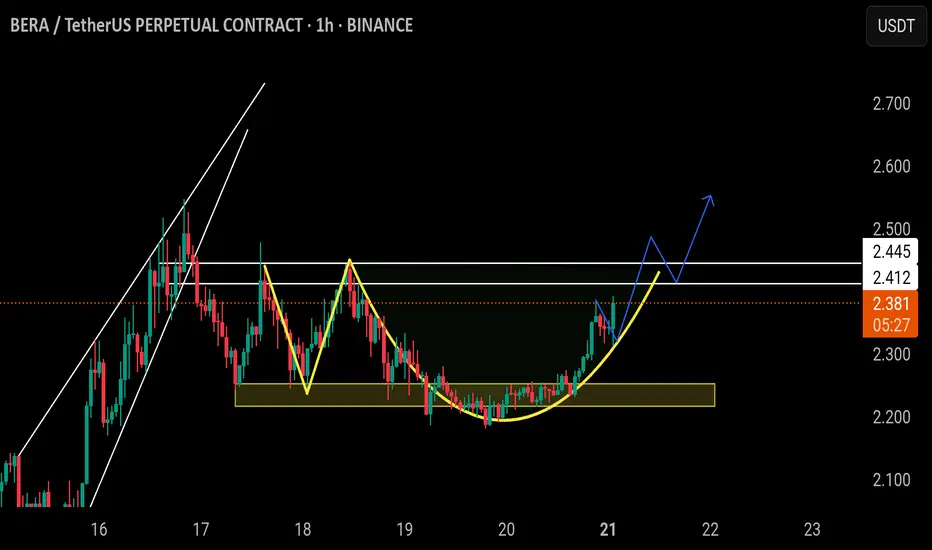
$BERA/USDT | READY TO FLY (ADAM AMD EVE PATTERN)BINANCE:BERAUSDT.P
$Bera/Usdt
The price is forming Adam and even pattern, if the price able the break above the white lines resistance, following a successful retest, the price will go higher and higher.
Aggressive entry at Current market price.
Safe entry after the breakout of white lines res
BERA/USDT +100%
BERA showing strong bullish signs after successfully defending the $1.60 zone twice, which now acts as a key reversal base and potential cycle low. Price structure suggests the downtrend phase is ending, with buyers stepping in aggressively at this level.
If momentum continues, the next bullish le

See all ideas
Summarizing what the indicators are suggesting.
Oscillators
Neutral
SellBuy
Strong sellStrong buy
Strong sellSellNeutralBuyStrong buy
Oscillators
Neutral
SellBuy
Strong sellStrong buy
Strong sellSellNeutralBuyStrong buy
Summary
Neutral
SellBuy
Strong sellStrong buy
Strong sellSellNeutralBuyStrong buy
Summary
Neutral
SellBuy
Strong sellStrong buy
Strong sellSellNeutralBuyStrong buy
Summary
Neutral
SellBuy
Strong sellStrong buy
Strong sellSellNeutralBuyStrong buy
Moving Averages
Neutral
SellBuy
Strong sellStrong buy
Strong sellSellNeutralBuyStrong buy
Moving Averages
Neutral
SellBuy
Strong sellStrong buy
Strong sellSellNeutralBuyStrong buy