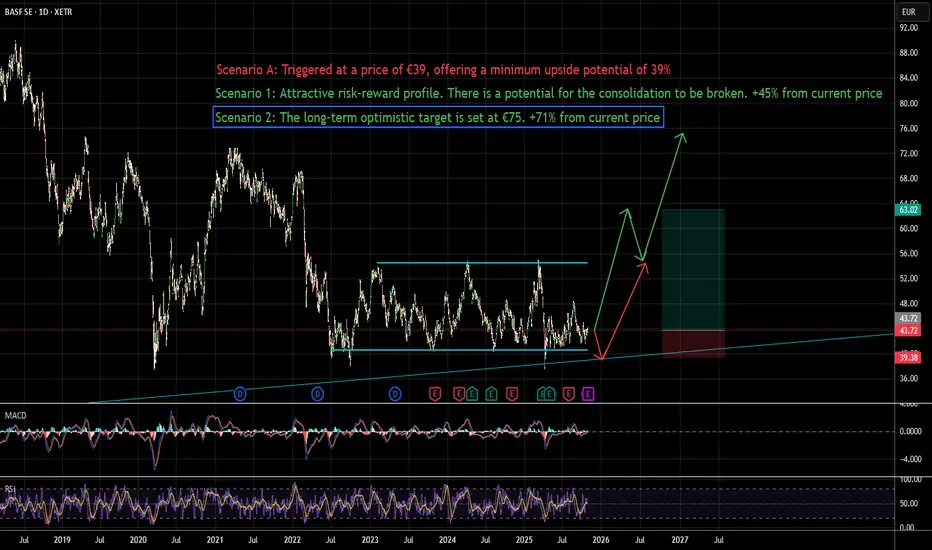
BASF: Attractive risk-reward profileScenario A: Triggered at a price of €39, offering a minimum upside potential of 39%
Scenario 1: Attractive risk-reward profile. There is a potential for the consolidation to be broken. +45% from current price
Scenario 2: The long-term optimistic target is set at €75. +71% from current price
Next report date
—
Report period
—
EPS estimate
—
Revenue estimate
—
120 HUF
538.13 B HUF
27.06 T HUF
893.86 M
About BASF SE
Sector
Industry
CEO
Markus Kamieth
Website
Headquarters
Ludwigshafen am Rhein
Founded
2008
ISIN
DE000BASF111
FIGI
BBG00280DJS0
BASF SE engages in the provision of chemical products. It operates through the following segments: Chemicals, Materials, Industrial Solutions, Surface Technologies, Nutrition and Care, and Agricultural Solutions. The Chemicals segment supplies petrochemicals and intermediates. The Materials segment includes isocyanates and polyamides, as well as inorganic basic products and specialties for the plastics and plastics processing industries. The Industrial Solutions segment develops and markets ingredients and additives for industrial applications, such as polymer dispersions, pigments, resins, electronic materials, antioxidants, and additives. The Surface Technologies segment bundles chemical solutions for surfaces with the catalysts and coating divisions. The Nutrition and Care segment consists of ingredients and solutions for consumer applications in the areas of nutrition, home, and personal care. The Agricultural Solutions segment refers to fungicides, herbicides, insecticides, and biological crop protection products, as well as seeds and seed treatment products. The company was founded on April 6, 1865 and is headquartered in Ludwigshafen am Rhein, Germany.
Related stocks
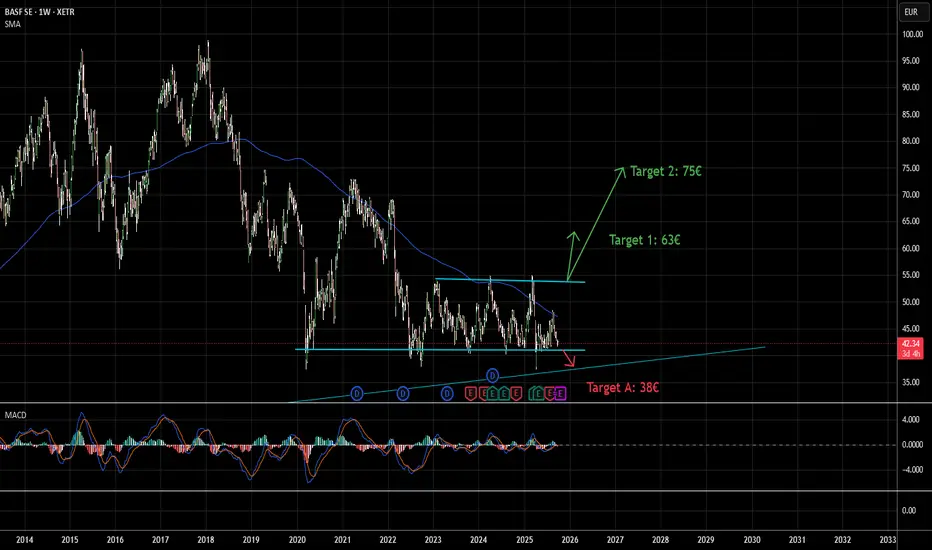
Attractive Risk-Reward Ratio with BASFBASF remains in a consolidation phase, with a potential downside to €38 (−10.2%), where strong trendline support is expected.
This level would likely mark a solid bottom.
On the upside, a breakout could first reach €63 (+48.9%), with a medium-term target of €75 (+77.3%).
The setup offers limited
China Strikes Industrial Plastics SectorChina Imposes Harsh Tariffs on POM Plastics: Which Companies Are Hit the Hardest?
By Ion Jauregui – Analyst at ActivTrades
China has reignited trade tensions by announcing anti-dumping tariffs of up to 74.9% on imports of polyoxymethylene (POM) copolymers—a high-performance plastic widely used in

BAS • BASF SE • XETRA LONG TF H4#BAS • BASF SE • XETRA LONG TF H4,
TP = 46.46 , SL = 40.20
The trend continues, the nearest support level according to my calculations TP = 46.46

BASFY WEEKLY VIEW- SHORTW/D - DOWNTREND , price is making LH's and LL's.
Expecting the price to put a new LL.
There is a bearish OB on daily time frame- I would expect the price to continue it's bearish move from there.
TP's and SL mentioned on the graph!

OverboughtThe market is overbought. Everyone knows it. But anyway the stocks keep rising.
Today, i.e. before weekend I see the chance if not for a trend reversal so for a minor correction at least. Little profit is better than no profit.

BASF - ready to go down1-2 setup is in place. wave 3 of C is upcoming. Expect to see at least a 30-33 range for the wave C down.

not just writing what im not supposed to writemeaningfull blabla and so on and gosh its a very brief description

BASF: Big Time Move!With the last couple of impulses, we can now assume that the following movements will bring the course above the 57.06€-mark. Afterwards, we expect the price to produce more significant downward trends. Falling below 41€, however, would mean that the alternatice scenario, currently equipped with a 4

BASF N (BAS.de) bearish scenario:The technical figure Triangle can be found in the daily chart of the German company BASF SE (BAS.de). BASF SE is a German multinational chemical company and the largest chemical producer in the world. The BASF Group comprises subsidiaries and joint ventures in more than 80 countries and operates six

See all ideas
Summarizing what the indicators are suggesting.
Neutral
SellBuy
Strong sellStrong buy
Strong sellSellNeutralBuyStrong buy
Neutral
SellBuy
Strong sellStrong buy
Strong sellSellNeutralBuyStrong buy
Neutral
SellBuy
Strong sellStrong buy
Strong sellSellNeutralBuyStrong buy
An aggregate view of professional's ratings.
Neutral
SellBuy
Strong sellStrong buy
Strong sellSellNeutralBuyStrong buy
Neutral
SellBuy
Strong sellStrong buy
Strong sellSellNeutralBuyStrong buy
Neutral
SellBuy
Strong sellStrong buy
Strong sellSellNeutralBuyStrong buy
Displays a symbol's price movements over previous years to identify recurring trends.
Frequently Asked Questions
The current price of BASF is 16,855 HUF — it has increased by 3.66% in the past 24 hours. Watch BASF SE stock price performance more closely on the chart.
Depending on the exchange, the stock ticker may vary. For instance, on BET exchange BASF SE stocks are traded under the ticker BASF.
BASF stock has risen by 2.15% compared to the previous week, the month change is a 0.93% rise, over the last year BASF SE has showed a −4.22% decrease.
We've gathered analysts' opinions on BASF SE future price: according to them, BASF price has a max estimate of 23,237.82 HUF and a min estimate of 14,717.29 HUF. Watch BASF chart and read a more detailed BASF SE stock forecast: see what analysts think of BASF SE and suggest that you do with its stocks.
BASF reached its all-time high on Nov 9, 2017 with the price of 30,405 HUF, and its all-time low was 13,000 HUF and was reached on Mar 16, 2020. View more price dynamics on BASF chart.
See other stocks reaching their highest and lowest prices.
See other stocks reaching their highest and lowest prices.
BASF stock is 3.53% volatile and has beta coefficient of 1.43. Track BASF SE stock price on the chart and check out the list of the most volatile stocks — is BASF SE there?
Today BASF SE has the market capitalization of 15.03 T, it has increased by 1.61% over the last week.
Yes, you can track BASF SE financials in yearly and quarterly reports right on TradingView.
BASF SE is going to release the next earnings report on Feb 27, 2026. Keep track of upcoming events with our Earnings Calendar.
BASF earnings for the last quarter are 204.08 HUF per share, whereas the estimation was 117.50 HUF resulting in a 73.68% surprise. The estimated earnings for the next quarter are 84.74 HUF per share. See more details about BASF SE earnings.
BASF SE revenue for the last quarter amounts to 5.98 T HUF, despite the estimated figure of 5.95 T HUF. In the next quarter, revenue is expected to reach 5.73 T HUF.
BASF net income for the last quarter is 67.50 B HUF, while the quarter before that showed 31.75 B HUF of net income which accounts for 112.60% change. Track more BASF SE financial stats to get the full picture.
Yes, BASF dividends are paid annually. The last dividend per share was 914.05 HUF. As of today, Dividend Yield (TTM)% is 5.18%. Tracking BASF SE dividends might help you take more informed decisions.
BASF SE dividend yield was 5.30% in 2024, and payout ratio reached 154.71%. The year before the numbers were 6.97% and 1.35 K% correspondingly. See high-dividend stocks and find more opportunities for your portfolio.
As of Nov 17, 2025, the company has 111.82 K employees. See our rating of the largest employees — is BASF SE on this list?
EBITDA measures a company's operating performance, its growth signifies an improvement in the efficiency of a company. BASF SE EBITDA is 3.28 T HUF, and current EBITDA margin is 11.92%. See more stats in BASF SE financial statements.
Like other stocks, BASF shares are traded on stock exchanges, e.g. Nasdaq, Nyse, Euronext, and the easiest way to buy them is through an online stock broker. To do this, you need to open an account and follow a broker's procedures, then start trading. You can trade BASF SE stock right from TradingView charts — choose your broker and connect to your account.
Investing in stocks requires a comprehensive research: you should carefully study all the available data, e.g. company's financials, related news, and its technical analysis. So BASF SE technincal analysis shows the neutral today, and its 1 week rating is sell. Since market conditions are prone to changes, it's worth looking a bit further into the future — according to the 1 month rating BASF SE stock shows the sell signal. See more of BASF SE technicals for a more comprehensive analysis.
If you're still not sure, try looking for inspiration in our curated watchlists.
If you're still not sure, try looking for inspiration in our curated watchlists.