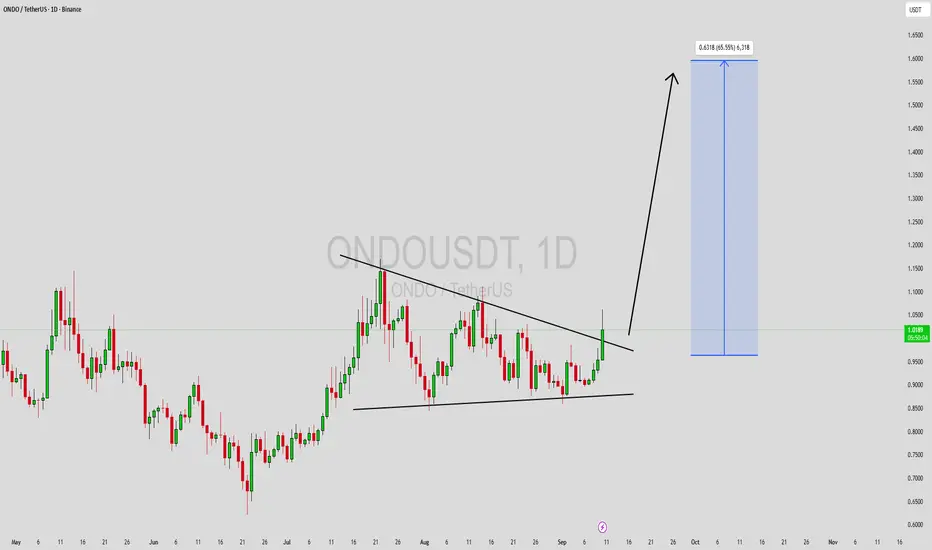
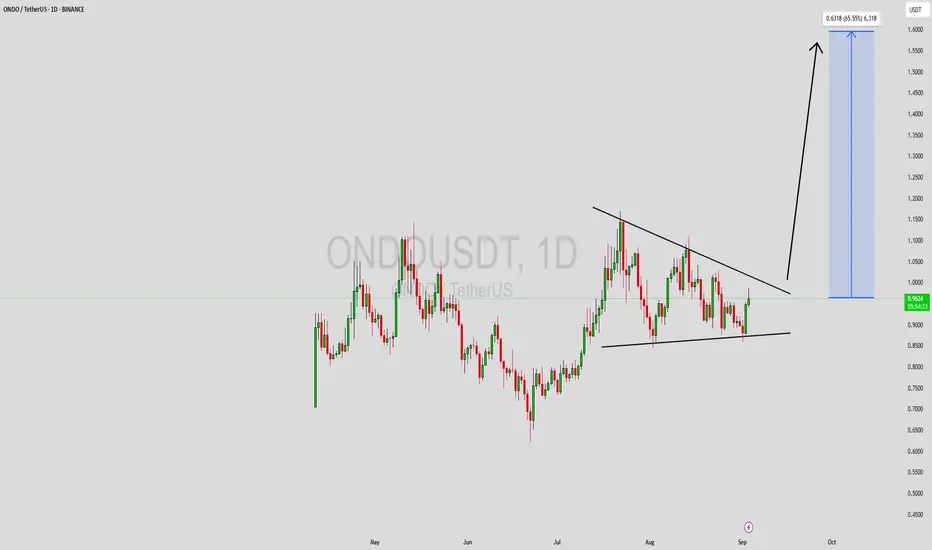
ONDO CAN DO IT AGAIN.. The same study as WLDIt's been a long time since ONDO showed a new increasing trend.
Following the coming hours to see if WLD is able to open a new cycle
Never enter any trend directly, wait for the confirmations, and trade only depending on your setups.
ONDO can do in the coming time a target to up $1.65
WE did b
Related pairs

ONDOUSDT Forming Bullish ContinuationONDOUSDT is currently forming a consolidation structure that signals a potential breakout in the coming sessions. The chart pattern shows price compression within a narrowing range, which often acts as a precursor to a strong directional move. With trading volume holding steady at supportive levels,
ONDOUSDT UPDATE#ONDO
Update
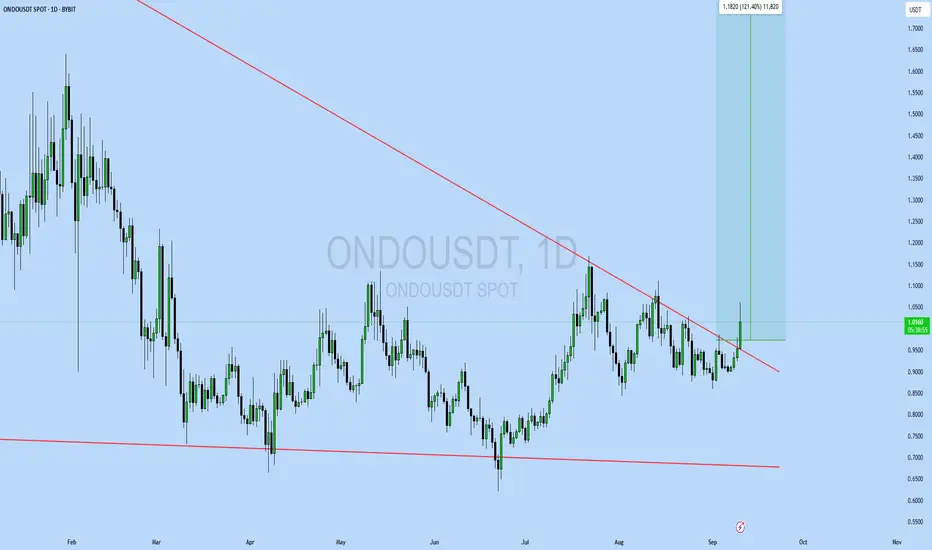
ONDO Technical Setup
Pattern: Falling Wedge Pattern
Current Price: $0.95
Target Price: $2.13
Target % Gain: 121%
Technical Analysis: ONDO is breaking out of a falling wedge on the 1D chart, a bullish reversal setup supported by strong price compression near support. A breakout above
$ONDO - READY TO FLY???CRYPTOCAP:ONDO - 15% up already 💰
You know what's coming?? 🚀
If yes, like & share! 👍

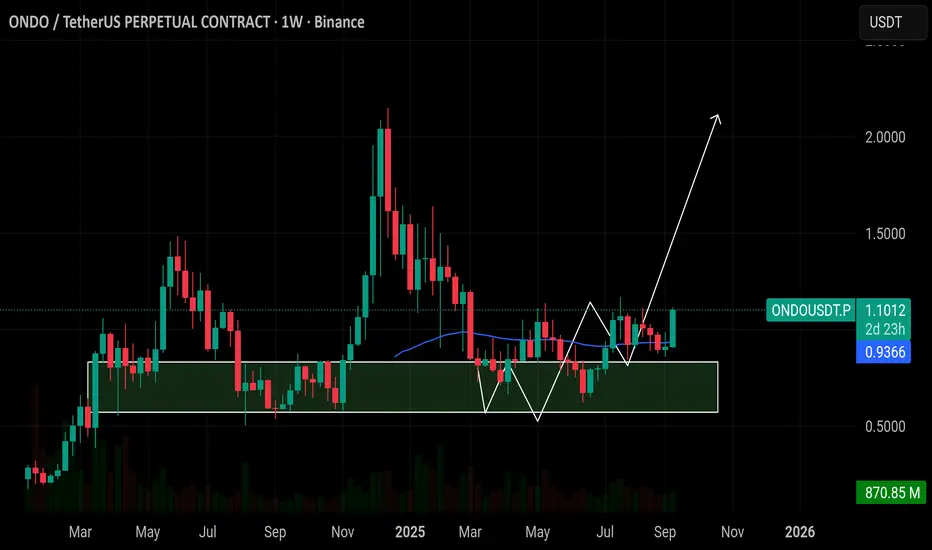
$ONDO: Both Entries Filled — Bullish Wave LoadingCRYPTOCAP:ONDO : Both Entries Filled — Bullish Wave Loading 🚀
Both support entries triggered successfully, and buyers stepped in with conviction. The inverse head & shoulders on the weekly chart is becoming clearer, pointing to a major bullish reversal.
🔸 Support at $0.85 – $0.92
This zone is now
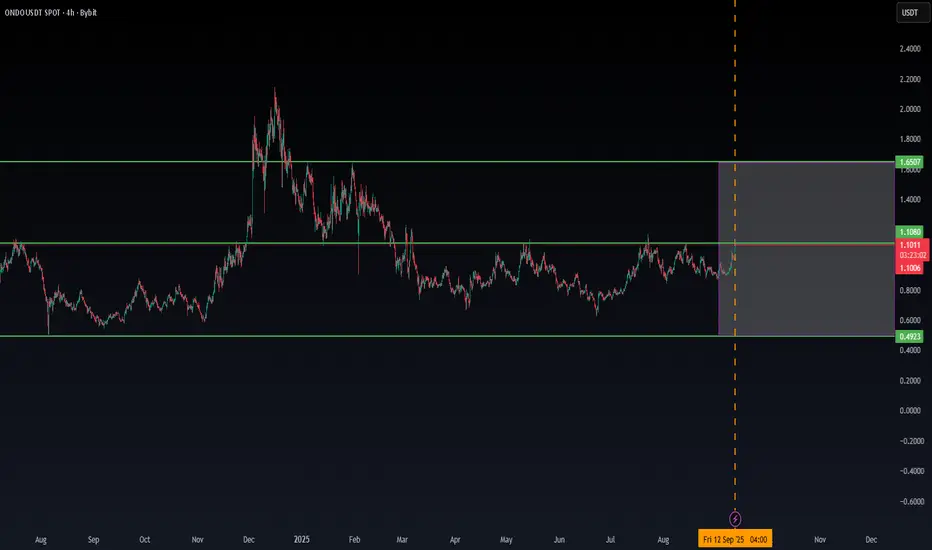
ONDO Retest Setup – Spot Long Opportunity from SupportText (Description):
ONDO has been extremely bullish over the past few days, breaking out of a key resistance zone and showing strong momentum. Now, price is now retesting the breakout level, which could act as support — a classic continuation setup for a spot long entry.
🔹 Entry Zone: $0.98 – $1.00

ONDO/USDT NEW INCREASE VOLUME💎Last data show that ONDO has the chance to break in the coming time on the low time frame.
We will follow up on this reason, ONDO to check for confirmations.
Range Locked, But Bulls are Knocking on the DoorCRYPTOCAP:ONDO has been moving inside a wide sideways range for months, bouncing between support and resistance.
Recently, it broke above the falling resistance line and is now holding around the mid S/R zone.
If buyers keep control here, price could work its way back toward the upper resistance;

ONDOUSDT Forming Bullish ContinuationONDOUSDT is currently forming a consolidation structure that signals a potential breakout in the coming sessions. The chart pattern shows price compression within a narrowing range, which often acts as a precursor to a strong directional move. With trading volume holding steady at supportive levels,
ONDO’s Last Dip Before Liftoff? Don’t Miss This Entry!Yello, Paradisers! Are you positioned for a high-probability bullish reversal on #ONDO? Price is closing in on a key demand zone where a powerful move could ignite, but only if the structure holds.
💎ONDO is currently forming a Bullish Gartley Pattern, and price action is nearing the crucial $0.76–$

See all ideas
Summarizing what the indicators are suggesting.
Oscillators
Neutral
SellBuy
Strong sellStrong buy
Strong sellSellNeutralBuyStrong buy
Oscillators
Neutral
SellBuy
Strong sellStrong buy
Strong sellSellNeutralBuyStrong buy
Summary
Neutral
SellBuy
Strong sellStrong buy
Strong sellSellNeutralBuyStrong buy
Summary
Neutral
SellBuy
Strong sellStrong buy
Strong sellSellNeutralBuyStrong buy
Summary
Neutral
SellBuy
Strong sellStrong buy
Strong sellSellNeutralBuyStrong buy
Moving Averages
Neutral
SellBuy
Strong sellStrong buy
Strong sellSellNeutralBuyStrong buy
Moving Averages
Neutral
SellBuy
Strong sellStrong buy
Strong sellSellNeutralBuyStrong buy
Displays a symbol's price movements over previous years to identify recurring trends.
Frequently Asked Questions
The current price of ONDOUSDT SPOT (ONDO) is 1.0173 USDT — it has fallen −1.52% in the past 24 hours. Try placing this info into the context by checking out what coins are also gaining and losing at the moment and seeing ONDO price chart.
ONDOUSDT SPOT price has risen by 13.48% over the last week, its month performance shows a 4.37% increase, and as for the last year, ONDOUSDT SPOT has increased by 66.52%. See more dynamics on ONDO price chart.
Keep track of coins' changes with our Crypto Coins Heatmap.
Keep track of coins' changes with our Crypto Coins Heatmap.
ONDOUSDT SPOT (ONDO) reached its highest price on Dec 16, 2024 — it amounted to 2.1463 USDT. Find more insights on the ONDO price chart.
See the list of crypto gainers and choose what best fits your strategy.
See the list of crypto gainers and choose what best fits your strategy.
ONDOUSDT SPOT (ONDO) reached the lowest price of 0.0100 USDT on Jan 18, 2024. View more ONDOUSDT SPOT dynamics on the price chart.
See the list of crypto losers to find unexpected opportunities.
See the list of crypto losers to find unexpected opportunities.
The safest choice when buying ONDO is to go to a well-known crypto exchange. Some of the popular names are Binance, Coinbase, Kraken. But you'll have to find a reliable broker and create an account first. You can trade ONDO right from TradingView charts — just choose a broker and connect to your account.
Crypto markets are famous for their volatility, so one should study all the available stats before adding crypto assets to their portfolio. Very often it's technical analysis that comes in handy. We prepared technical ratings for ONDOUSDT SPOT (ONDO): today its technical analysis shows the buy signal, and according to the 1 week rating ONDO shows the buy signal. And you'd better dig deeper and study 1 month rating too — it's buy. Find inspiration in ONDOUSDT SPOT trading ideas and keep track of what's moving crypto markets with our crypto news feed.
ONDOUSDT SPOT (ONDO) is just as reliable as any other crypto asset — this corner of the world market is highly volatile. Today, for instance, ONDOUSDT SPOT is estimated as 2.93% volatile. The only thing it means is that you must prepare and examine all available information before making a decision. And if you're not sure about ONDOUSDT SPOT, you can find more inspiration in our curated watchlists.
You can discuss ONDOUSDT SPOT (ONDO) with other users in our public chats, Minds or in the comments to Ideas.