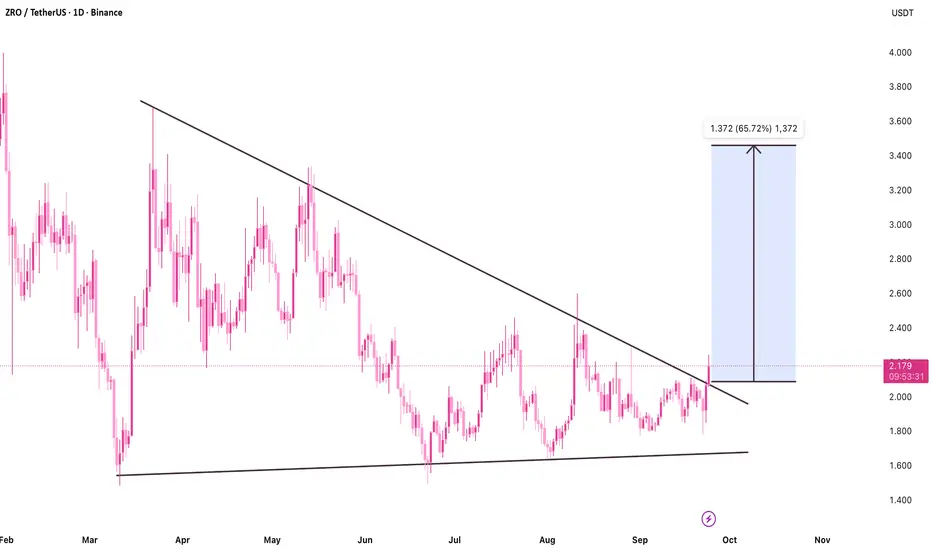
ZRO – Descending Triangle Breakout with 65% Upside TargetAfter breaking above a descending triangle structure, ZRO is now trading above the former resistance line near 2.05 USDT. This move confirms a bullish breakout, with price expanding above the falling trendline – now acting as dynamic support.
The projected move based on the triangle’s depth points t
Related pairs
ZROUSDT UPDATE#ZRO
UPDATE
ZRO Technical Setup
Pattern: Bullish falling wedge breakout
Current Price: $2.26
Target Price: $3.65
Target % Gain: 65.86%
ZRO has broken out of a falling wedge pattern on the 1D timeframe, signaling strong bullish momentum with a target near $3.65. Always use proper risk management

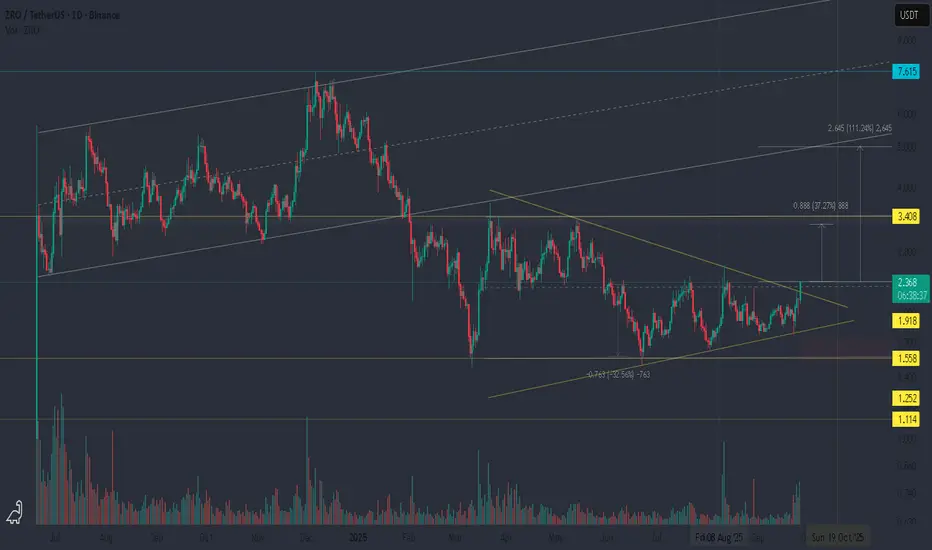
ZROUSDT — Breakout from Triangle ConsolidationThe price is breaking out of a triangular consolidation that had been forming for over three months during the summer.
Near-term target: resistance zone around 3.40, which aligns with the top of the channel.
Mid-term outlook: potential development of a cup formation with resistance in the 6.50–7.5
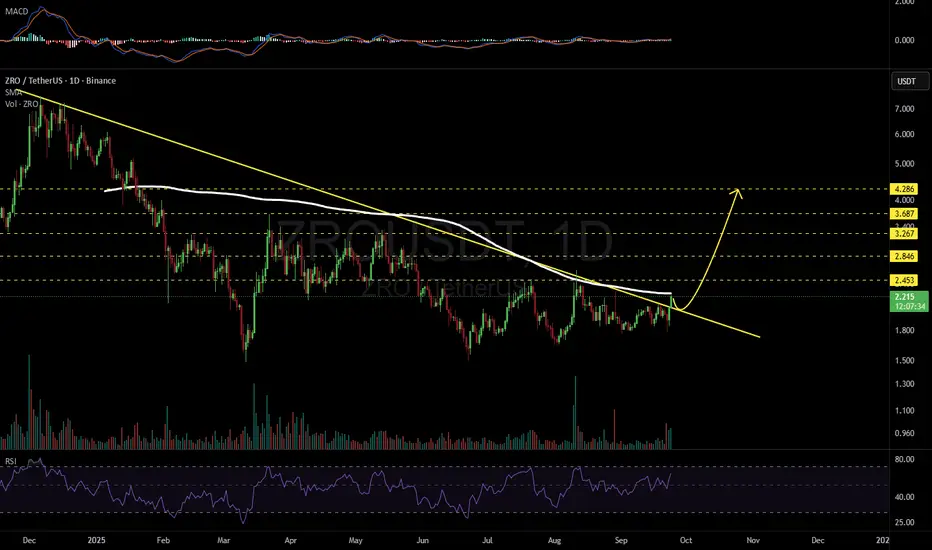
ZROUSDT 1D#ZRO has broken above the descending resistance on the daily timeframe. In case of a successful retest and a breakout above the daily SMA200, the potential targets are:
🎯 $2.453
🎯 $2.846
🎯 $3.267
🎯 $3.687
🎯 $4.286
⚠️ Always remember to use a tight stop-loss and follow proper risk management.
finally zro breaking long consolidation zro looking attractive for next few days, breaking long consolidation also breaking crucial horizontal area, once both got cleared will try to catch some with the target of 3.10
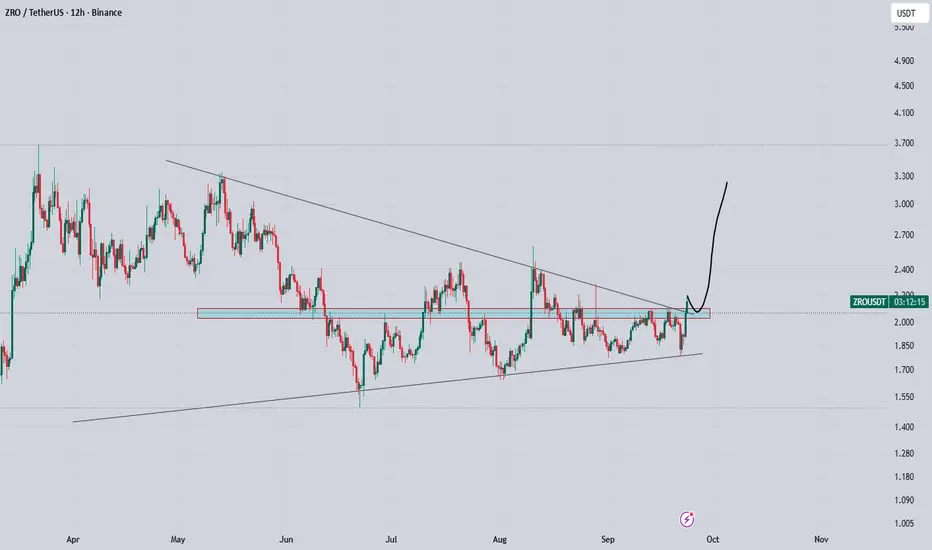
#ZRO/USDT Breaks Out of Rectangle Pattern#ZRO
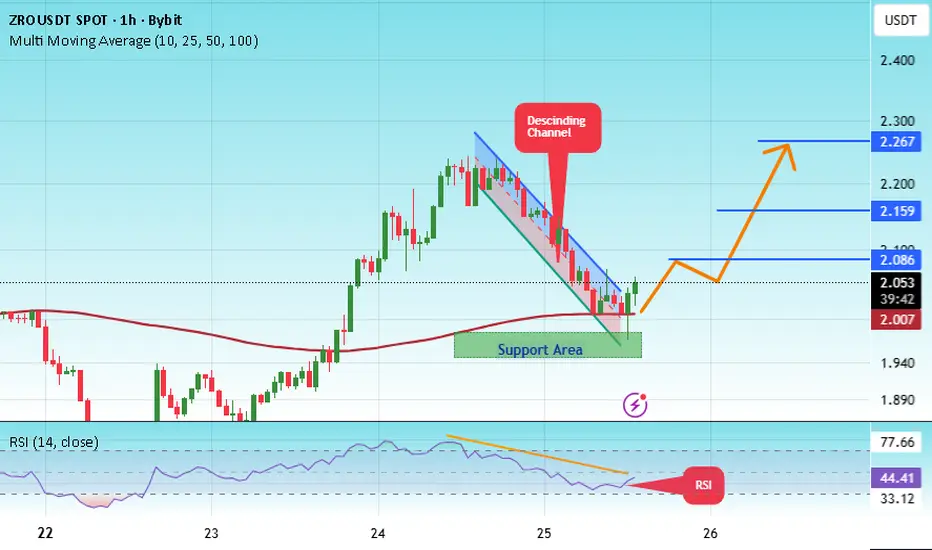
The price is moving within a descending channel on the 1-hour frame, adhering well to it, and is heading for a strong breakout and retest.
We have a bearish trend on the RSI indicator that is about to be broken and retested, which supports the upward breakout.
There is a major support area i
#ZRO/USDT Continue to Climb or Not? Must Watch For Bulls#ZRO
The price is moving within a descending channel on the 1-hour frame, adhering well to it, and is heading for a strong breakout and retest.
We have a bearish trend on the RSI indicator that is about to be broken and retested, which supports the upward breakout.
There is a major support area i
#ZRO#ZRO
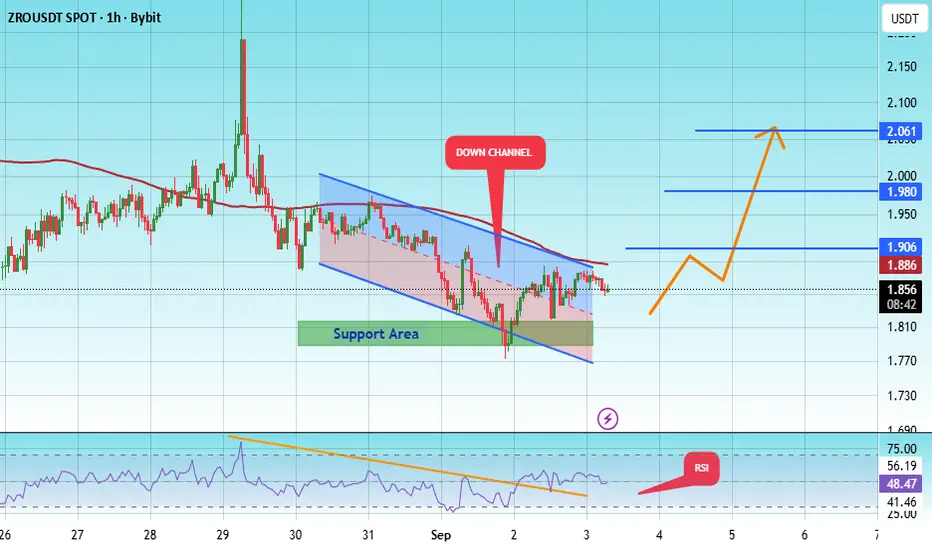
The price is moving within a descending channel on the 1-hour frame and is expected to break and continue upward.
We have a trend to stabilize above the 100 moving average once again.
We have a downtrend on the RSI indicator that supports the upward break.
We have a support area at the lowe

#ZRO/USDT Analysis: Breakout Potential with Overbought RSI !#ZRO
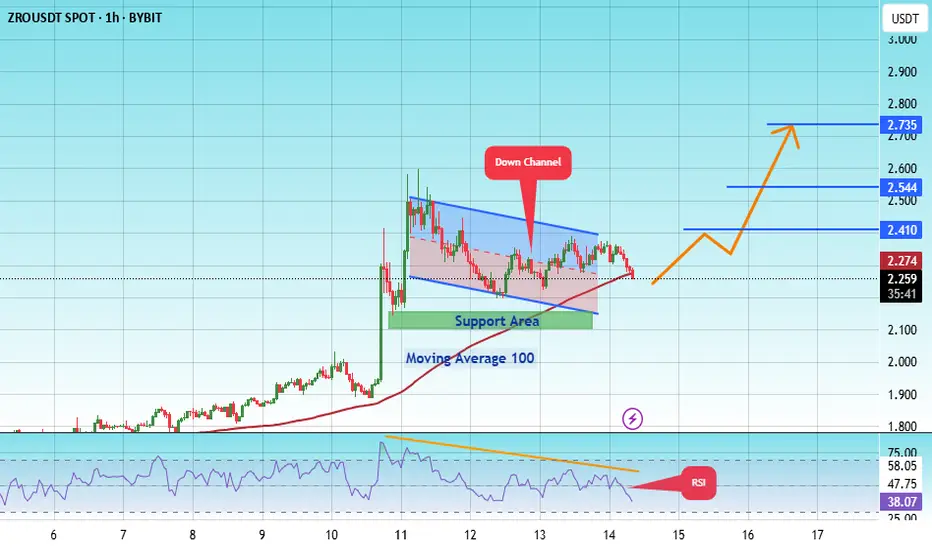
The price is moving within an ascending channel on the 1-hour frame, adhering well to it, and is on its way to break it strongly upwards and retest it.
We have support from the lower boundary of the ascending channel, at 2.15.
We have a downtrend on the RSI that is about to break and retest,
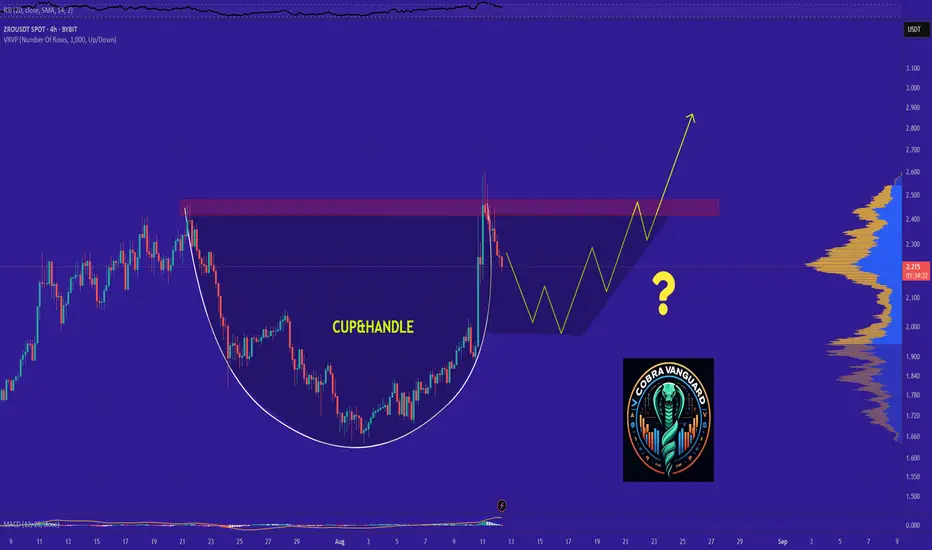
ZRO's Situation (4h) !!!It appears that the price is forming a cup and handle pattern, and if this occurs, it could push the price above $2.5.
Best regards CobraVanguard.💚
See all ideas
Summarizing what the indicators are suggesting.
Oscillators
Neutral
SellBuy
Strong sellStrong buy
Strong sellSellNeutralBuyStrong buy
Oscillators
Neutral
SellBuy
Strong sellStrong buy
Strong sellSellNeutralBuyStrong buy
Summary
Neutral
SellBuy
Strong sellStrong buy
Strong sellSellNeutralBuyStrong buy
Summary
Neutral
SellBuy
Strong sellStrong buy
Strong sellSellNeutralBuyStrong buy
Summary
Neutral
SellBuy
Strong sellStrong buy
Strong sellSellNeutralBuyStrong buy
Moving Averages
Neutral
SellBuy
Strong sellStrong buy
Strong sellSellNeutralBuyStrong buy
Moving Averages
Neutral
SellBuy
Strong sellStrong buy
Strong sellSellNeutralBuyStrong buy
Displays a symbol's price movements over previous years to identify recurring trends.
Frequently Asked Questions
The current price of ZRO / TetherUS (ZRO) is 2.396 USDT — it has fallen −0.59% in the past 24 hours. Try placing this info into the context by checking out what coins are also gaining and losing at the moment and seeing ZRO price chart.
ZRO / TetherUS price has risen by 18.74% over the last week, its month performance shows a 21.45% increase, and as for the last year, ZRO / TetherUS has decreased by −52.35%. See more dynamics on ZRO price chart.
Keep track of coins' changes with our Crypto Coins Heatmap.
Keep track of coins' changes with our Crypto Coins Heatmap.
ZRO / TetherUS (ZRO) reached its highest price on Dec 6, 2024 — it amounted to 7.567 USDT. Find more insights on the ZRO price chart.
See the list of crypto gainers and choose what best fits your strategy.
See the list of crypto gainers and choose what best fits your strategy.
ZRO / TetherUS (ZRO) reached the lowest price of 1.000 USDT on Jun 20, 2024. View more ZRO / TetherUS dynamics on the price chart.
See the list of crypto losers to find unexpected opportunities.
See the list of crypto losers to find unexpected opportunities.
The safest choice when buying ZRO is to go to a well-known crypto exchange. Some of the popular names are Binance, Coinbase, Kraken. But you'll have to find a reliable broker and create an account first. You can trade ZRO right from TradingView charts — just choose a broker and connect to your account.
Crypto markets are famous for their volatility, so one should study all the available stats before adding crypto assets to their portfolio. Very often it's technical analysis that comes in handy. We prepared technical ratings for ZRO / TetherUS (ZRO): today its technical analysis shows the buy signal, and according to the 1 week rating ZRO shows the buy signal. And you'd better dig deeper and study 1 month rating too — it's neutral. Find inspiration in ZRO / TetherUS trading ideas and keep track of what's moving crypto markets with our crypto news feed.
ZRO / TetherUS (ZRO) is just as reliable as any other crypto asset — this corner of the world market is highly volatile. Today, for instance, ZRO / TetherUS is estimated as 5.18% volatile. The only thing it means is that you must prepare and examine all available information before making a decision. And if you're not sure about ZRO / TetherUS, you can find more inspiration in our curated watchlists.
You can discuss ZRO / TetherUS (ZRO) with other users in our public chats, Minds or in the comments to Ideas.