CUSDT Forming Falling WedgeCUSDT is currently developing a falling wedge pattern, a strong bullish indicator that often precedes explosive upward movements. This formation suggests that the recent downtrend may be nearing its end as selling momentum weakens and buyers begin to accumulate positions. The good volume activity ad
Related pairs
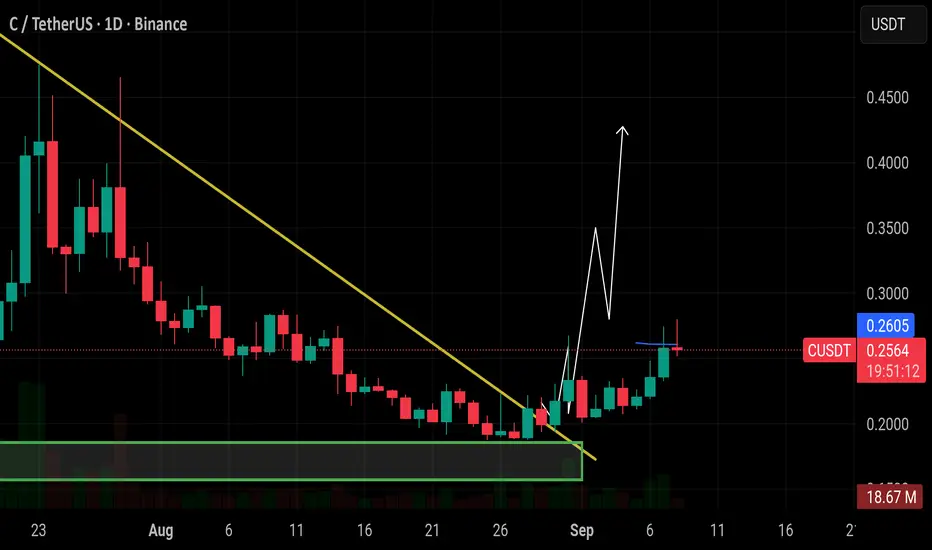
CUSDT Analysis C/USDT is currently consolidating within a sideways range 📦. The structure looks promising for a bullish breakout as momentum builds up. I’m expecting an upside leg in the next move 🚀.
⚠️ DYOR — Do Your Own Research

CUSDT 12H#C has formed a Rounding Bottom pattern on the 12H timeframe chart. It may retest the support level of 🛡 $0.2418 before the next leg up. In case of a successful bounce and a breakout above the resistance zone, the potential targets are:
🎯 $0.3020
🎯 $0.3289
🎯 $0.3672
🎯 $0.4160
⚠️ Always remember to

C / UsdtBINANCE:CUSDT
“Every call smashed 50–100% gains 💎
🚀 Next up: $C is ready to print for us 🔥📈”
Disclaimer : Not Financial Advice..

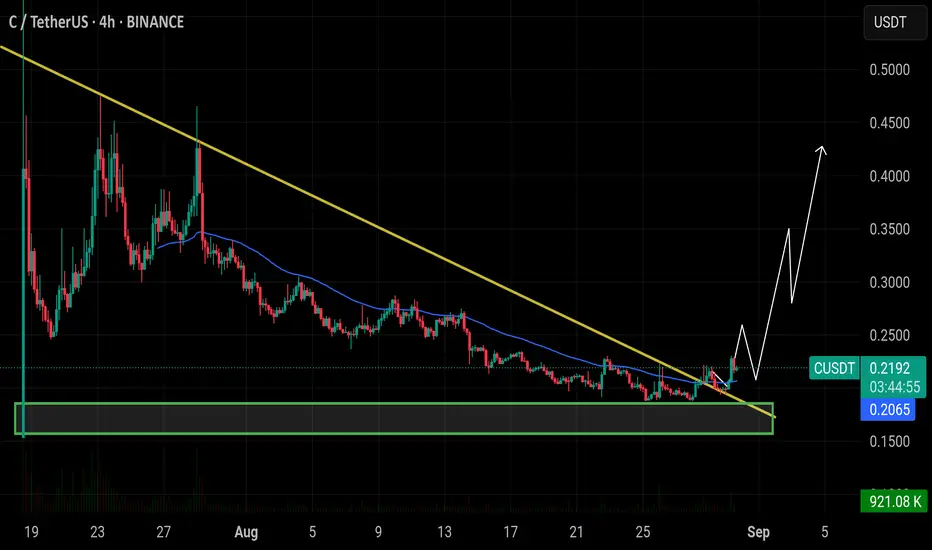
$CUSDT Breakout 70% Upside Ahead.BINANCE:CUSDT finally broke out of its long downtrend after moving sideways for weeks.
With support holding strong, it now has room to run and could push up nearly 70% toward the 0.4205 level if momentum continues.
DYOR. NFA
BINANCE:CUSDT Breakout 70% Upside Ahead

$C breakout retest played out perfectly — already up 30%+ $C breakout retest played out perfectly — already up 30%+ on spot and still showing strength. 🚀
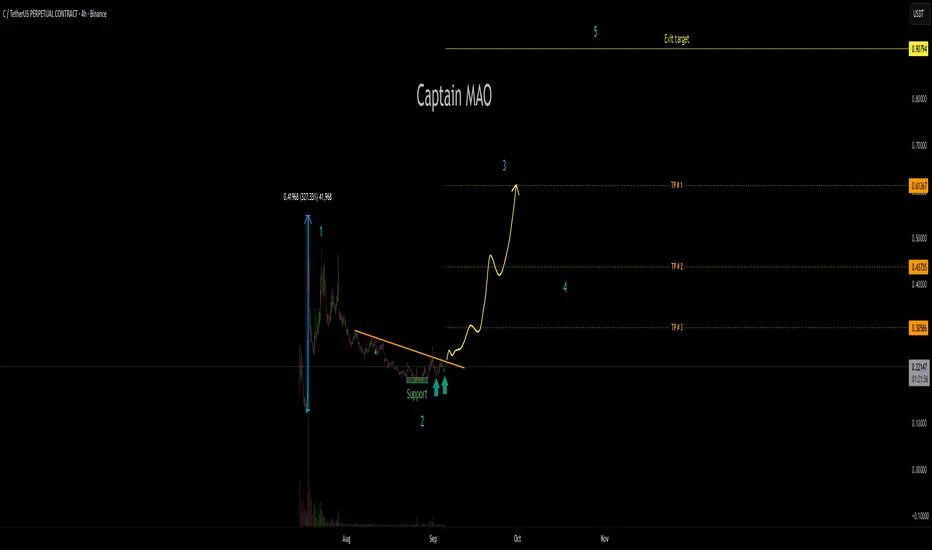
C/USDT - Wave 3 After its listing on Perpetual C/USDT printed a powerful Wave 1 rally of +300%, showing strong initial momentum. The following phase was a healthy corrective Wave 2, allowing the market to reset and absorb early profit-taking.
Currently, price action is stabilizing around the $0.20 zone, forming a
$C retesting breakout zone — strong hands accumulating while$C retesting breakout zone — strong hands accumulating while weak hands exit.
C (Spot)
BINANCE:CUSDT
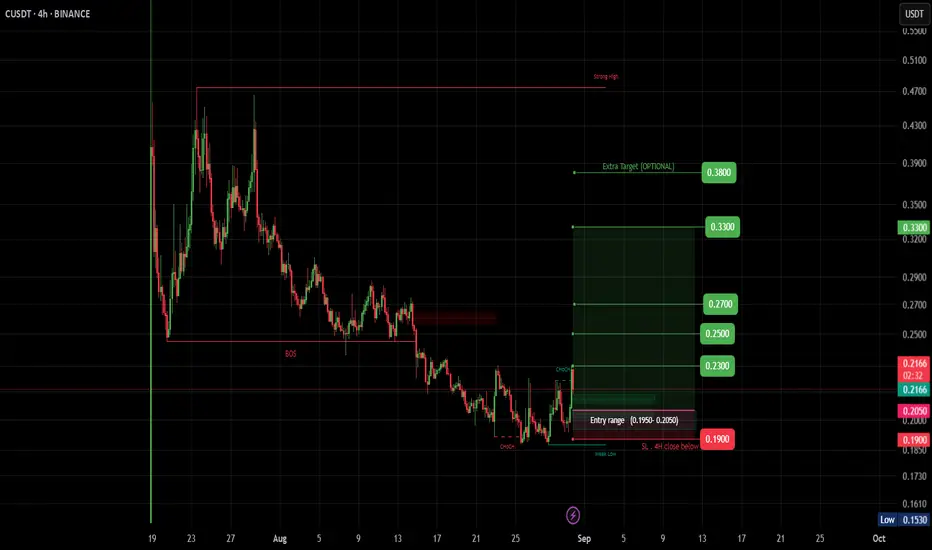
#C / USDT
Entry range (0.1950 - 0.2000) ***** (Wait for the price to cone to entry range)****
SL 4H close below 0.1900
T1 0.2300
T2 0.2500
T3 0.2700
T4. 0.3300
Extra Target Optional .3800
_______________________________________________________
Golden Advices.
*************
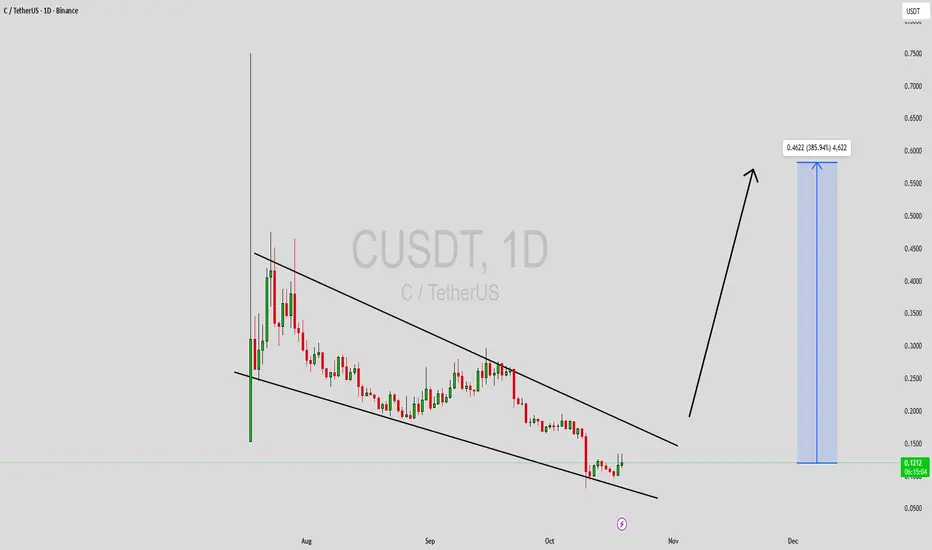
CUSDT UPDATE#C
UPDATE
C Technical Setup
Pattern : Falling Wedge Pattern
Current Price: $0.2059
Target Price: $0.4872
Target % Gain: 135%
Technical Analysis: C is forming a falling wedge on the 1D chart, which is a bullish reversal pattern. The price is consolidating near the lower support trendline, showing

See all ideas
Summarizing what the indicators are suggesting.
Oscillators
Neutral
SellBuy
Strong sellStrong buy
Strong sellSellNeutralBuyStrong buy
Oscillators
Neutral
SellBuy
Strong sellStrong buy
Strong sellSellNeutralBuyStrong buy
Summary
Neutral
SellBuy
Strong sellStrong buy
Strong sellSellNeutralBuyStrong buy
Summary
Neutral
SellBuy
Strong sellStrong buy
Strong sellSellNeutralBuyStrong buy
Summary
Neutral
SellBuy
Strong sellStrong buy
Strong sellSellNeutralBuyStrong buy
Moving Averages
Neutral
SellBuy
Strong sellStrong buy
Strong sellSellNeutralBuyStrong buy
Moving Averages
Neutral
SellBuy
Strong sellStrong buy
Strong sellSellNeutralBuyStrong buy
Frequently Asked Questions
The current price of C / TetherUS (C) is 0.1082 USDT — it has fallen −0.38% in the past 24 hours. Try placing this info into the context by checking out what coins are also gaining and losing at the moment and seeing C price chart.
C / TetherUS price has fallen by −4.90% over the last week, its month performance shows a −40.43% decrease, and as for the last year, C / TetherUS has decreased by −29.28%. See more dynamics on C price chart.
Keep track of coins' changes with our Crypto Coins Heatmap.
Keep track of coins' changes with our Crypto Coins Heatmap.
C / TetherUS (C) reached its highest price on Jul 18, 2025 — it amounted to 0.7500 USDT. Find more insights on the C price chart.
See the list of crypto gainers and choose what best fits your strategy.
See the list of crypto gainers and choose what best fits your strategy.
C / TetherUS (C) reached the lowest price of 0.0800 USDT on Oct 10, 2025. View more C / TetherUS dynamics on the price chart.
See the list of crypto losers to find unexpected opportunities.
See the list of crypto losers to find unexpected opportunities.
The safest choice when buying C is to go to a well-known crypto exchange. Some of the popular names are Binance, Coinbase, Kraken. But you'll have to find a reliable broker and create an account first. You can trade C right from TradingView charts — just choose a broker and connect to your account.
C / TetherUS (C) is just as reliable as any other crypto asset — this corner of the world market is highly volatile. Today, for instance, C / TetherUS is estimated as 3.92% volatile. The only thing it means is that you must prepare and examine all available information before making a decision. And if you're not sure about C / TetherUS, you can find more inspiration in our curated watchlists.
You can discuss C / TetherUS (C) with other users in our public chats, Minds or in the comments to Ideas.