ZROUSDT Chart Anlaysis W 13-Dec-25Stop Loss: 0.330
Entry Price: 2.558
Take Profit 1: 4.834
Take Profit 2: 7.078
On the weekly chart, a Falling Wedge pattern has formed, indicating a potential shift in trend from bearish to bullish. The suggested entry is at 2.558, with expectations for the price to move toward the projected take-pr
Related pairs

#ZRO/USDT could be another strong contender
#ZRO
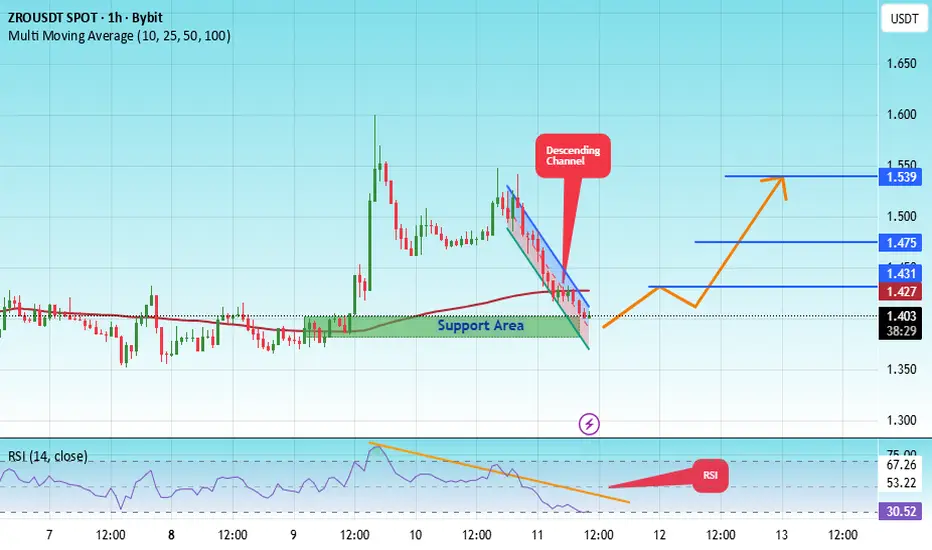
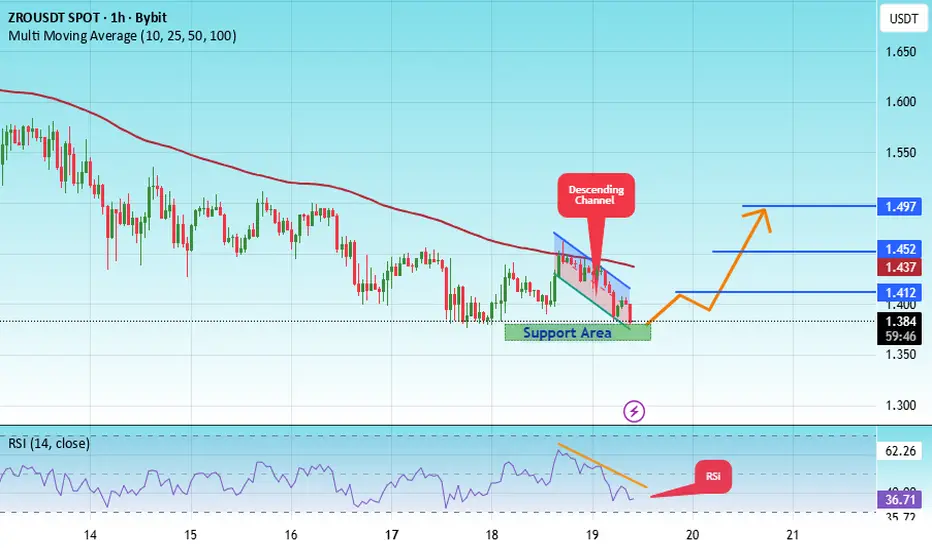
The price is moving in a descending channel on the 1-hour timeframe. It has reached the lower boundary and is heading towards breaking above it, with a retest of the upper boundary expected.
We have a downtrend on the RSI indicator, which has reached near the lower boundary, and an upward re
#ZRO/USDT could be another strong contender#ZRO
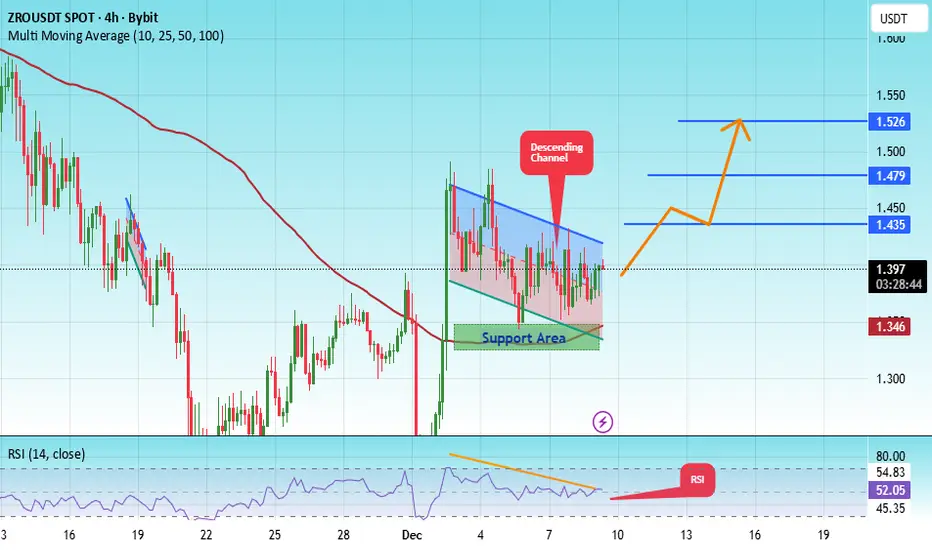
The price is moving in a descending channel on the 1-hour timeframe. It has reached the lower boundary and is heading towards a breakout, with a retest of the upper boundary expected.
We are seeing a bearish bias in the Relative Strength Index (RSI), which has reached near the lower boundary,

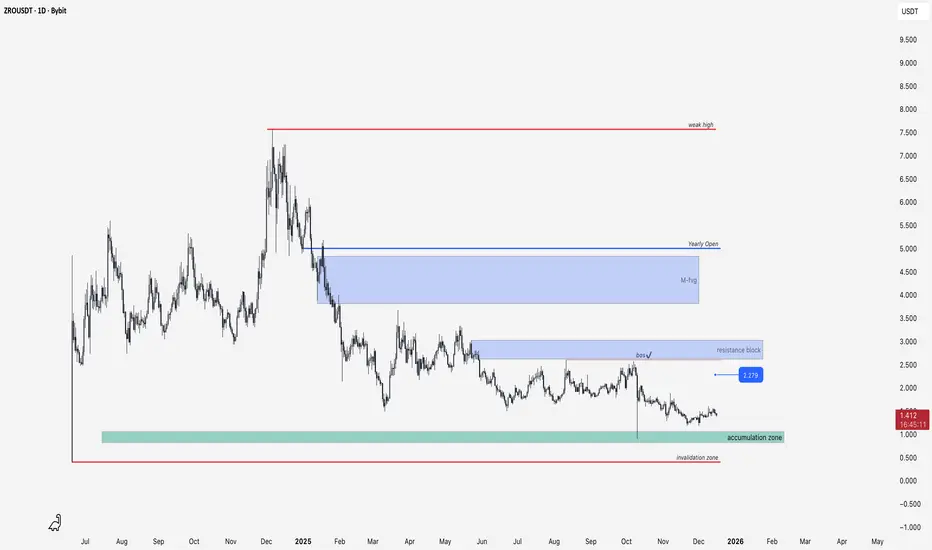
ZRO Post-Listing Power: Retest Accumulation & Bullish BreakoutZRO looks pretty decent after the listing compared to the charts of tokens that were added to exchanges at the same time! BYBIT:ZROUSDT
Technically, we've reached the Initiation Accumulation Distribution phase up to the last accumulation zone! But it's always profitable to start DCA here.
Invali
ZRO Weakness Into 4H FVG — Watching for Reversal Toward $1.50ZRO / USDT is showing weakness and continues to decline toward the 4H FVG zone at $1.24–$1.21. This area will be important to watch for a potential reaction. If price shows strength from this FVG, a reversal toward $1.50 can follow. Manage risk wisely and wait for confirmation.

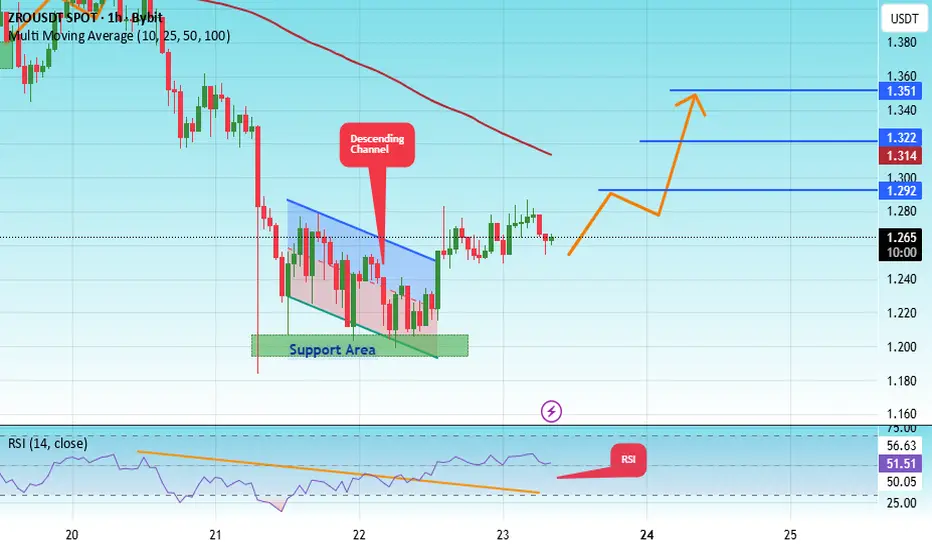
#ZRO/USDT could be another strong contender#ZRO
The price is moving in a descending channel on the 1-hour timeframe. It has reached the lower boundary and is heading towards breaking above it, with a retest of the upper boundary expected.
We have a downtrend on the RSI indicator, which has reached near the lower boundary, and an upward reb
ZROUSDT 1D#ZRO has broken above the falling wedge resistance on the daily chart. It has been rejected from the Ichimoku cloud and is now pulling back to retest the wedge. In case of a successful retest — in other words, a bounce — we can expect the following targets:
🎯 $1.649
🎯 $1.799
🎯 $1.948
🎯 $2.160
🎯 $2.

#ZRO/USDT could be another strong contender#ZRO
The price is moving within an ascending channel on the 1-hour timeframe and is adhering to it well. It is poised to break out strongly and retest the channel.
We have a downtrend line on the RSI indicator that is about to break and retest, which supports the upward move.
There is a key suppo
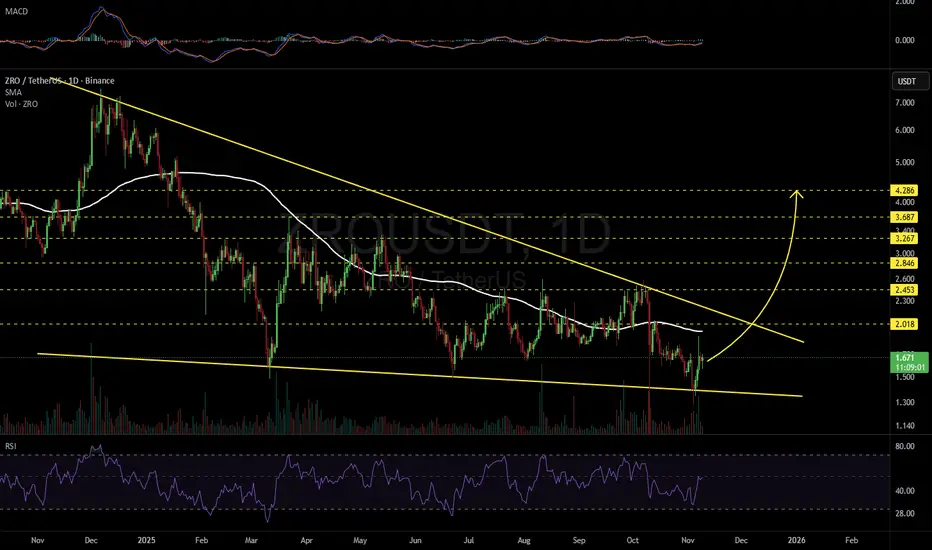
ZROUSDT 1D#ZRO is currently trading within a falling wedge pattern on the daily timeframe. In case of a breakout above the daily SMA100 and the wedge resistance, the potential upside targets are:
🎯 $2.018
🎯 $2.453
🎯 $2.846
🎯 $3.267
🎯 $3.687
🎯 $4.286
⚠️ Always remember to use a tight stop-loss and maintain p
See all ideas
Summarizing what the indicators are suggesting.
Oscillators
Neutral
SellBuy
Strong sellStrong buy
Strong sellSellNeutralBuyStrong buy
Oscillators
Neutral
SellBuy
Strong sellStrong buy
Strong sellSellNeutralBuyStrong buy
Summary
Neutral
SellBuy
Strong sellStrong buy
Strong sellSellNeutralBuyStrong buy
Summary
Neutral
SellBuy
Strong sellStrong buy
Strong sellSellNeutralBuyStrong buy
Summary
Neutral
SellBuy
Strong sellStrong buy
Strong sellSellNeutralBuyStrong buy
Moving Averages
Neutral
SellBuy
Strong sellStrong buy
Strong sellSellNeutralBuyStrong buy
Moving Averages
Neutral
SellBuy
Strong sellStrong buy
Strong sellSellNeutralBuyStrong buy
Displays a symbol's price movements over previous years to identify recurring trends.
Frequently Asked Questions
The current price of ZRO / TetherUS (ZRO) is 1.270 USDT — it has fallen −5.01% in the past 24 hours. Try placing this info into the context by checking out what coins are also gaining and losing at the moment and seeing ZRO price chart.
ZRO / TetherUS price has fallen by −15.30% over the last week, its month performance shows a −9.74% decrease, and as for the last year, ZRO / TetherUS has decreased by −80.68%. See more dynamics on ZRO price chart.
Keep track of coins' changes with our Crypto Coins Heatmap.
Keep track of coins' changes with our Crypto Coins Heatmap.
ZRO / TetherUS (ZRO) reached its highest price on Dec 6, 2024 — it amounted to 7.567 USDT. Find more insights on the ZRO price chart.
See the list of crypto gainers and choose what best fits your strategy.
See the list of crypto gainers and choose what best fits your strategy.
ZRO / TetherUS (ZRO) reached the lowest price of 0.311 USDT on Oct 10, 2025. View more ZRO / TetherUS dynamics on the price chart.
See the list of crypto losers to find unexpected opportunities.
See the list of crypto losers to find unexpected opportunities.
The safest choice when buying ZRO is to go to a well-known crypto exchange. Some of the popular names are Binance, Coinbase, Kraken. But you'll have to find a reliable broker and create an account first. You can trade ZRO right from TradingView charts — just choose a broker and connect to your account.
Crypto markets are famous for their volatility, so one should study all the available stats before adding crypto assets to their portfolio. Very often it's technical analysis that comes in handy. We prepared technical ratings for ZRO / TetherUS (ZRO): today its technical analysis shows the strong sell signal, and according to the 1 week rating ZRO shows the sell signal. And you'd better dig deeper and study 1 month rating too — it's sell. Find inspiration in ZRO / TetherUS trading ideas and keep track of what's moving crypto markets with our crypto news feed.
ZRO / TetherUS (ZRO) is just as reliable as any other crypto asset — this corner of the world market is highly volatile. Today, for instance, ZRO / TetherUS is estimated as 9.52% volatile. The only thing it means is that you must prepare and examine all available information before making a decision. And if you're not sure about ZRO / TetherUS, you can find more inspiration in our curated watchlists.
You can discuss ZRO / TetherUS (ZRO) with other users in our public chats, Minds or in the comments to Ideas.