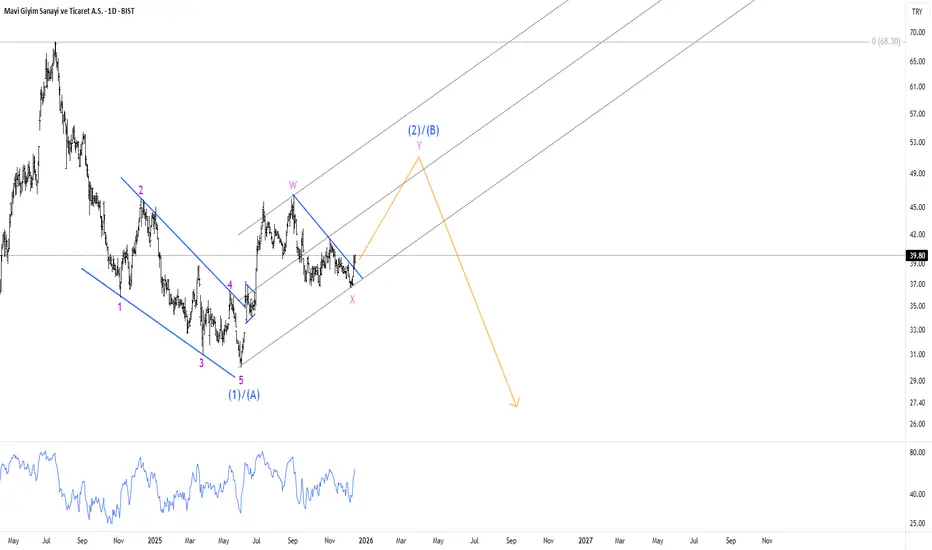
Mavi in a correctionmavi seems completed a diagnoal which may be Wave A or Wave 1 after the correction ends it should make new lows.
Mavi Giyim Sanayi ve Ticaret A.S.
No trades
Next report date
—
Report period
—
EPS estimate
—
Revenue estimate
—
3.00 TRY
2.72 B TRY
38.52 B TRY
569.25 M
About Mavi Giyim Sanayi ve Ticaret A.S.
Sector
Industry
CEO
Ahmet Cüneyt Yavuz
Website
Headquarters
Istanbul
Founded
1991
IPO date
Jun 15, 2017
IPO offer price
12.21 USD
Identifiers
2
ISINTREMAVI00037
Mavi Giyim Sanayi ve Ticaret AS engages in the design, manufacture, and sale of ready-to-wear denim apparel. Its products include knit and woven shirts, t-shirts, sweaters, jackets, skirts, dresses, accessories, and denim bottoms for men, women, and children. It operates through the Turkey and International geographical segments. The International segment consists of Europe, USA, Canada, Russia, and the rest of the world. The company was founded by Sait Akarlilar, Hayriye Fethiye Akarlilar, Ragip Ersin Akarlilar, Fatma Elif Akarlilar, and Seyhan Akarlilar in 1991 and is headquartered in Istanbul, Turkey.
Related stocks
MAVI - 13 months HEAD & SHOULDERS══════════════════════════════
Since 2014, my markets approach is to spot
trading opportunities based solely on the
development of
CLASSICAL CHART PATTERNS
🤝Let’s learn and grow together 🤝
══════════════════════════════
Hello Traders ✌
After a careful consideration I came to the conclusion that:
-


MAVI CURRENT SITUATIONIt needs to do a correction before it goes up also while waiting for earnings date come closer timing. 91.5-94.0 might be good place to buy.


See all ideas
Summarizing what the indicators are suggesting.
Neutral
SellBuy
Strong sellStrong buy
Strong sellSellNeutralBuyStrong buy
Neutral
SellBuy
Strong sellStrong buy
Strong sellSellNeutralBuyStrong buy
Neutral
SellBuy
Strong sellStrong buy
Strong sellSellNeutralBuyStrong buy
An aggregate view of professional's ratings.
Neutral
SellBuy
Strong sellStrong buy
Strong sellSellNeutralBuyStrong buy
Neutral
SellBuy
Strong sellStrong buy
Strong sellSellNeutralBuyStrong buy
Neutral
SellBuy
Strong sellStrong buy
Strong sellSellNeutralBuyStrong buy
Displays a symbol's price movements over previous years to identify recurring trends.
SPYI
SPDR MSCI All Country World Investable Market UCITS ETF Accum.Shs USDWeight
0.03%
Market value
1.43 M
USD
TLTE
FlexShares Morningstar Emerging Markets Factor Tilt Index FundWeight
0.07%
Market value
198.60 K
USD
Explore more ETFs
Frequently Asked Questions
The current price of MAVI is 40.28 TRY — it has decreased by −0.87% in the past 24 hours. Watch Mavi Giyim Sanayi ve Ticaret A.S. stock price performance more closely on the chart.
Depending on the exchange, the stock ticker may vary. For instance, on BIST exchange Mavi Giyim Sanayi ve Ticaret A.S. stocks are traded under the ticker MAVI.
MAVI stock has risen by 2.23% compared to the previous week, the month change is a 6.24% rise, over the last year Mavi Giyim Sanayi ve Ticaret A.S. has showed a −2.11% decrease.
We've gathered analysts' opinions on Mavi Giyim Sanayi ve Ticaret A.S. future price: according to them, MAVI price has a max estimate of 68.22 TRY and a min estimate of 54.00 TRY. Watch MAVI chart and read a more detailed Mavi Giyim Sanayi ve Ticaret A.S. stock forecast: see what analysts think of Mavi Giyim Sanayi ve Ticaret A.S. and suggest that you do with its stocks.
MAVI reached its all-time high on Jul 16, 2024 with the price of 68.50 TRY, and its all-time low was 1.28 TRY and was reached on Aug 15, 2018. View more price dynamics on MAVI chart.
See other stocks reaching their highest and lowest prices.
See other stocks reaching their highest and lowest prices.
MAVI stock is 2.45% volatile and has beta coefficient of 0.86. Track Mavi Giyim Sanayi ve Ticaret A.S. stock price on the chart and check out the list of the most volatile stocks — is Mavi Giyim Sanayi ve Ticaret A.S. there?
Today Mavi Giyim Sanayi ve Ticaret A.S. has the market capitalization of 32.61 B, it has increased by 6.76% over the last week.
Yes, you can track Mavi Giyim Sanayi ve Ticaret A.S. financials in yearly and quarterly reports right on TradingView.
Mavi Giyim Sanayi ve Ticaret A.S. is going to release the next earnings report on Mar 16, 2026. Keep track of upcoming events with our Earnings Calendar.
MAVI net income for the last quarter is 1.01 B TRY, while the quarter before that showed 231.09 M TRY of net income which accounts for 335.48% change. Track more Mavi Giyim Sanayi ve Ticaret A.S. financial stats to get the full picture.
Yes, MAVI dividends are paid annually. The last dividend per share was 1.17 TRY. As of today, Dividend Yield (TTM)% is 2.82%. Tracking Mavi Giyim Sanayi ve Ticaret A.S. dividends might help you take more informed decisions.
Mavi Giyim Sanayi ve Ticaret A.S. dividend yield was 3.30% in 2024, and payout ratio reached 34.18%. The year before the numbers were 2.98% and 47.36% correspondingly. See high-dividend stocks and find more opportunities for your portfolio.
As of Dec 24, 2025, the company has 5.87 K employees. See our rating of the largest employees — is Mavi Giyim Sanayi ve Ticaret A.S. on this list?
EBITDA measures a company's operating performance, its growth signifies an improvement in the efficiency of a company. Mavi Giyim Sanayi ve Ticaret A.S. EBITDA is 7.87 B TRY, and current EBITDA margin is 18.61%. See more stats in Mavi Giyim Sanayi ve Ticaret A.S. financial statements.
Like other stocks, MAVI shares are traded on stock exchanges, e.g. Nasdaq, Nyse, Euronext, and the easiest way to buy them is through an online stock broker. To do this, you need to open an account and follow a broker's procedures, then start trading. You can trade Mavi Giyim Sanayi ve Ticaret A.S. stock right from TradingView charts — choose your broker and connect to your account.
Investing in stocks requires a comprehensive research: you should carefully study all the available data, e.g. company's financials, related news, and its technical analysis. So Mavi Giyim Sanayi ve Ticaret A.S. technincal analysis shows the buy rating today, and its 1 week rating is buy. Since market conditions are prone to changes, it's worth looking a bit further into the future — according to the 1 month rating Mavi Giyim Sanayi ve Ticaret A.S. stock shows the buy signal. See more of Mavi Giyim Sanayi ve Ticaret A.S. technicals for a more comprehensive analysis.
If you're still not sure, try looking for inspiration in our curated watchlists.
If you're still not sure, try looking for inspiration in our curated watchlists.