GOLD (XAU-GC) BUY PLAN📊 Market Sentiment
Market sentiment for GOLD remains strongly bullish. One of the key drivers is the aggressive accumulation by global central banks. Recession concerns and persistent inflation fears continue to position gold as one of the most attractive safe-haven assets.
📈 Technical Analysis
Price has completed the expected accumulation phase and broke out strongly from the accumulation range. This former range has now turned into a clear demand zone. Price has pulled back into this zone again and is currently testing the $4060 level.
📌 Game Plan
The $4060–$3900 zone is my primary buy zone. I will continue accumulating within this range.
My first target is $4250, followed by $4400, which aligns with new all-time-high expectations.
If price closes below $3900 on the daily, this idea becomes invalid. Therefore, my stop is a daily close under $3900.
💬 If this breakdown aligns with your outlook, like and comment below.
For deeper sentiment and strategy insights, subscribe to my Substack free access available.
⚠️ This analysis is for educational purposes only and does not constitute financial advice. Always conduct your own research before trading or investing.
Gold TRY per gram Futures
No trades
Trade ideas

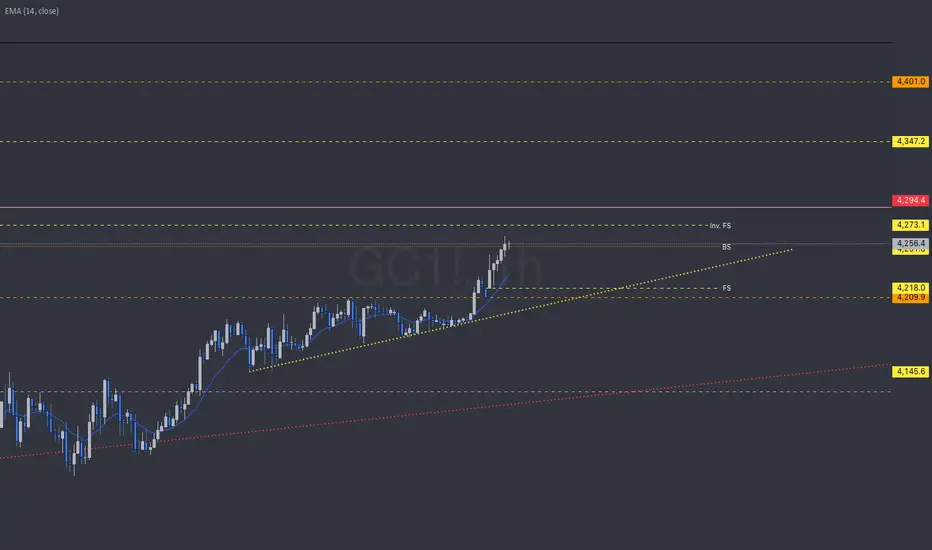
GC | Week 49 | 1hr chartT.A explained -
BackSide (BS)
FrontSide (FS)
Inverse BS (Inv.BS)
Inverse FS (Inv.FS)
BS & FS levels are expected support when dashed lines, tested when dotted and resistance when solid lines.
The inverse is true for the Inv. BS Inv. FS levels, they are resistance as dashed lines, tested as dotted and support as solid lines.
Monthly timeframe is color pink
weekly grey
daily is red
4hr is orange
1hr is yellow
15min is blue
5min is green if they are shown.
strength favors the higher timeframe.
2x dotted levels are origin levels where trends have or will originate. When trends break, price will target the origin of the trend. its math, when the trend breaks, the vertex breaks too so the higher timeframe level/trend that breaks, the more volatility there could be as strength in the orders flow in to fuel the move.
Triple Top - Double Bottom. Go Next Golden Shift4125 for a potential reload (supply area). 4275 - to make it all back.

Gold Context: December Open & Holiday Inventory CheckCOMEX_MINI:MGCG2026 COMEX:GC1!
Traders. Here is the context update as we transition into the new month.
Market Context (Holiday Drift): The auction drifted higher on thin volume during the Thanksgiving and Black Friday shortened sessions. This extension was largely driven by a lack of sellers rather than aggressive buying, leaving us with a "thin" structure.
Structure & Inventory: We have significant inventory resting back at 4200 – 4170, sitting just above the Previous Week High (PWH).
Current Action: Price is holding the holiday extension.
The Problem: The move up lacks heavy volume support. We have "unfinished business" below at the breakout zone.
Plan & Execution: Monday marks the start of fresh December flows. I am not interested in chasing this extension at these highs.
Stance: Flat / Patient.
The Test: I want to see Gold rotate back to test the inventory at 4200 – 4170 first.
Decision: We need to verify if buyers will defend this zone (turning old resistance into support) before committing to a new directional bias.
Talk to you for the next update.
Gold Update 02DEC2025: Multiple Options Are PossibleThe price has been stuck in the range as expected for wave 4
Let’s navigate this chaos and build viable paths on the chart
Option 1: Ending Diagonal wave 5 — pink marks
This option is based on the idea that wave 4 looks disproportionately large compared to wave 2
It could already be over after the first large move down to the $3,900 area
The current ascending zigzag may be shaping an Ending Diagonal in wave 5 to retest the former top around $4,400
Option 2: Triangle — orange marks
I left this path on the chart last time for visualization and it still could play out
Waves A and B could be completed with waves C, D, E ahead
Option 3: Large sideways consolidation (range, box) — white marks
This scenario implies a flat correction within the established $4,400–$3,900 range
Which path do you think the price will take?
Share your thoughts in the comments below

GC UpdateSilver looks topped out, and gold moving down as well. I think I'll wait for indicators this time, lol.
I exited out of the trade a bit early last week because ES1! had an open gap that I knew would fill, and I wasn't sure if gold would go down with the stock market.
With silver going parabolic, and gold following the same direction, I think this might be a difficult trade to track, but I'll give it a go, lol.

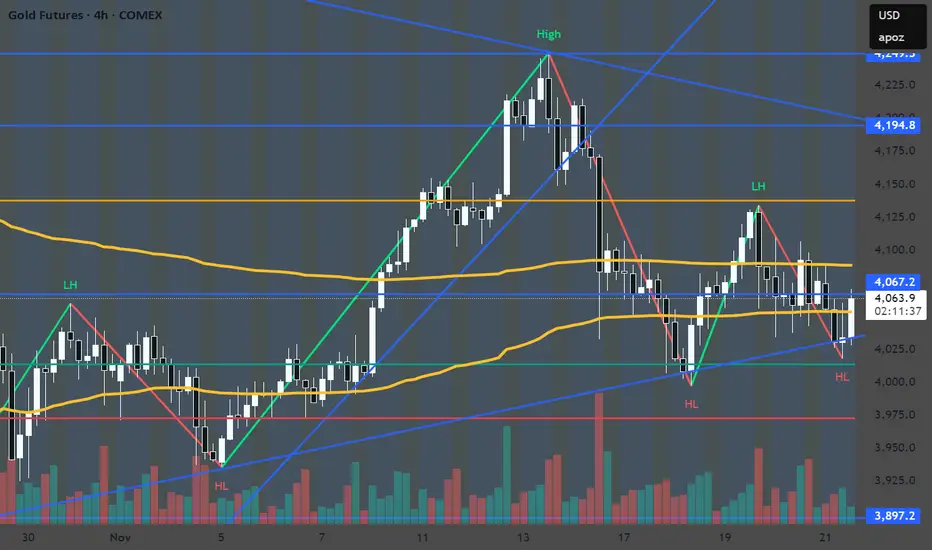
Gold holding trendline push towards 4194 possibleA Long position towards 4194 is likely as we see that this trendline holds firm.
1H Rally-Base-Rally Long Setup | Weekly & Daily AlignedMarket structure remains bullish across the higher timeframes with the Weekly, Daily, and 1H all trending upward. I’m focusing on the most recently created valid 1H Rally-Base-Rally demand zone for a potential long entry.
This zone is high quality because it:
✅ Removed opposing supply zones
✅ Broke a valid trendline on departure
✅ Shows strong impulsive buying pressure
✅ Is the most recent institutional demand on the 1H
Plan is to wait for price to return into this zone for continuation with the higher-timeframe trend. As always, patience and risk management first no chasing price.

GC UpdateMFI hasn't quite hit oversold, but it looks like it's melting up out of the pennant. Went long on Dec 26 GLD calls, going for a longer term strategy this time, so I'm not just cycling when MFI goes oversold on the 3 hr.
With longer term calls, it's not a big deal if it does dip.
Gold Short This is very pure Technical idea for Scalpers this technical idea is only my produce i recommend you to only watch my analyses for just few days than apply it

Gold. This is what the opportunity setup looked like.Gold.
This is what the opportunity setup looked like way back in August of 2023.
Price was $1922. Now $4226. Over 120% higher.
There is no such opportunity now.

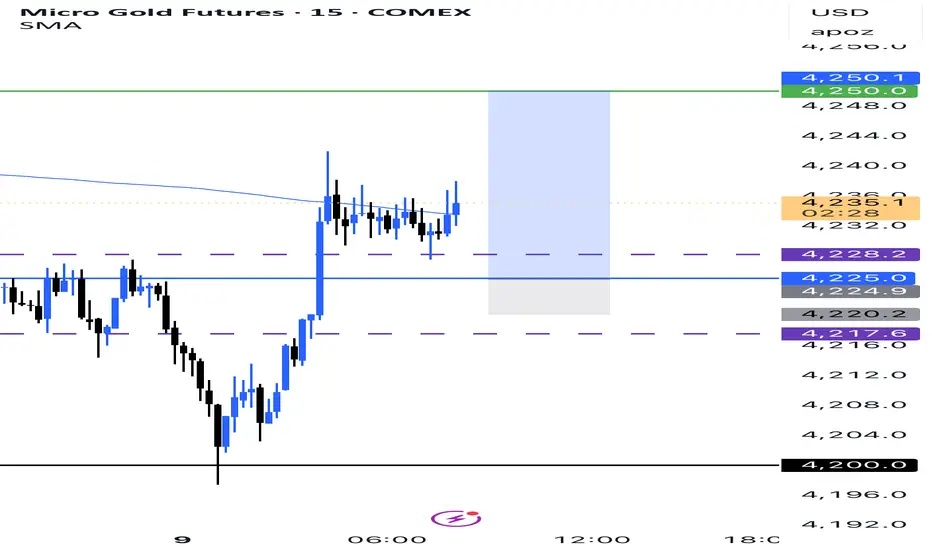
Buy GCGC tested my level of interest according my morning analysis. Buying gold based on 15M engulfing candle

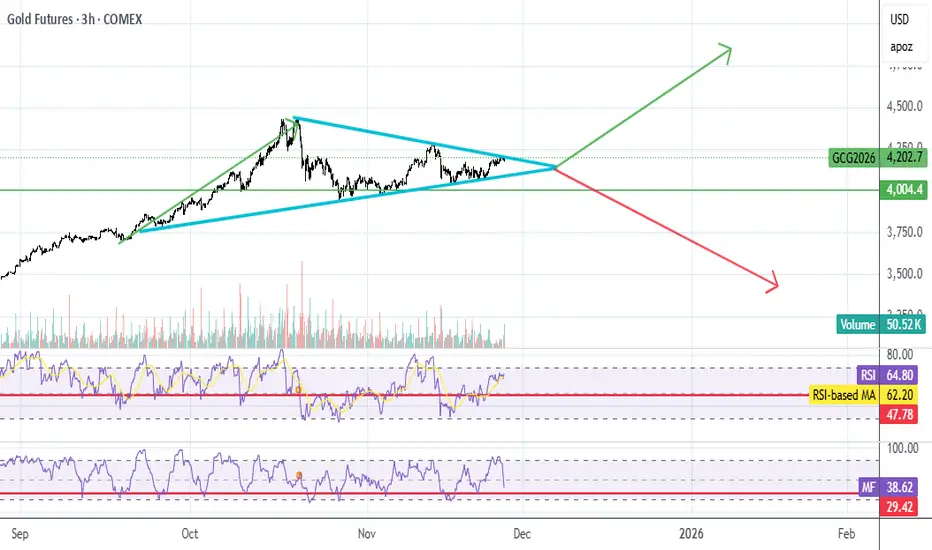
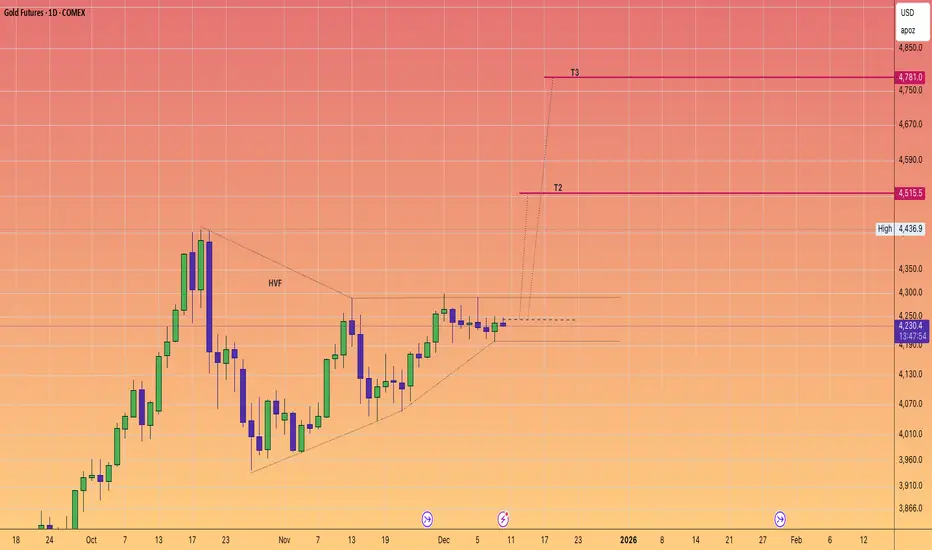
GOLD in a windup. Targets $4800AS we progress ever closer to the quite historic level of $5k for #GOLD
We note that Gold has been quite predictable and routinely has delivered +20% powerful moves since 2024.
The price action currently suggests we are about have another pop very soon.
Will it be enough to tag the $5K level
odds suggest that it definitely on the table.
The #HVF pattern points to $4800 and with some over performance we are right on that doorstep.
Selling GCBased on my morning analysis selling GC from Daily range high to the middle of the range. Going for 1:2 RR
Gold Context: Reclaiming 4227 & Follow-Through FlowsFOREXCOM:XAUUSD COMEX_MINI:MGCG2026 COMEX:GC1!
Traders. Pre-US Open update on the developing structure.
Market Context (Reclaiming Value):
Gold has successfully rotated back above 4227, reclaiming Friday's trading range.
• The Flow: We observed initial short covering that found genuine follow-through. This indicates that the market is not just covering shorts but finding acceptance at these higher prices.
• Structural Shift: By trading back inside Friday's range, the auction has negated the immediate bearish pressure seen at the lows.
Structure & Outlook:
• The Pivot (4227): This level is now our key reference. As long as Gold facilitates trade above 4227, the bias remains constructive (Long).
• The Target: The immediate destination for this rotation is 4250.
• Condition: We need to see the US Open maintain this bid and not fall back below the 4227 shelf.
Plan & Execution:
• Bias: Long / Constructive.
• Invalidation: A failure to hold 4227 would put the auction back into a weak position.
Talk to you for the next update.

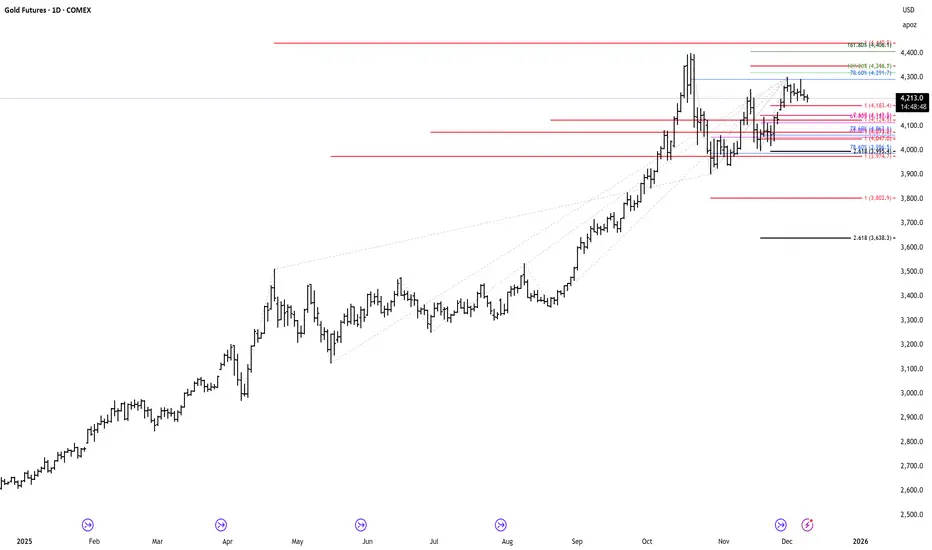
Gold Futures - Daily view !Gold Futures - Daily view ! -Short term balancing and cluster zone to monitor !
Dec 9 Daily trade plan for GCGold is ranging recently. Looking for trades from range lows or highs. For today Previous Day low, Daily equal lows and Previous Week low seem like a target. I will be looking to sell into these lows or buy after lows are sweapt

Gold Context: Failed Breakdown & Structure ResilienceCOMEX:GC1! COMEX_MINI:MGCG2026 FOREXCOM:XAUUSD
Traders. Update on the opening flows of the week.
Market Context (The Defense): Yesterday, the auction probed slightly below Friday's low, but failed to find acceptance or continuation.
The Reaction: Instead of triggering a broader liquidation break, we saw immediate short covering.
Key Observation: The market barely tested Thursday's low. This inability to extend lower and "repair" the structure indicates a lack of aggressive selling interest.
Structure & Outlook: I do not view this price action as a sign of weakness. On the contrary, the rejection of lower prices suggests responsive buying is present.
The Expectation: We are looking for this initial short covering to transition into New Money (OTF) buying.
The Confirmation: If "New Money" steps in above the current balance, it validates the resilience we saw yesterday and should drive the auction higher.
Plan & Execution:
Bias: Constructive / Looking for upside rotation.
Focus: Monitoring the transition from mechanical short covering to genuine initiative buying.
Talk to you for the next update.

GC | Week 50 | 1hr chart T.A explained -
BackSide (BS)
FrontSide (FS)
Inverse BS (Inv.BS)
Inverse FS (Inv.FS)
BS & FS levels are expected support when dashed lines, tested when dotted and resistance when solid lines.
The inverse is true for the Inv. BS Inv. FS levels, they are resistance as dashed lines, tested as dotted and support as solid lines.
Monthly timeframe is color pink
weekly grey
daily is red
4hr is orange
1hr is yellow
15min is blue
5min is green if they are shown.
strength favors the higher timeframe.
2x dotted levels are origin levels where trends have or will originate. When trends break, price will target the origin of the trend. its math, when the trend breaks, the vertex breaks too so the higher timeframe level/trend that breaks, the more volatility there could be as strength in the orders flow in to fuel the move.

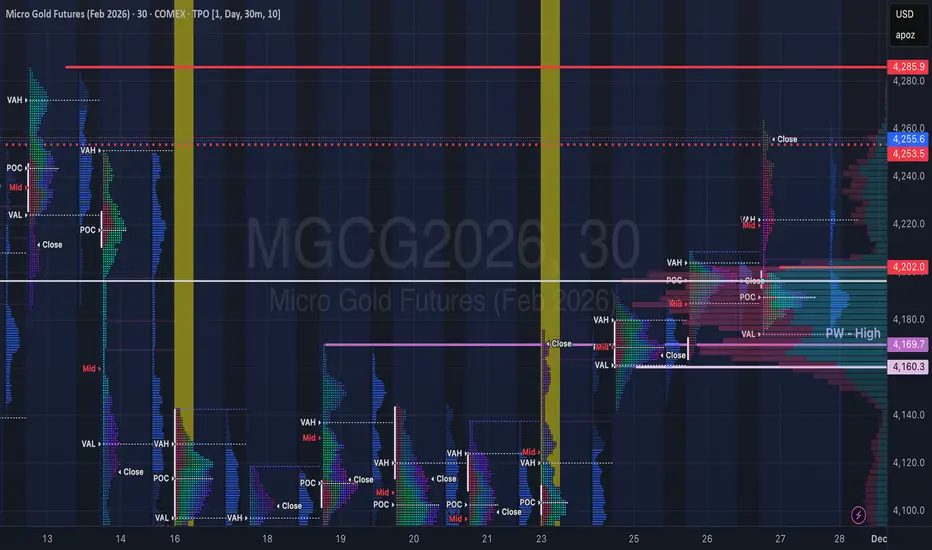
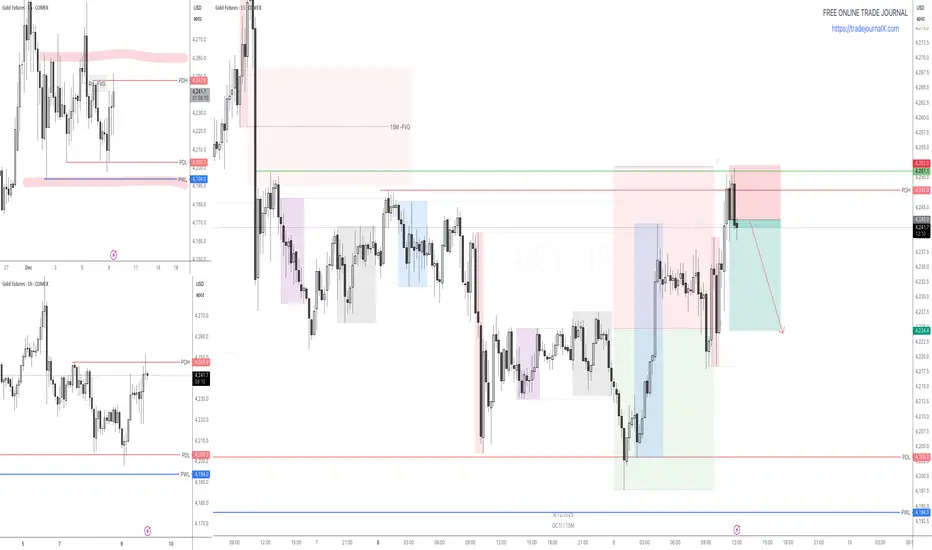
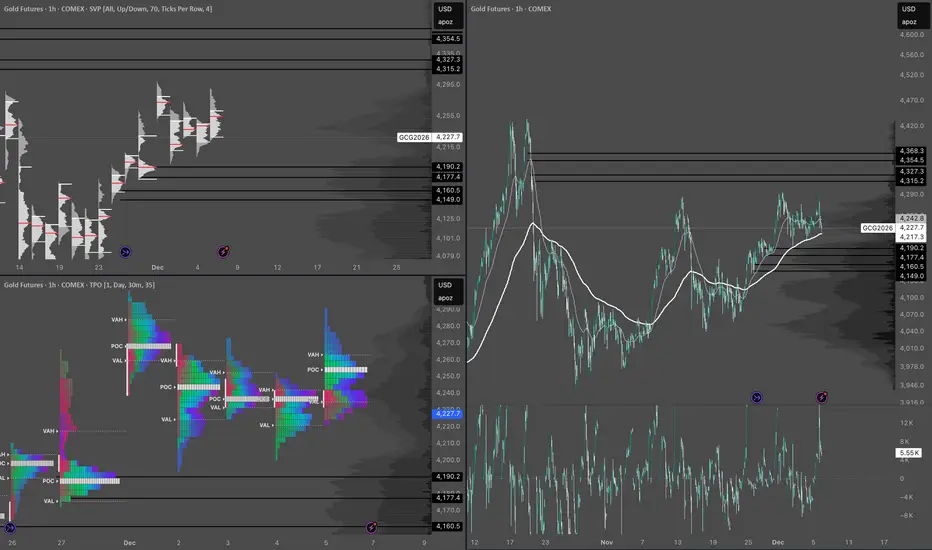
Gold Outlook – Key Levels I’m WatchingThese are the zones I’m currently expecting on gold. If price continues to move lower, those are the areas I’ll be watching for potential long entries. I’m noticing relatively high volume in the lower region, which suggests the market feels comfortable operating within those levels.
However, in the upper zones, volume drops significantly, indicating we are outside the fair value area. In these regions, you don’t need heavy market buy volume to move the price, which implies volatility is likely to increase once price returns there.
Gold Value Rotation & Lack of ConvictionFOREXCOM:XAUUSD COMEX_MINI:MGCG2026 COMEX:GC1!
Traders. Context update for the remainder of the week.
Market Context (The Rotation):
The auction has rotated back into yesterday's Value Area and POC (Point of Control).
• The Driver: This move was primarily driven by mechanical short covering rather than initiative buying.
• The Problem: There is no evidence of "new money" (OTF) entering the market to sustain a directional trend. The auction is simply balancing.
Structure & Inventory:
• Balancing: Price is chopping between the GEX levels (Gamma levels), finding acceptance around the 4244 POC.
• Momentum: Stalled. The market is waiting for a catalyst from the Dollar (DXY), which is currently consolidating at lows.
• Behavior: Every breakout attempt is failing to find follow-through, confirming a mean-reversion environment.
Plan & Execution:
Given the lack of conviction, I am not looking for trend trades this week.
• Stance: Range Bound / Two-Way Trade.
• Tactics: Fade the edges of the balance. Expect price to remain tethered to the POC until new information enters the market.
Talk to you for the next update.
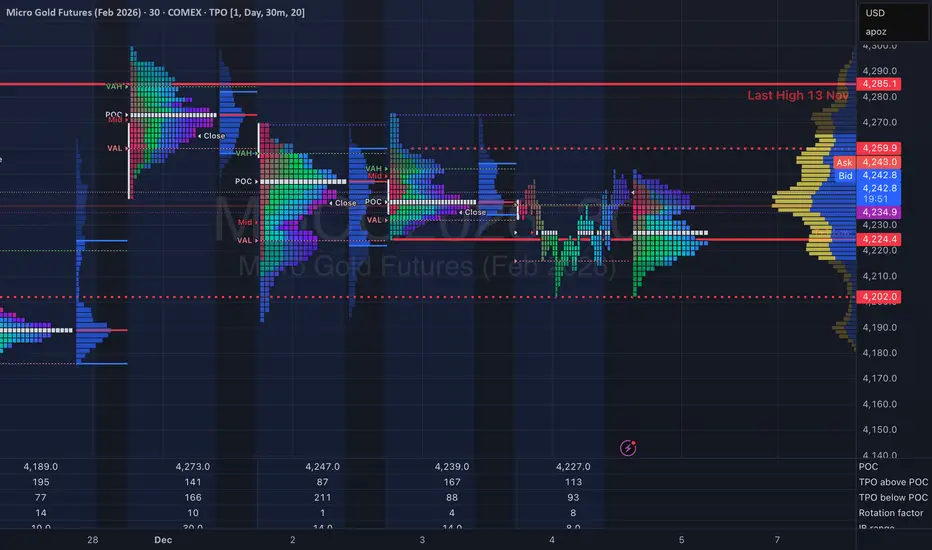
Balancing Range & The 4190 PivotCOMEX:GC1! COMEX_MINI:MGCG2026 FOREXCOM:XAUUSD
Traders. Update on the current auction structure.
Market Context (No New Money): We have yet to see any "New Money" or Initiative Buying enter the market. Yesterday developed as another Balance Day, capped by some late-session liquidation.
The Reality: The auction remains range-bound between 4,290 (High) and 4,190 (Low). Without a fresh catalyst, price is simply rotating within this established bracket.
Structure & Key Levels:
Bullish Scenario: If Gold can hold acceptance above Yesterday's Low, the rotation favors a re-test of the upper distribution around 4,260 – 4,270 later this week.
Bearish Scenario: The line in the sand is 4,190. A breakdown and acceptance below this level changes the context significantly, likely dragging the auction down to repair the November Balance Area (~4,100).
Plan:
Stance: Neutral / Range Trading.
Execution: Fading the extremes of the 4290-4190 range until we see a breakout with volume confirmation.
Talk to you for the next update.
