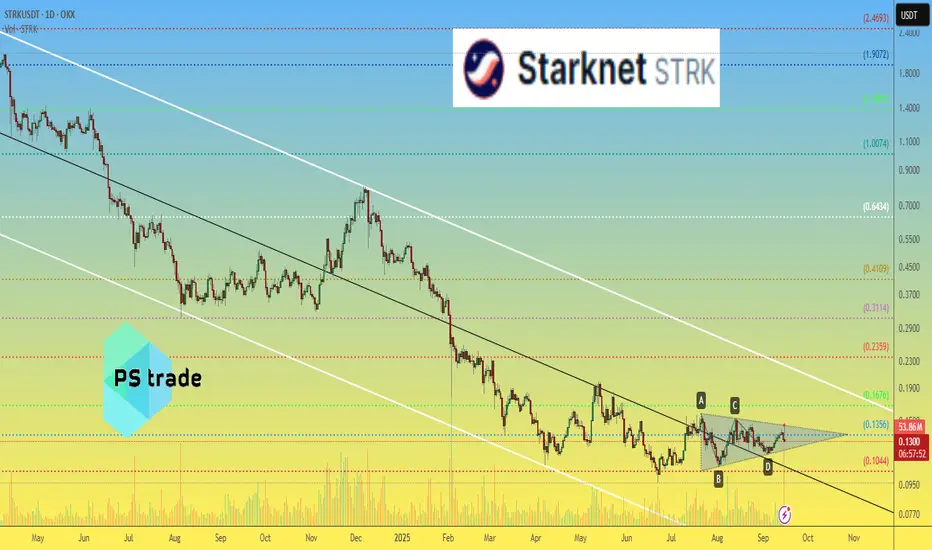
STRKUSDT 1D#STRK is moving within a symmetrical triangle on the daily chart. Enter this coin only if it breaks out above the triangle and the daily SMA200. If that happens, the potential targets are:
🎯 $0.1571
🎯 $0.1759
🎯 $0.1946
🎯 $0.2214
🎯 $0.2555
If the triangle breaks to the downside, it could retest the
Related pairs

$STRKPUMP Token Slumps, Leads Meme Coin Losses: Pump.fun’s native token, PUMP, recently slumped, leading losses among meme coins like Dogecoin, PEPE, and BONK, as the market stumbled.

StarkNet STRK price analysisWe have to admit, the “disappointment” price of #STRK is now stuck in consolidation — but this looks like it’s heating up for a breakout 📈
Today we even saw an attempt to push higher, but it got stopped right at the upper edge of the triangle ⛔️
Let’s make it interactive: looking at this chart, wha
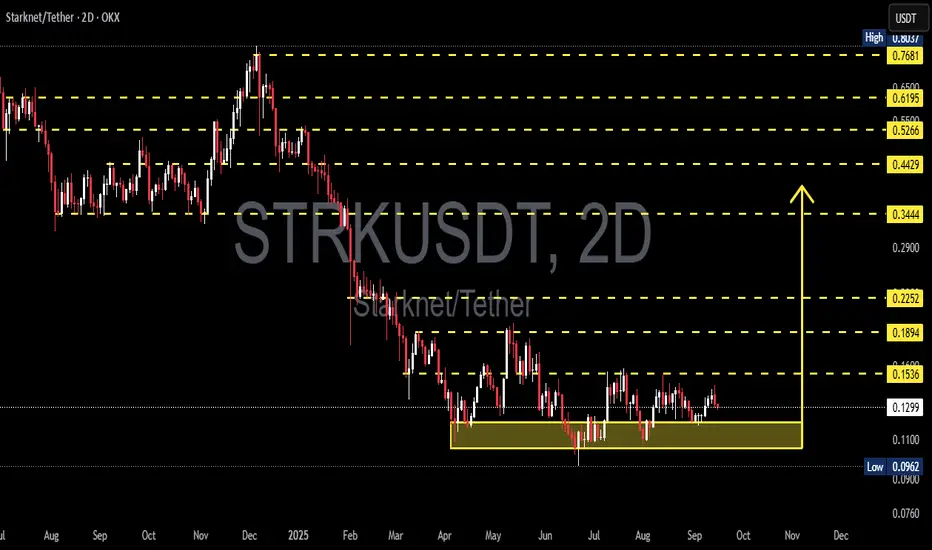
STRK/USDT — Bottom Accumulation: Beginning of a Major Reversal?
🔎 Overview
The STRK/USDT (2D) chart is showing a consolidation phase after a heavy downtrend since early 2025. Price is currently trading around 0.1299, hovering just above a key support zone at 0.096–0.11 (yellow box) which has been tested multiple times and continues to hold.
This structure res
STRKUSDTAccording to the previous analysis and the density and floor formation visible on the chart,
With the trend break and consolidation above it, the entry trigger is activated and we can expect at least 50 to 70 percent growth for this currency.
If you have any comments and views, please share them wit

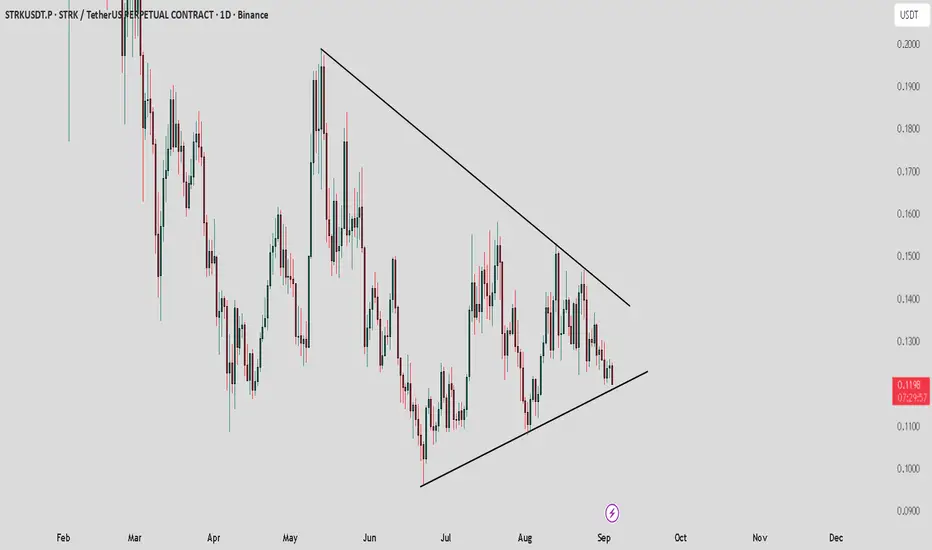
STRK /USDT : Holding support and bouncing to approach resistanceSTRK/USDT is holding strong support and climbing toward the $0.13 resistance.
A breakout above this resistance could open the way for a bullish rally toward $0.20. Keep a close watch for confirmation.
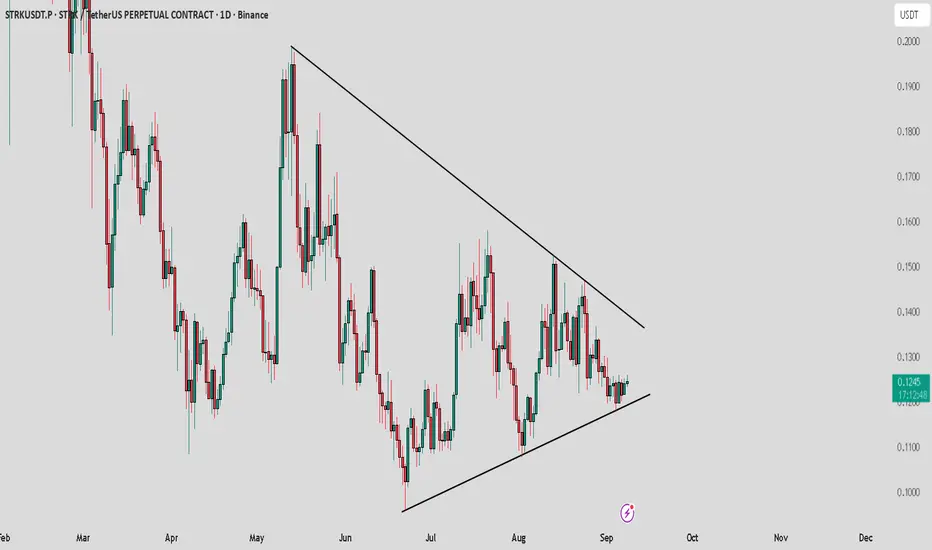
STRK / USDT : Near to support of symmetrical triangleSTRK/USDT is trading near the support of the symmetrical triangle.
Bullish scenario: If support holds, price could bounce toward the resistance at $0.13.
Bearish scenario: A breakdown from this support may drag price toward $0.096.
Always wait for confirmation before entering. Manage risk properl
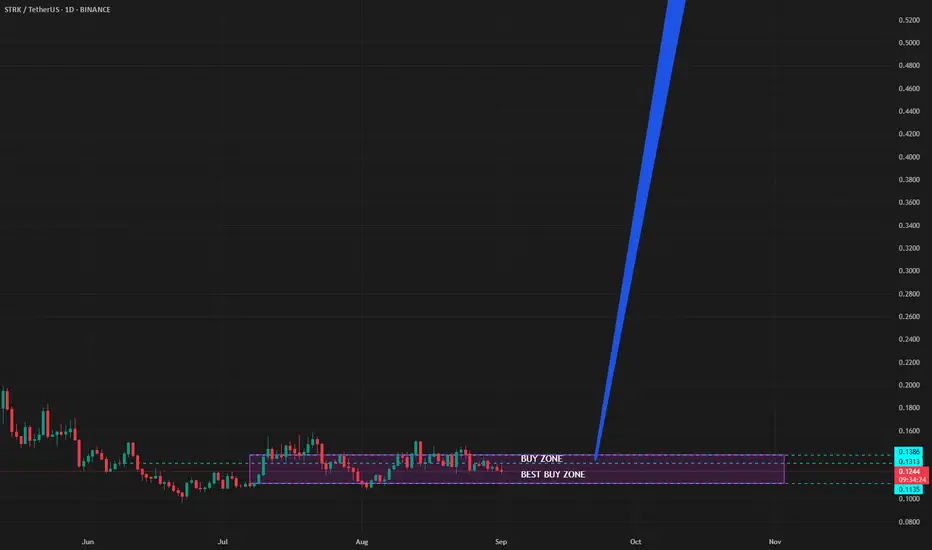
STRK/USDT – Key Buy Area & AccumulationSTRK is currently in an accumulation phase within a strategic Buy Zone, showing clear absorption after the recent correction.
Within this range, a Best Buy Zone is identified, representing the most efficient point to enter before the next bullish impulse.
The technical structure suggests that the n
STRK / STRKUSDTSAY Hiii...
GOOD LUCK >>>
• Warning •
Any deal I share does not mean that I am forcing you to enter into it, you enter in with your full risk, because I'll not gain any profits with you in the end.
The risk management of the position must comply with the stop loss.
(I am not sharing financial or

STRK Main Trend 12 04 2025Time frame 1 week for clarity.
Descending channel is the main trend.
Descending wedge is a secondary trend.
Showed the mid-term percentage for targeting potential profit within the channel after breaking through the wedge.
The price reached the lower zone of the descending channel of the main tr

See all ideas
Summarizing what the indicators are suggesting.
Oscillators
Neutral
SellBuy
Strong sellStrong buy
Strong sellSellNeutralBuyStrong buy
Oscillators
Neutral
SellBuy
Strong sellStrong buy
Strong sellSellNeutralBuyStrong buy
Summary
Neutral
SellBuy
Strong sellStrong buy
Strong sellSellNeutralBuyStrong buy
Summary
Neutral
SellBuy
Strong sellStrong buy
Strong sellSellNeutralBuyStrong buy
Summary
Neutral
SellBuy
Strong sellStrong buy
Strong sellSellNeutralBuyStrong buy
Moving Averages
Neutral
SellBuy
Strong sellStrong buy
Strong sellSellNeutralBuyStrong buy
Moving Averages
Neutral
SellBuy
Strong sellStrong buy
Strong sellSellNeutralBuyStrong buy
Displays a symbol's price movements over previous years to identify recurring trends.
Frequently Asked Questions
The current price of STRK / UST (STRK) is 0.11609000 USDT — it has fallen −6.03% in the past 24 hours. Try placing this info into the context by checking out what coins are also gaining and losing at the moment and seeing STRK price chart.
STRK / UST price has fallen by −15.61% over the last week, its month performance shows a −7.25% decrease, and as for the last year, STRK / UST has decreased by −73.47%. See more dynamics on STRK price chart.
Keep track of coins' changes with our Crypto Coins Heatmap.
Keep track of coins' changes with our Crypto Coins Heatmap.
STRK / UST (STRK) reached its highest price on Feb 20, 2024 — it amounted to 3.10890000 USDT. Find more insights on the STRK price chart.
See the list of crypto gainers and choose what best fits your strategy.
See the list of crypto gainers and choose what best fits your strategy.
STRK / UST (STRK) reached the lowest price of 0.09919000 USDT on Jun 22, 2025. View more STRK / UST dynamics on the price chart.
See the list of crypto losers to find unexpected opportunities.
See the list of crypto losers to find unexpected opportunities.
The safest choice when buying STRK is to go to a well-known crypto exchange. Some of the popular names are Binance, Coinbase, Kraken. But you'll have to find a reliable broker and create an account first. You can trade STRK right from TradingView charts — just choose a broker and connect to your account.
Crypto markets are famous for their volatility, so one should study all the available stats before adding crypto assets to their portfolio. Very often it's technical analysis that comes in handy. We prepared technical ratings for STRK / UST (STRK): today its technical analysis shows the sell signal, and according to the 1 week rating STRK shows the sell signal. And you'd better dig deeper and study 1 month rating too — it's sell. Find inspiration in STRK / UST trading ideas and keep track of what's moving crypto markets with our crypto news feed.
STRK / UST (STRK) is just as reliable as any other crypto asset — this corner of the world market is highly volatile. Today, for instance, STRK / UST is estimated as 7.41% volatile. The only thing it means is that you must prepare and examine all available information before making a decision. And if you're not sure about STRK / UST, you can find more inspiration in our curated watchlists.
You can discuss STRK / UST (STRK) with other users in our public chats, Minds or in the comments to Ideas.