CSCO with trailing stopBig pictrue of fundamental analysis and technical analysis. market is on a way down, fear is extraordinary
Write sometning about your psyhology thinking before trade? stable, to much food
Describe the trade. What you see? there were complex head and shoulders and now looks like a first pullback
Write why you want to enter the trade in this point? pullback
What have I done well for this trade? trailin stop was good at that case
What can I take away to help with later trades? nothing
Trade ideas

CISCO Systems SHS is still playing out!After braking the supportline late february we went down quite hard. Then we saw a relief wave up but with a very clear bearish reversal at the RSI. Be very careful with your longs guys!

"Cisco: the down move continues" by ThinkingAntsOkWeekly Chart Explanation:
- Price broke the Ascending Trendline.
- Price broke the first Support Zone (Resistance Zone now) and is on a correction (pullback) to it.
- Expect price to continue the down move towards the two next Support Zones.
Daily Vision:
Updates coming soon!

"Cisco: short move coming" by ThinkingAntsOk4H Chart Explanation:
- Price broke the Ascending Trendline.
- Price broke the Support Zone (now Resistance Zone).
- Expect price to move down towards the next Support Zone.
Weekly Vision:
Daily Vision:
Updates coming soon!

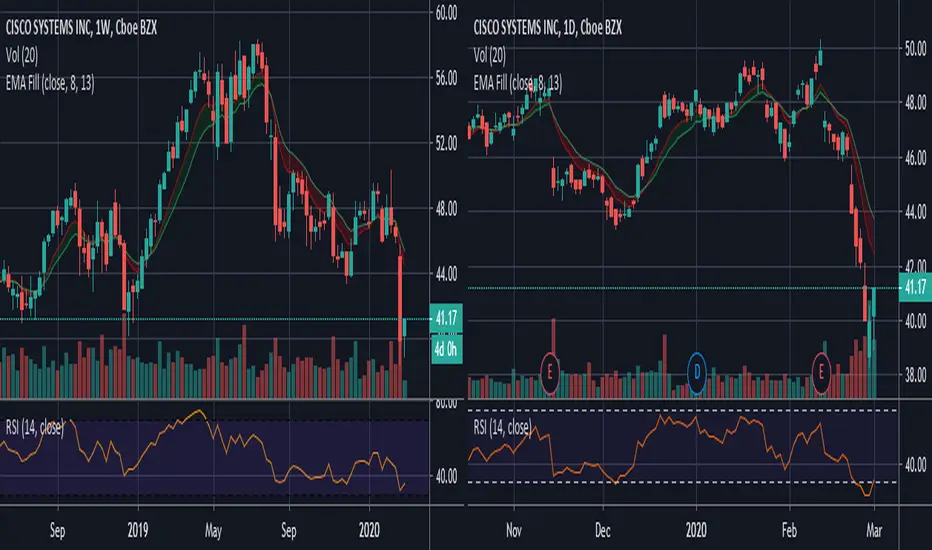
CSCO - Time to take a shot?CSCO had lowest closing weekly RSI since 2001 and I think this is disconnected from other big tech. It did not have nearly the run that the FAANGs have had and never made it back to its 2000 highs. In fact it is now trading at the 2007 peak before it and the market started deteriorating in late 2007. Pessimism is rampant and I expect that the weekend will bring about more doom and gloom thinking. Worst week in the market since October 1987 which in hindsight turned out to be an incredible buying opportunity. I'm not calling a bottom, but when you see high quality companies trading down 30-40%, if you're saving for retirement then shoring up your portfolio with quality is a smart thing to do. I want to be in KO's and CSCO's of the world.

CSCO with trailing stop very soon. Made a little profitBig pictrue of fundamental analysis and technical analysis. market is today bullish
Write sometning about your psyhology thinking before trade? i think that investor will cool down during the weekend
Describe the trade. What you see? try to
Write why you want to enter the trade in this point? market very down
What have I done well for this trade? manageing the trade
What can I take away to help with later trades? this is the good manaeging

$CSCO is good for correlation trading nowCorrelation trading strategy idea analysis.
The market is going between the freshly formed and confirmed support&resistance levels.
So there is a very good opportunity for correlation trading.
I showed my vision of correlated moves in my previous ideas.
Now I am going to introduce another stock for correlation trading.
Cisco has big enough weight in the S&P 500, so correlation predetermined to be good.
Look on the $SPY and $CSCO charts.
Actual corresponding support&resistance levels look so much alike.
Correlation is good enough to expect future similar moves.
Following the correlation trading strategy, it is reasonable to wait for correlated level breaking.
When $SPY and $CSCO simultaneously break their resistance levels, it will be possible to buy $CSCO.
When $SPY and $CSCO simultaneously break their support levels, it will be possible to short $CSCO.
Do not view this idea as a recommendation for trading or investing. It is published only to introduce my own vision.
Always do your own analysis before making deals. When you use any materials, do not rely on blind trust.
You should remember that isolated deals do not give systematic profit, so trade/invest using a developed strategy.
If you like my content, you can subscribe to the news and receive my fresh ideas.


Some S&P stocks could close month below 200 weekly averageAs February draws to a close today, markets have taken a swift and decisive beating. Some stocks that comprise the S&P index look (Boeing, Cisco, etc.) look like they could close below the 200-period weekly moving average (MA), coloring them bearish. The S&P is currently at or near Support 1 (S1). With some stocks pinned below the weekly MA, index recovery prospects seem modest at best. Bond prices have been bid up, making bond returns comparatively low. The desired outlook for March is if prices make back some of the losses. Recovering 50% of losses by mid-June would be ideal. But it is still a good idea to hedge against uncertainty brought about by the shakedown.


Cisco Stock Will Full Down Cisco Stock Will Full Down.
**Disclaimer** the content on this analysis is subject to change at any time without notice, and is provided for the sole purpose of assisting traders to make independent investment decisions.

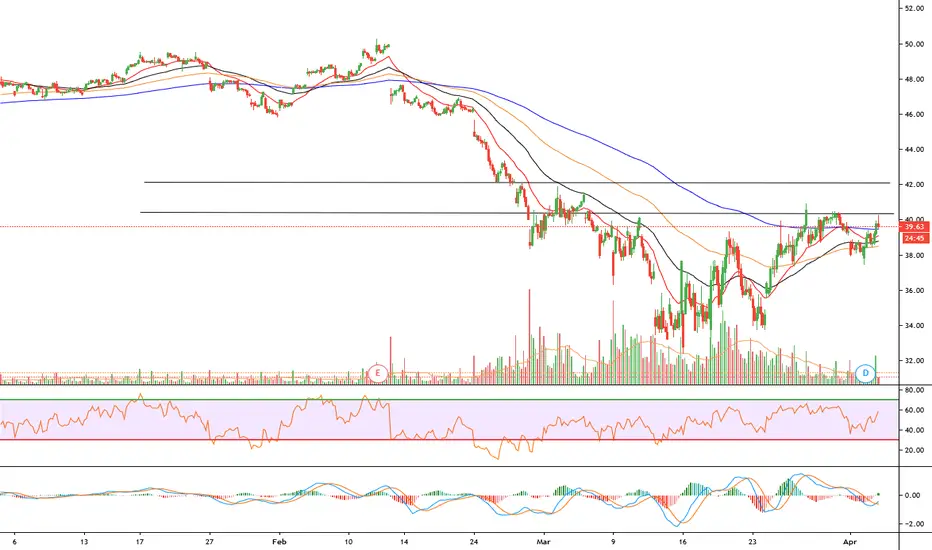
CSCO - Cup and Handle formingI see:
A bottom punched in Dec 5th, 2019
A lower high Jan 31st, 2020, confirmed today
Established parallel channel running diagonally up
A trajectory that would put it near highs just before next Earnings, allowing it to cool off and let ER dictate which direction is next.


$CSCO long, bounce from earnings drop, strong seasonal playNASDAQ:CSCO - long, 90% seasonal bullish play, looking for move to mid line of bullish parallel channel

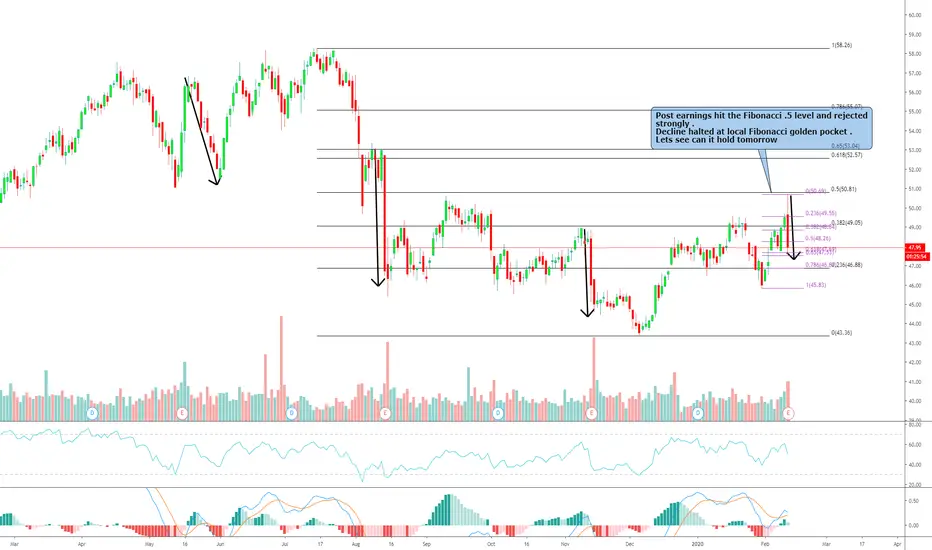
Cisco should have known better
Should have saved my optimism for a different stock, once again the stock can
not hold any gains post earnings, lets see what tomorrow brings.
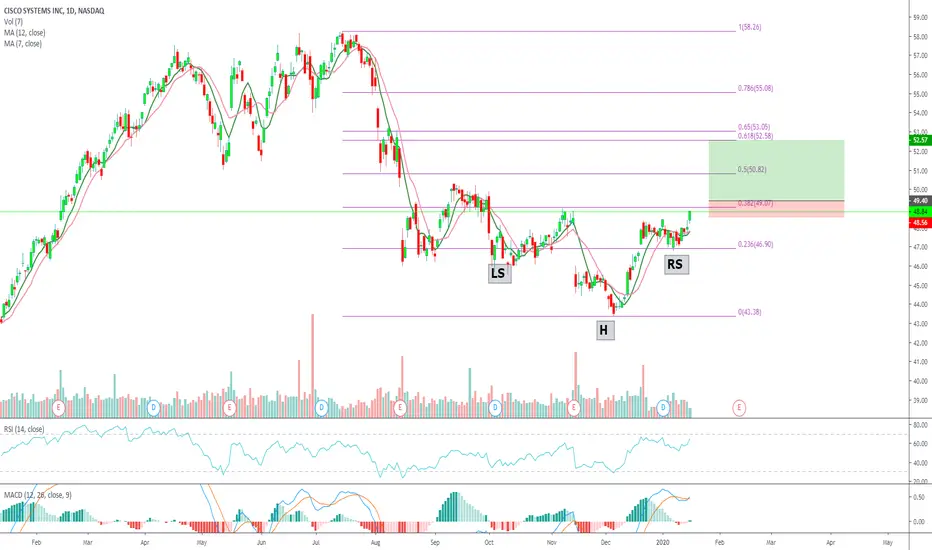
Cisco Systems Long trade into earnings $csco
Possible inverse Head & Shoulders forming.
Bullish moving average crossing
RSI in strong reversal.
Target price $52.56
Stop loss $48.68
Entry dependent on market action

CSCO Struggles to Complete BottomThe CSCO earnings report did not improve the stock price. The stock is still working on what is now an intermediate-term bottom. Volume is average.

CSCO in In 2nd wave or already in 1st of 3rd LONGCSCO seems to be in 2nd, ready for 1st of 3rd wave of 5 LONG

CSCOPossible head & shoulders forming? *Should* make its way down to the neckline over the next month or 2. Price rejected monthly 20 sma.

Cisco looks bullish
Possible inverse head & shoulders developing
May have been overly pessimistic with outlook.
7&122 moving averages crossing bullish.
MACD and histogram bullish reversal.
RSI in strong uptrend.
Market sentiment bullish.
CSCO Stock Strong area Jan 2020Happy New Year to y'all!
We expect CSCO's shares to reach the resistance at 50 (Strong area + psychological area) and re test or fall to 45 USD with side movements until uptrend or downtrend momentum.
If you buy a price market you need to put a nearby Stop Loss (less than 1USD) 'cuz the target it's about 2 USD per share
