DXY - second area LONG DXY - second area LONG , this is second zone for long, use risk and trade managmnet
Market insights

DXY may sell off from or above 98.77With rate cut, as expected DXY as created new lower low. The gap resistance at 99.32 has been tested and price finally managed break the trend line with FOMC realse.
Daily price opened with gap, which in currently retesting the swing high and possible rejection at 98.77 or above after a false breakout can lead the market to go futher lower to 97.84 or below.

Dollar Outlook 2026The FOMC Just Set the Tone for 2026 — And Markets Are Underpricing What Comes Next
By Ozkar Meyssen
The December FOMC meeting was more than just another policy update. It was a structural pivot — the type of meeting that sets the tone not for the next quarter, but for the next several years of global macro and FX pricing.
While headlines focused on the Fed’s acknowledgment that inflation is unlikely to fall back to 2% in the near term, the deeper takeaway was far more important: Chair Powell is shifting his reaction function toward supporting the labor market — and that implies a more aggressive easing path ahead.
And right now, markets are not fully pricing that trajectory.
Powell’s Messaging: The Fed Is Preparing to Cut Further
Powell struck a nuanced but unmistakable tone:
He acknowledged inflation is still above target,
but treated it as a secondary concern.
He highlighted that U.S. GDP remains strong,
but dismissed it as a constraint on easing.
And most importantly:
he emphasized the labor market as the critical area requiring policy attention.
A Fed focused on unemployment is a Fed preparing to stimulate. And the primary tool for stimulating the labor market is clear:
Cut rates — repeatedly and sooner rather than later.
Powell reminded markets that the Fed has already delivered 75 bps of cuts over the last three months and — notably — suggested that this easing cycle is likely to continue because it “will help the economy.”
This is not the language of a reluctant central bank.
This is the language of a Fed preparing the market for a longer, deeper easing path.
Markets have not fully internalized this yet.
Political Pressure Is Now A Market Driver
Just hours after the meeting, President Trump openly criticized the Fed, calling it “stupid” for not cutting 50 bps on the spot.
Central banks maintain independence — in theory.
In practice, political pressure matters, especially when tied to unemployment concerns and election timelines. Trump’s commentary adds an additional layer of downward bias to the dollar because:
It frames aggressive cuts as the “expected” political baseline.
It increases the likelihood that Powell will lean more dovish to avoid public conflict.
It pressures markets to price a steeper easing curve.
This dynamic strengthens the dovish impulse already emerging from the FOMC.
What Markets Are Currently Pricing (And Why It’s Too Shallow)
Before the meeting, markets had only one rate cut priced in for 2026.
After this meeting?
That expectation is almost certainly too low.
Between Powell’s focus on unemployment, the ongoing cuts already delivered, and overt political pressure, the logical repricing is for multiple cuts in 2026 — not a single, isolated move.
When rate expectations shift, FX markets follow.
And that sets up a major dollar downtrend into 2025–2026.
FX Outlook: The 2026 Dollar Repricing
Based on the macro impulse from this FOMC meeting, here is the directional bias and the levels that now come into play:
EUR/USD → 1.20 (Mid-2026)
A structurally weaker dollar combined with a stabilizing European inflation cycle gives EUR/USD room to extend higher into its multi-year range ceiling.
GBP/USD → 1.35367 (Next Several Months)
The pound benefits from relative rate stability and improved UK data momentum. If U.S. easing accelerates, GBP becomes one of the cleanest anti-USD trades.
DXY → 98.00 (Early 2026)
A move back into the pre-2021 range is consistent with a soft-landing scenario and multiple Fed cuts. This is the key psychological level that aligns with broader macro structure.
USD/CAD → 1.30928 (Late 2026)
Canada’s balanced policy stance and stable growth path give CAD a durable advantage as U.S. yields drift meaningfully lower.
What This Really Means for Traders and Investors
This is not a short-term reaction trade.
This is a macro repricing — the kind that unfolds over months and quarters.
I will be positioning into these levels, not chasing them. Patience is required, and data will dictate timing — but the framework is clear:
The Fed just opened the door to a multi-year easing cycle.
Markets are underpricing it.
The dollar will adjust.
These are predictions, not guarantees, and macro conditions evolve. But the structural direction is now defined, and this FOMC meeting was the inflection point.

DXY BULLISH SETUPAfter a complete 5 wave bearish move, the dxy bounced in a leading diagonal pattern which signifies a wave A. Now wave B is still in formation and we patiently waiting for a pivot around 50%fib into wave C , which should last a few months

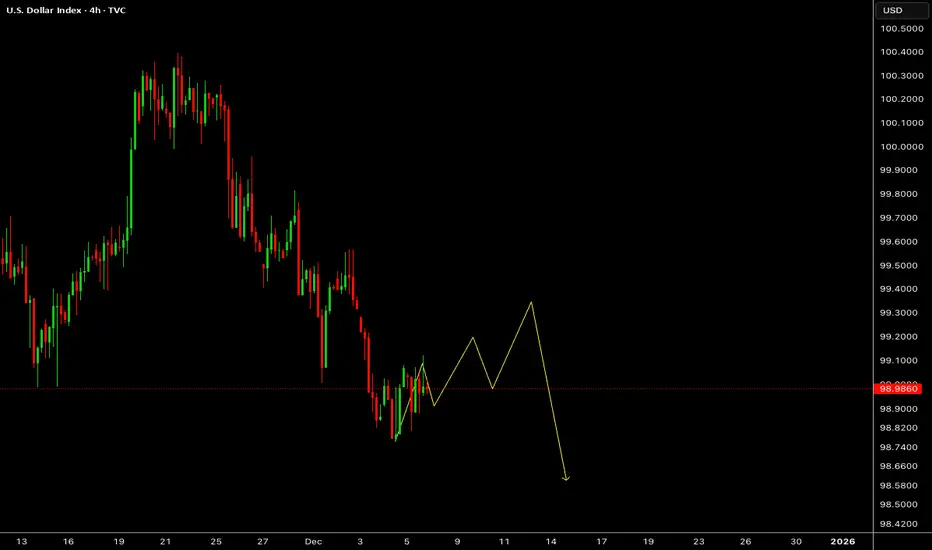
Dollar Index analysisThe Dollar Index was gaining some momentum and looked like it might finally break the 100 resistance after a long time, but it got rejected again. On the 4-hour timeframe, we can see a clean range that hit the top and got rejected.
Right now, it’s stuck around the midline of the channel, and there’s a high probability it will reach the bottom of the channel. This, in turn, will provide a bullish signal for both the Euro and gold.

Bullish bounce reversal?US Dollar Index (DXY) is falling towards the pivot and could bounce to the 1st resistance, which has been identified as an overlap resistance.
Pivot: 97.66
1st Suport: 97.17
1st Resistance: 98.97
Disclaimer:
The opinions given above constitute general market commentary and do not constitute the opinion or advice of IC Markets or any form of personal or investment advice.
Any opinions, news, research, analyses, prices, other information, or links to third-party sites contained on this website are provided on an "as-is" basis, are intended to be informative only, and are not advice, a recommendation, research, a record of our trading prices, an offer of, or solicitation for, a transaction in any financial instrument and thus should not be treated as such. The information provided does not involve any specific investment objectives, financial situation, or needs of any specific person who may receive it. Please be aware that past performance is not a reliable indicator of future performance and/or results. Past performance or forward-looking scenarios based upon the reasonable beliefs of the third-party provider are not a guarantee of future performance. Actual results may differ materially from those anticipated in forward-looking or past performance statements. IC Markets makes no representation or warranty and assumes no liability as to the accuracy or completeness of the information provided, nor any loss arising from any investment based on a recommendation, forecast, or any information supplied by any third party

Meet the Market’s New Bully: DXYLadies and gentlemen, if you think the neighbor’s kid who screams from dawn till dusk is the most annoying thing in the world, you’re dead wrong—you clearly haven’t wrestled with the Dollar Index (DXY) yet...
In this analysis, we’re going to tame this screaming little monster together and hunt down its triggers side by side.
I’m Skeptic , founder of Skeptic Lab . If you want to elevate your long-term performance through genuine psychology, data-driven insights, and proven strategies, you’ve landed in the right spot.
Let’s kick off with the daily timeframe:
We’ve been trapped in a massive consolidation box for ages. A decisive break of either the ceiling or the floor could spark a proper long-term daily trend. We had a solid uptrend trendline that just got smashed downward, and right now we’re sitting smack on the midline of this bigger box.
If that midline cracks lower, expect a straight shot down toward the key support floor at 96.455. On the flip side, a bounce here makes a ceiling retest very much on the table—and honestly, the odds of an upside break look higher if we get that reaction.
Now drop to the 4H timeframe:
After snapping the upward trendline to the downside, we’ve printed lower highs and lower lows—LWC is officially BEARISH, so our bias is SHORT. We got a strong reversal candle reaction off support at 98.098 , which looks like a seriously important zone. Right now, we’re rejecting hard from resistance at 98.548 , engulfing a bunch of those prior green candles—plenty of fuel to drive us straight to the lows.
Short trigger: Clean break and close below 98.098 support.
For longs, I’d much rather see us first punch through 98.548 to the upside, then confirm real momentum on the next leg up. Why? LWC is bearish, and with both HWC and MWC stuck ranging, the lower timeframe carries way more weight right now.
That’s it :) thanks for sticking with this idea. If it helped, I’d really appreciate a BOOST to keep the momentum going and a follow to grow our community. Drop any symbol you want analyzed in the comments, and I’ll get to it. 🩵
Now get outta here.

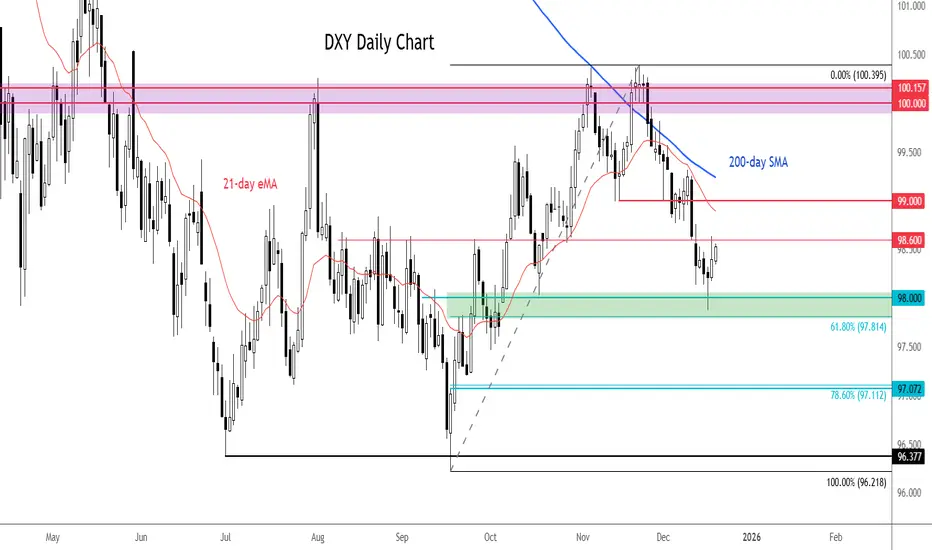
Dollar index levels to watch ahead of CPI, ECB and BOJAhead of today's release of US CPI and the upcoming rate decisions by the ECB and BOJ, the dollar index has stabilised slightly this week, although the broader picture remains one of consolidation with a downside bias.
The failure to break above the 100.00–100.40 resistance zone in November — an area that also capped gains in August — reinforced a pattern of lower highs and lower lows.
Since then, the index has broken below former support at 99.00 and 98.60, both of which now act as near-term resistance. As long as price remains below these levels, downside risks remain dominant despite recent stabilisation.
Initial support sits around 98.00, close to the 61.8% Fibonacci retracement at 97.81. A sustained break lower would expose the 97.00 level, with the next key support zone around the July–September lows near 96.20–96.40. Overall, rallies continue to look corrective unless the index can reclaim 99.00 decisively.
By Fawad Razaqzada, market analyst with FOREX.com
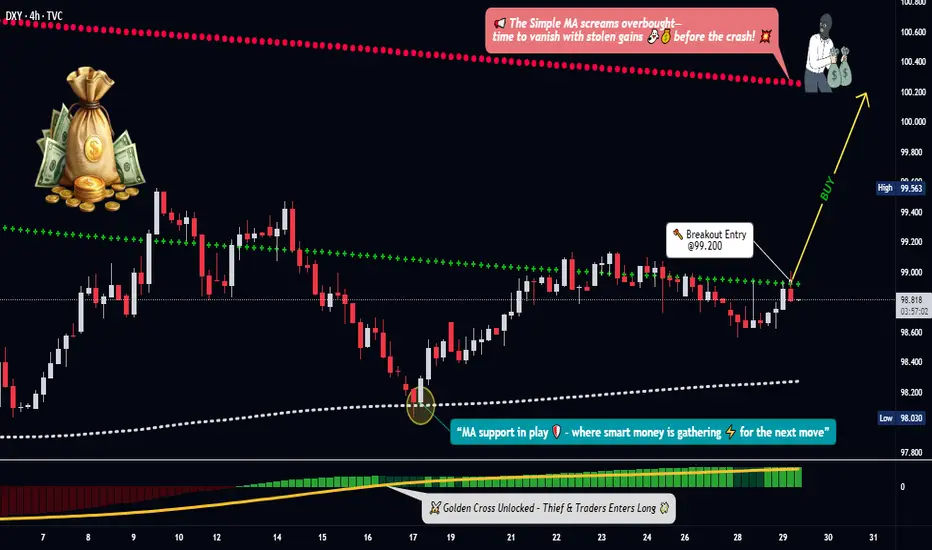
DXY Breakout Map — Is the Dollar Index Ready for a Power Move?🎯 DXY BULLISH BREAKOUT: The "Limit Order Layup" Strategy 🚀
Hey Thief OGs! 👋 The King Dollar 👑 is getting ready for a potential rally, and we've got the map 🗺️ to navigate it. This is a swing/day trade plan focusing on a classic technical setup with a tactical entry twist.
📈 The Overall Plan (Bias): BULLISH 🐂
The strategy waits for a bullish confirmation using a Simple Moving Average (SMA) pullback 🔙 followed by a MACD golden cross ✨. We're buying the dip, expecting a continuation upward 📊.
⚡ The Thief's Entry Tactic (The "Layering Method") 🎁
The key is patience and precision. We don't chase the price.
✅ Wait for the Trigger: Confirm a daily close ABOVE 99.200.
🎯 Deploy Limit Orders: After the breakout, set multiple buy limit orders at key support levels to get a good average entry price.
Suggested Layers: 🟢 98.400, 🟢 98.600, 🟢 98.800, 🟢 99.000
💡 Pro Tip: You can adjust the number of layers and levels based on your own risk appetite!
🛡️ Risk Management (The Escape Plan) 🚨
Stop Loss (SL): A hard stop is placed at 98.200. This level is the line in the sand – if price breaks below here, our thesis is likely invalid ❌.
⚠️ Note: Dear Ladies & Gentleman (Thief OGs), I do not recommend you set only my SL. It is your own choice. You can make money, then take money at your own risk.
🎯 Profit Targets (The Getaway) 💰
Take Profit (TP): We are targeting 100.200. This zone aligns with where the Moving Average may act as strong resistance, and the market could become overbought. When the trap is set, we escape with profits! 🏃♂️💨
⚠️ Note: Dear Ladies & Gentleman (Thief OGs), I am not recommending you set only my TP. It is your own choice. You can make money, then take money at your own risk.
🔍 Related Pairs to Watch & Key Correlations 🌐
The DXY doesn't move in a vacuum. Keep an eye on these:
EUR/USD ( FX:EURUSD ): 👑 The inverse king. A rising DXY typically means a falling EUR/USD 📉.
GBP/USD ( FX:GBPUSD ): Similar to the Euro, a strong dollar often pressures Cable downward 📉.
Gold ( OANDA:XAUUSD ): 🪙 Gold is priced in USD. A stronger dollar can make gold more expensive for other currencies, often putting downward pressure on it 📉.
USD/JPY ( FX:USDJPY ): A strong dollar trend usually powers USD/JPY higher 📈.
Key Point: If our DXY bullish idea is correct, you should generally see EUR/USD and GBP/USD weakening 📉, and USD/JPY strengthening 📈.
✨ “If you find value in my analysis, a 👍 and 🚀 boost is much appreciated — it helps me share more setups with the community!”
#DXY #TradingSetup #SwingTrading #Forex #DollarIndex #TradingStrategy #MACD #TechnicalAnalysis #LimitOrder
DOLLAR THE dollar index on daily TF found a strong support and its holding firmly ,the year candle could be green for dollar index,
the structure despite the pull back from the current all time high remains bullish and such price action will affect some of the pairs trading against the dollar.
we will watch EURUSD,AUDUSD,GBPUSD,USDZAR,USDJPY for possible reversal price action.
the dollar is standing on positive support structure from the chart as illustrated.
the next layer of resistance will be 100$ zone ,if buyers bridge this zone they could reclaim 103 hopefully before the end of the year.
trading is 100% probability and risk management is key.
GOODLUCK.

Price action Dxy still showing signs of weakness currently creating a reversal pattern the last order block not tested usd is still weak

DXY Bullish BiasBullish on DXY for now. Mitigation on OB that had the upward move. Am bullish on USD/XXX pairs

DXY Steady as Markets Brace for a “Hawkish Cut”DXY Steady as Markets Brace for a “Hawkish Cut”
The US Dollar Index (DXY) is trading around the 99.00 level as the market waits for the upcoming Fed decision.
Although the dollar has attempted to recover in recent sessions, momentum has slowed as traders prepare for what could be a “hawkish rate cut” — a scenario where the Fed cuts rates but signals a cautious or firm stance on future policy.
Most of the expected 25 bps rate cut is already priced in.
From a technical perspective, DXY has already broken out of the downward channel, and if bullish pressure continues, the index may aim for the short-term target at 99.50, followed by 100.00.
Let’s see how the market reacts as volatility picks up around the FOMC announcement.
You may find more details in the chart!
Thank you and Good Luck!
❤️PS: Please support with a like or comment if you find this analysis useful for your trading day❤️

12/12/2025 - Daily ForecastAnalysis of FX:EURGBP
Watch list for today:
FX:EURGBP
FX:AUDUSD
OANDA:XAUUSD

DXY | Fed Cut Day Inside an Ascending Channel – What’s Next?The Fed is widely expected to deliver another 25 bps cut today, taking the funds rate down toward the 3.75–4.00% range – the third step lower this year. Markets seem more focused on Powell’s tone and the new dot plot than the cut itself, with a lot of debate inside the FOMC about how fast to ease from here.
Technical Lens:
On the 1H chart, DXY is grinding higher from the 99.00 area in a neat ascending channel. Price is mid-structure for now, with the upper channel boundary aligning broadly with the prior supply zone around 99.50–99.70, while the lower channel line and recent swing lows cluster just under 99.00 as short-term support.
Scenarios:
Scenario A – Hawkish-leaning cut (USD bullish):
If Powell leans hawkish despite the cut – stressing “data dependence,” limited room for aggressive easing, and concern about still-sticky inflation – DXY could hold the lower half of this channel and work its way toward the upper boundary and that 99.50–99.70 resistance area.
Scenario B – Dovish surprise / guidance (USD bearish):
If the statement and dots signal a quicker or deeper easing path, or Powell sounds comfortable with looser financial conditions, DXY might lose the channel support (a clean break below ~99.00), opening room for a push back toward the recent lows beneath the structure.
Catalysts:
FOMC rate decision & statement
Updated SEP/dot plot
Powell’s press conference Q&A, especially comments on growth risks vs. inflation risks
Takeaway:
I’m using this little ascending channel as my decision zone: hold the lower bound with hawkish-ish messaging and DXY can keep grinding higher toward 99.50–99.70; lose the channel on a dovish surprise and the downside opens back up.

THE DAILY DOLLAR UPDATE — FOMC VOLATILITY WINDOWThe U.S. Dollar enters today’s session under a clear volatility regime. FOMC sits at the center of the macro landscape, and the market is positioning early.
The dominant behavior is not directional aggression. It is information gathering. The Dollar is being pushed toward the weekly discount zone near 98.175, where a known liquidity pool sits. This is not organic weakness — it is deliberate positioning.
Order flow confirms this intent. Absorption shows up consistently at the .6–.7 Fibonacci bands, indicating institutions are unloading inventory into premium while sentiment remains fragile. Retail sees a slowing trend. Professionals see asymmetric preparation around a major macro catalyst.
Market Structure (MSM)
Internal bearish structure remains intact. Selling continues to dominate the internal leg, and structure is guiding price toward the weekly discount zone. No bullish regime shift is confirmed, and the architecture remains clean on the higher timeframes.
Dynamic Geometry (DGM)
Despite bearish pressure, the Dollar still trades inside an overpriced bullish dynamic condition relative to the weekly and daily POVs. This creates geometric tension: structure wants discount, geometry remains stretched in premium. When those two conflict, liquidity usually resolves the argument.
Volume Flow (VFA)
The next major volume POC sits in the mid-range and aligns directly with the liquidity low. Participation is not accumulating at highs; it is preparing to rotate downward. Volume acceptance at lower prices would confirm this shift, but for now, the market is in transition.
Order Flow Dynamics (OFD)
Order flow today is absorbed at premium levels. Large participants are distributing into the upper bands rather than allocating fresh long exposure. Sweeps are small, deliberate, and designed to clear short-term positioning across both sides of the range.
Precision Execution (PEM)
The broader downtrend remains intact. Deviations stay negative. These are traditionally favorable conditions for Dollar sells and cross-market rotations into strength.
However, execution must respect the macro backdrop. FOMC, year-end flows, and reduced liquidity can distort intraday structure. Stops must sit behind higher-timeframe pivots. Patience is discipline in a news-driven environment.
Macro Calendar — United States
• FOMC Statement
• Fed Rate Decision
• Press Conference with Chair Powell
• High-volatility window expected pre- and post-announcement
CORE5 Identity Line
We do not react to movement. We interpret intention.
Takeaway
The Dollar is not collapsing; it is being positioned. FOMC will determine who read the behavior correctly.
— CORE5DAN
Institutional Logic. Modern Technology. Real Freedom.
DXY - long, first RADXY - long, first RA , is a simple trade, will take some days, use riskk and trade managment for best result

DXY: Bearish Structure Confirmed After Fed’s Dovish Shift“DXY confirms a bearish structure after breaking below the mid-term ascending channel. Yesterday’s Fed rate cut and the unexpectedly dovish tone acted as a catalyst for a decline that was already visible in the chart through weakening momentum and a series of lower highs on the H4 timeframe.
Price is trading below the 20/50 EMA on both H1 and H4, keeping short-term order flow bearish. As long as DXY remains under the 104.20–104.40 supply zone (the origin of the last impulsive drop), bearish continuation remains the primary scenario toward 103.10 and 102.70 liquidity levels.
The news didn’t create the trend — it simply accelerated a technical breakdown that was already in motion.”

DXY- A Move Is Loading…The U.S. Dollar Index is showing signs of a shallow corrective move within a broader weakening structure. Short-term upside attempts may remain limited while the overall flow continues to favor the downside, with a potential continuation once this correction concludes.
**Disclosure:** We are part of Trade Nation's Influencer program and receive a monthly fee for using their TradingView charts in our analysis.
DAILY DXY IDEAprice has tapped a key demand level and is showing a clean rebound toward the mid-range.
The first upside magnet sits around those highlighted arrows and horizontal$ and so forth if momentum holds before Christmas 25th.
Structureee stays bullish while price holds above 99.200. a clean break below that level opens the path back toward 97.95
lets break bread...

DXYU.S Dollar Index
- Rising Wedge as an corrective pattern in Long Time Frame
- Order Block
- Fibonacci Level - 50.00% / 61.80%
- Demand Zone
- Completed " 1234 " Impulsive Waves

Major Volatility Incoming – The Most Important News of 2025**“Tomorrow’s U.S. interest rate decision is one of the most critical events of 2025, with the potential to shape market direction across all major asset classes. The Federal Reserve’s stance on rates will directly influence liquidity, risk sentiment, and overall market volatility.
A higher-than-expected rate would strengthen the dollar, increase borrowing costs, and typically pressure risk assets such as Bitcoin, equities, and commodities. On the other hand, a rate cut or a dovish outlook could trigger a strong risk-on reaction, supporting upward momentum in crypto and other high-beta assets.
This announcement is especially important because markets are currently at key technical levels. The reaction to tomorrow’s decision will likely determine whether ongoing downtrends are coming to an end or if another wave of rejection and continuation to the downside is ahead.
Traders should anticipate elevated volatility both before and after the release. Managing risk is essential, as sudden price spikes and liquidity gaps are common during major FOMC events.”**

Dollar Index Has Fallen to Its Lowest Level in Almost 1.5 MonthsThe Dollar Index Has Fallen to Its Lowest Level in Almost 1.5 Months
The key event of the week will take place on 10 December – at 22:00 GMT+3 the FOMC will publish its interest rate decision, followed half an hour later by a press conference with Jerome Powell.
As the chart of the dollar index (DXY) shows, the US dollar is weakening as the event approaches, reflecting market sentiment – the rate is expected to be cut by 25 basis points due to pressure from Trump and a cooling labour market. This underpins the bearish trend that has been in place since late November.
A reminder that on 24 November we:
→ highlighted the importance of resistance around 100.20 points;
→ and constructed a system of two trend channels.
Since then, the price has moved lower within the descending channel, and:
→ new swing points have allowed us to refine the channel boundaries;
→ a large bearish double-top pattern (A–B) has formed on the chart above the psychological level of 100 points.
The dollar index chart indicates that selling pressure is dominant (as shown by the arrows):
→ the lower boundary of the ascending channel has switched its role from support to resistance;
→ a similar role reversal has occurred at the 99.11 level.
Today, the DXY index is near the lower boundary of the descending channel. It is reasonable to assume that in the short term:
→ the market will enter a wait-and-see mode ahead of the news;
→ a consolidation zone may form on the chart, supported by the lower boundary of the red channel.
Be prepared for surges in volatility on the currency markets on Wednesday evening.
This article represents the opinion of the Companies operating under the FXOpen brand only. It is not to be construed as an offer, solicitation, or recommendation with respect to products and services provided by the Companies operating under the FXOpen brand, nor is it to be considered financial advice.
