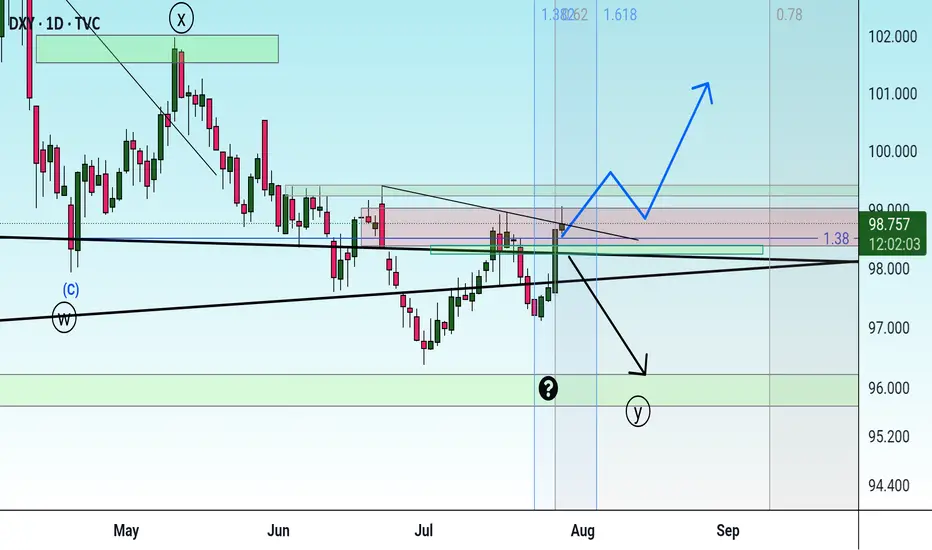
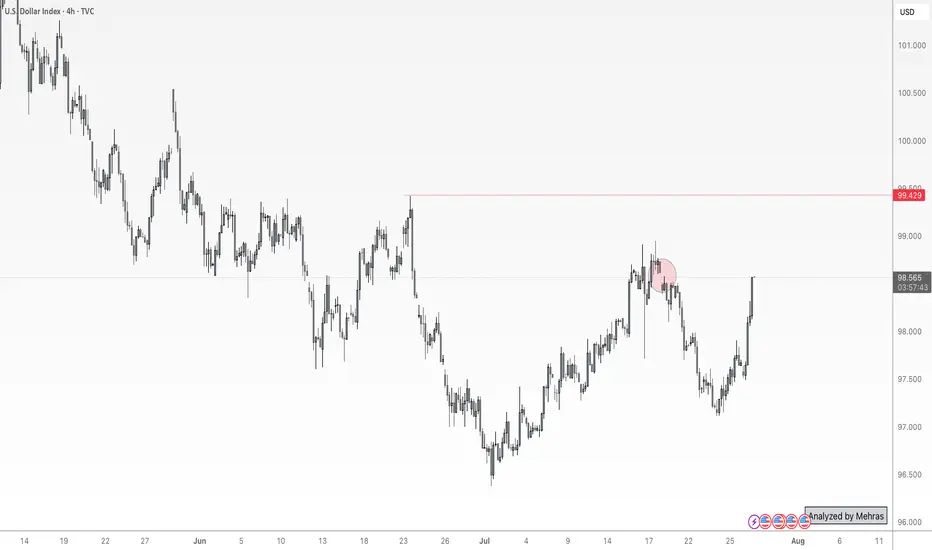
DXY (US Dollar Index)After breaking out of the downtrend and successfully testing the previous resistance level following the breakout from the Falling Wedge, the US Dollar Index looks poised for upward movement. This could temporarily slow down crypto due to dollar strength. 💵
July was nice, but August has historically been the worst month of the year — and we need to be prepared for that.
DX.F trade ideas

DXY Goes 98.200 and then Bullish The DXY GOES 98.200 IN 1H OB then we see again dxy is bullish and next target is 99 to 100.

DXY Buyers Catching BidSee chart for analysis but even with price sitting inside levels of supply, we could easily see stronger Fundamentals coming out to drive this dollar back up into 100.5 areas of monthly supply. Short-term I remain bullish with long term views to the downside.

THE DOLLAR INDEX HAS FINALLY BROKEN THE DOWNWARD TRENDLINETVC:DXY (Dollar Index) has been in massive downward trend from the beginning of the year 2025 which was very bad for the Dollar. as from the previous weeks, we have been seeing the dollar index making some significant moves is very interesting as this will cause pairs like USDJPY to start pumping as well, because USDJPY is correlates positively with DXY why pairs like EURUSD,GBPUSD AND GOLD will be dropping. As a matter of fact let's see close the daily candle above the current.resistance level before anticipating for any massive move.
NOTE: THIS IS NOT A FINANCIAL ADVICE DO YOUR RESEARCH.
FOLLOW ME FOR MORE UPDATES.

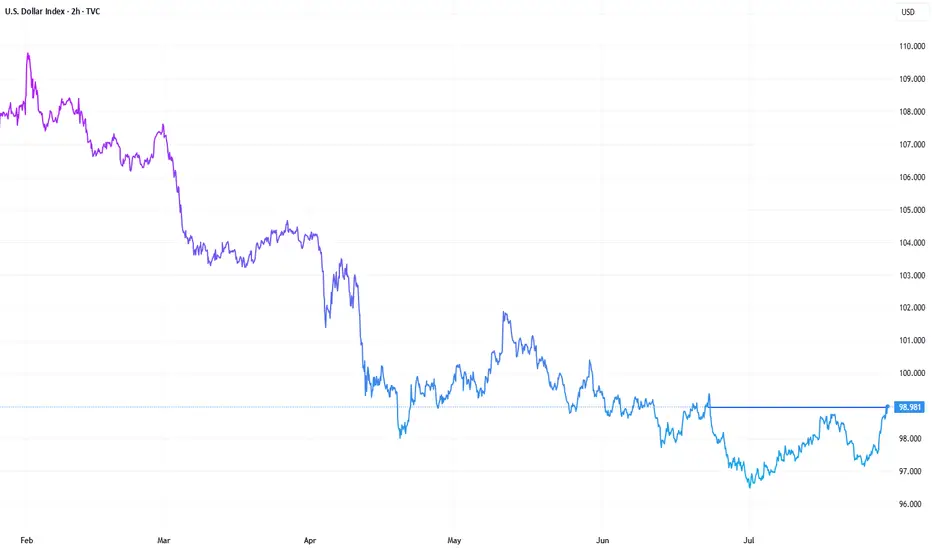
Dollar is bullish Price was previously bearish, formed an inverse head and shoulders pattern. Broke out of the neckline. Wait for retest in combination of a bullish candlestick pattern and long.

US Dollar Index: Down YTD, But at a 5-Week HighThe U.S. dollar plays a leading role in the performance of U.S. stocks versus international stocks. The greenback endured its worst first-half performance since 1973, helping ex-U.S. equities post massive absolute and relative gains through June. But could the narrative be shifting? And what might it mean for investors?
The U.S. Dollar Index (DXY) sits at a five-week high ahead of the July Federal Reserve interest rate decision and the key July jobs report to be released on August 1. Up four sessions in a row, the dollar appears poised to post its best month since last December (in fact, the DXY's first positive month of 2025). If it’s the start of a protracted recovery, then the “U.S. exceptionalism” trade could be back in vogue over the second half, resulting in the same old story of U.S. over international in the stock market.
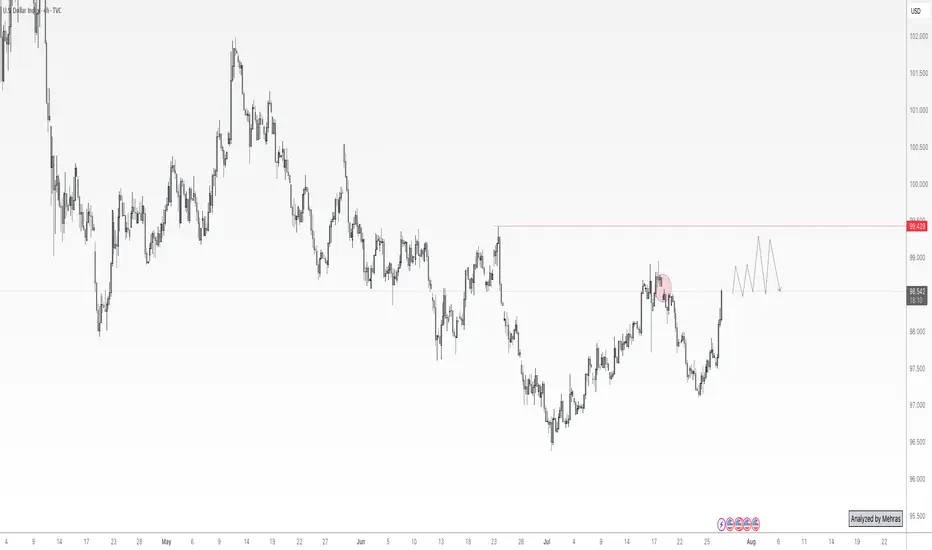
Possibility of uptrend As long as the indicator is above the green resistance zone and the resistance trend line is not consolidated, the continuation of the downtrend is likely. If the strong indicator breaks through the mentioned resistance zone, a long-term uptrend will be formed.

US Dollar Index (DXY) Reaches One-Month HighUS Dollar Index (DXY) Reaches One-Month High
The US Dollar Index (DXY) has risen to its highest level since early July. According to media reports, the bullish sentiment in the market is driven by the following factors:
→ Optimism around US trade agreements. A new trade deal with the EU — which includes a 15% tariff on European goods — is being perceived by the market as favourable for the United States.
→ Confidence in the resilience of the US economy. Strong Q2 corporate earnings have acted as an additional bullish catalyst. Investors may have started covering short positions against the dollar, viewing concerns over a US slowdown as overstated.
→ Expectations that the Federal Reserve will keep interest rates on hold.
From a technical standpoint, today’s DXY chart reflects strengthening bullish momentum.
Technical Analysis of the DXY Chart
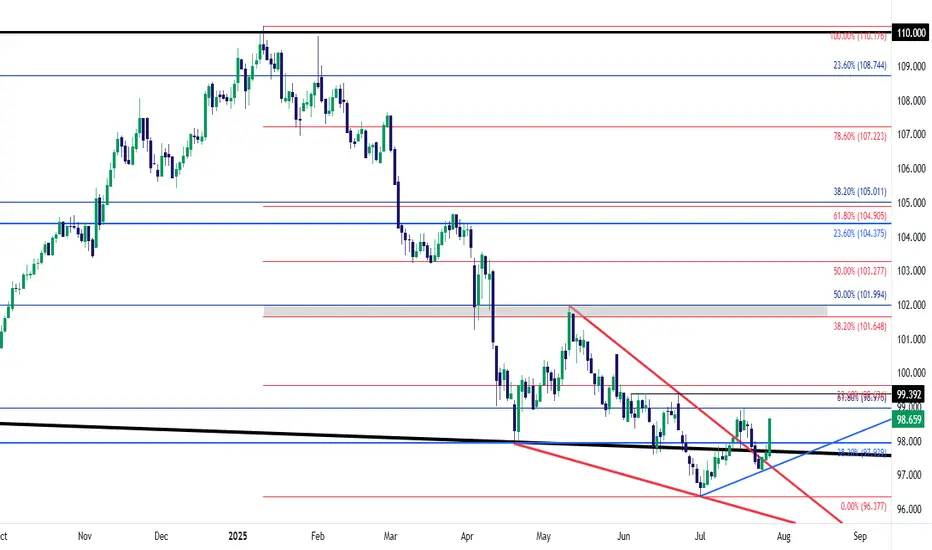
Two U-shaped formations (A and B) that developed over the summer have created a bullish сup and рandle pattern — a formation that suggests waning bearish pressure, as evidenced by the shallower second dip.
This setup points to the potential for a bullish breakout above the trendline (marked in red) that has defined the downward movement in the DXY throughout the first half of 2025.
As previously analysed, there are signs that the dollar index may have found a base following a period of decline. This could indicate a shift in market sentiment and the possible end of the recent bearish phase.
This article represents the opinion of the Companies operating under the FXOpen brand only. It is not to be construed as an offer, solicitation, or recommendation with respect to products and services provided by the Companies operating under the FXOpen brand, nor is it to be considered financial advice.
DOLLAR INDEX U.S. Dollar Index (DXY) and US 10-Year Treasury Yield
Dollar Index (DXY) — will reclaim 103-102 level if it crosses 100 mark currently is at 98.34 and faces immediate supply roof ,a make or break situation awaits dollar buyers .
Over the past month, the Dollar Index has gained about 2%, although it is still down over 5% compared to a year ago. The recent uptick follows a period of volatility and selling, with investors recalibrating expectations after the resolution of trade risk premiums and recent U.S.–EU trade deals.
US 10-Year Treasury Yield keep rising after its drop from 4.193% in early july to 4.5% on 17th
Yield on the US 10-year Treasury note is currently about 4.42% , modestly higher than last week and unchanged from the previous session.
Current levels reflect ongoing uncertainty regarding future Federal Reserve policy moves, cautious optimism regarding U.S. economic strength, and some abatement of safe-haven flows after recent global trade developments.
Relationship & Market Synopsis
DXY and the 10-year yield typically have a positive correlation: When Treasury yields rise, the dollar often follows, as higher yields make dollar-denominated assets more attractive to global investors. Conversely, falling yields can weigh on the dollar. However, in 2025, there have been periods of divergence due to external shocks and policy uncertainty.
Current setup: Both DXY and the 10Y yield are rising modestly, signaling a shift to a more constructive tone for the U.S. dollar as risk sentiment stabilizes and investors scale back some safe-haven trades. Recent U.S. economic resilience and fading tariff fears have reduced the need for defensive flows, supporting both yields and the dollar.
Forward outlook: Market consensus expects limited further upside for Treasury yields unless there are strong surprises in U.S. data or Federal Reserve communication. The DXY is projected to stabilize near current levels or drift higher on persistent U.S. economic momentum.
Summary:
Both the Dollar Index and US 10-year Treasury yield are modestly higher as of July 29, 2025. Their positive price action reflects improving US growth prospects, reduced global risk premiums, and recalibrated market expectations on Fed policy. While their relationship is generally positive, periods of divergence have occurred in 2025 due to trade, policy, and economic shocks. Currently, both are showing moderate gains as investor sentiment stabilize

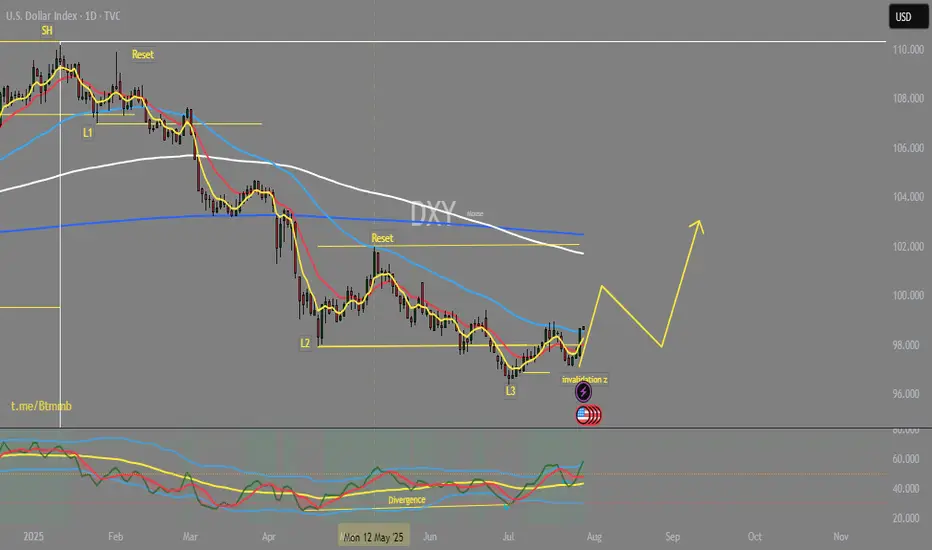
DOLLAR RECOVERYIt is been so down from begin of this year almost and now it is a time for the bulls to catch some breath. The cycle show that we are in the reset phase after the three levels down, which is gonna last until August 15 where we expect another fall.
Will DXY Get Supported With Fresh US-EU Trade Agreement?Macro approach:
- The US dollar index has traded mixed since last week, pressured by lingering trade uncertainty and cautious market sentiment ahead of major economic events.
- Dovish Fed expectations and subdued US inflation continued to weigh on the greenback, while news of a fresh US-EU trade agreement and upcoming talks with China contributed to two-way price action.
- Economic data reflected a resilient labor market but flagged moderating US growth, with investors closely watching forthcoming GDP figures and the Fed's policy stance.
- The US dollar index may remain range-bound as markets await catalysts, including the Fed meeting, the 2Q GDP release, and key labor market data.
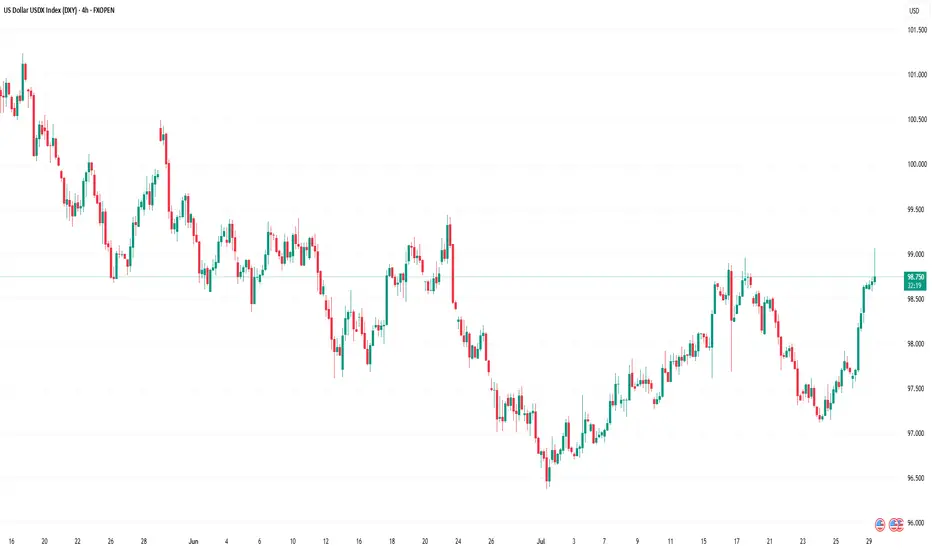
Technical approach:
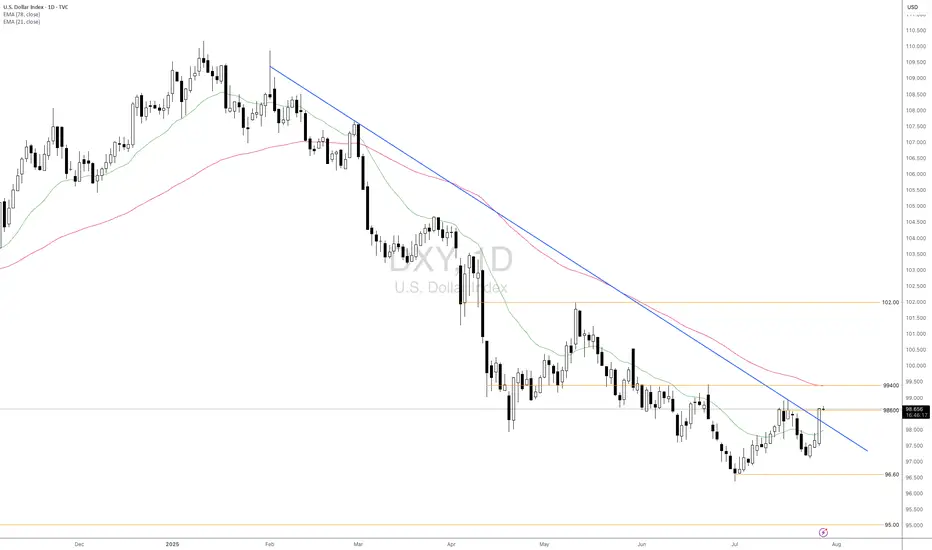
- DXY surged and closed above the descending trendline and the resistance at around 98600, indicating an early signal of a shift in the market trend.
- If DXY maintains above 98600, it may retest the following resistance at 99400, confluence with EMA78.
- On the contrary, closing below the descending trendline and EMA21 may prompt a retest of the swing low at 96.60.
Analysis by: Dat Tong, Senior Financial Markets Strategist at Exness
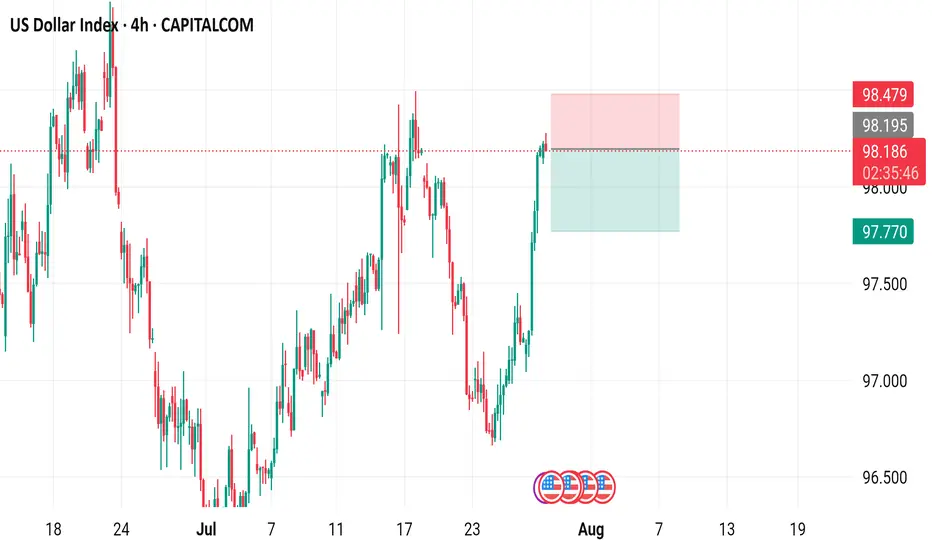
US Dollar Index (DXY) - 4 Hour Chart4-hour chart from CAPITALCOM displays the recent performance of the US Dollar Index (DXY), showing a current value of 98.190 with a slight decline of 0.009 (-0.01%). The chart highlights key price levels, including a recent sell signal at 98.189 and a buy signal at 98.243, with a resistance zone marked between 98.195 and 98.479. The index has experienced fluctuations, with notable drops and recoveries, and is currently trending near the 98.190 level as of July 29, 2025.
IS A HIGHER LOW SECURED ON THE DXY? LET'S FIND OUTIn this weekend analysis, I am still paying attention to the higher time frame downtrend on the dollar index while acknowledging the higher low support on the daily chart forming an inverse Head and Shoulders pattern. On the 4H and lower timeframes we have a strong ceiling made up of the 200SMA and 50SMA resistance level and need to break through from the 20SMA Line in the sand support. This weeks trade plan and thesis is for price to hold above the 20 SMA on the 4H timeframe expecting a potential dip to the zone of 97.128 (liquidity zone) and then bounce up to a weekly target of 97.7. This Thesis is INVALIDATED if a candle opens and closes below 97.015. I wish everyone a great trading week. Thank for supporting my publications and trade ideas. Cheers!!!

DXY LOCAL SHORT|
✅DXY is going up now
But a strong resistance level is ahead at 98.948
Thus I am expecting a pullback
And a move down towards the target of 98.451
SHORT🔥
✅Like and subscribe to never miss a new idea!✅
Disclosure: I am part of Trade Nation's Influencer program and receive a monthly fee for using their TradingView charts in my analysis.


DXY dont take these charts serious its just my way to keep myself entertained while finding levels etc.. no your usual boring systematic shiiiteee!! IRISH CRAIC ONLY!!! ☘

USD Rallies into a Major Week - Fed, PCE, NFP on the WayReversals of long-term moves can be tough to work with, especially for shorter-term traders.
While fundamentals are important for shaping future price moves and technicals are key for explaining past moves, while also allowing for strategy and risk management, it's sentiment and positioning that probably matter more.
Because if any and everyone in the world that wants to be long already is, well it doesn't matter how positive the news is if there's simply nobody left to buy. And if there's no influx of fresh demand, and only incoming supply, well, then price can drop, even on good news. And at that point, a heavy one-sided market will take notice of falling prices even in the face of good news, when price should be going up, and they'll be disconcerted to hold long positions, which can lead to even more supply, more selling, and in-turn, lower prices.
As the old saying goes, if a market doesn't rally on good news, well then look out below.
This shows in various ways on varying time frames in numerous markets but from a longer-term perspective, that shifting trend is akin to turning a cruise ship in the middle of the ocean - it's not going to happen suddenly. It takes time, it takes shifting, and it takes the slow grind of late-to-the-trend bulls turning into ahead-of-the-curve sellers.
This is what allows for the build of wedges, just as I had looked at earlier in the month in both USD and EUR/USD. Bulls suddenly get shy as prices approaches highs, although they remain aggressive on pullbacks and tests of support. This leads to a weaker trendline atop the move and, eventually, unless buyers get motivated to punch up to higher-highs with a new breakout, that motive for profit taking can soon take over.
In the USD, the sell-off in the first half of this year was a grinding matter, and the polar opposite of the trend that had held in DXY as we came into 2025. But, now the question is whether resilient US data leads to profit taking from bears and as we saw again last week, sellers have been showing lacking motivation at tests of lows or around support.
The big question for this week is whether we see that shift take-hold on a larger basis. We've seen sellers getting shy around lows, but are buyers ready to punch up to fresh highs in the USD? There's certainly ample potential for motivation as given the economic calendar with FOMC, Core PCE and NFP in the final three days of this week. - js
DXY: USD Flexes Muscle - Pairs SlideFriday, July 25, 2025
The foreign exchange markets are experiencing a pronounced USD bullish session this morning, with the US Dollar Index (DXY) showing robust gains of +0.35% while simultaneously pressuring all major currency pairs into negative territory. The Japanese Yen (JPY) is bearing the brunt of this dollar strength, currently registering losses between -0.4% to -0.66% across JPY pairs. This market behavior suggests traders should pay particularly close attention to DXY dynamics, as its movements will likely dictate price action across all major currency pairs in today's session.
Technical Perspective: DXY at Critical Inflection Point
A detailed examination of the Dollar Index reveals several compelling technical factors that market participants should consider:
1. Weekly Demand Zone Reaction
- The DXY has demonstrated a strong rejection from a significant weekly demand area
- The subsequent bullish spike indicates potential continuation of upward momentum
- This price action suggests institutional buyers are defending this key level
2. Commitment of Traders (COT) Report Insights
Non-commercial traders (typically hedge funds and speculators) have increased their positions from a bottom level not seen since June 2021 meanwhile the Commercial traders (often corporations hedging FX exposure) show opposing extreme positioning. This stark divergence between trader categories often precedes significant market moves
3. Seasonal Patterns Favor USD Strength
- Historical seasonal analysis indicates the current period typically supports dollar appreciation
- The combination of technical and seasonal factors creates a potentially powerful bullish setup
✅ Please share your thoughts about DXY in the comments section below and HIT LIKE if you appreciate my analysis. Don't forget to FOLLOW ME; you will help us a lot with this small contribution.

DXY at Its Most Critical Level of 2025 — Will the 100 Bank LevelThe Dollar Index (DXY), just like several other majors, is approaching a very important level. We’re now near the 100 mark, which is not only a psychological level — but also a key institutional (bank) level.
There’s also a gap zone left behind that price is about to fill. I believe the index will stay in a range over the next 1–2 days as it waits for critical data later this week — especially Wednesday’s announcements and Friday’s NFP report, which could set the tone for what’s next.
Based on current market sentiment, Trump’s remarks, Powell’s upcoming speech, and broader macro factors, I believe DXY has the potential to break above 100 and move toward 102–104, if that level is broken cleanly.
Let’s also not forget — price bounced from a monthly demand block near 96, and we’re seeing weak support across majors like EUR and Gold. That adds confluence for potential dollar strength.
📌 What do you think — is dollar strength just around the corner?
🔁 This analysis will be updated whenever necessary.
Disclaimer: This is not financial advice. Just my personal opinion.
Dollar us dxyI think the US dollar will fall sharply, causing a sharp rise in gold. There will probably be a bigger fall than in 2008 in the global economy, especially in the US.

Dyx us dollar I think the US dollar will fall sharply, causing a sharp rise in gold. There will probably be a bigger fall than in 2008 in the global economy, especially in the US.

DXY at Its Most Critical Level of 2025 — Will the 100 Bank LevelThe Dollar Index (DXY), just like several other majors, is approaching a very important level. We’re now near the 100 mark, which is not only a psychological level — but also a key institutional (bank) level.
There’s also a gap zone left behind that price is about to fill. I believe the index will stay in a range over the next 1–2 days as it waits for critical data later this week — especially Wednesday’s announcements and Friday’s NFP report, which could set the tone for what’s next.
Based on current market sentiment, Trump’s remarks, Powell’s upcoming speech, and broader macro factors, I believe DXY has the potential to break above 100 and move toward 102–104, if that level is broken cleanly.
Let’s also not forget — price bounced from a monthly demand block near 96, and we’re seeing weak support across majors like EUR and Gold. That adds confluence for potential dollar strength.
📌 What do you think — is dollar strength just around the corner?
🔁 This analysis will be updated whenever necessary.
Disclaimer: This is not financial advice. Just my personal opinion.