Change in TrendIt seems the DXY is presenting an inverse H&S pattern. Let's give it few weeks to unfold and reveal itself.
Market insights

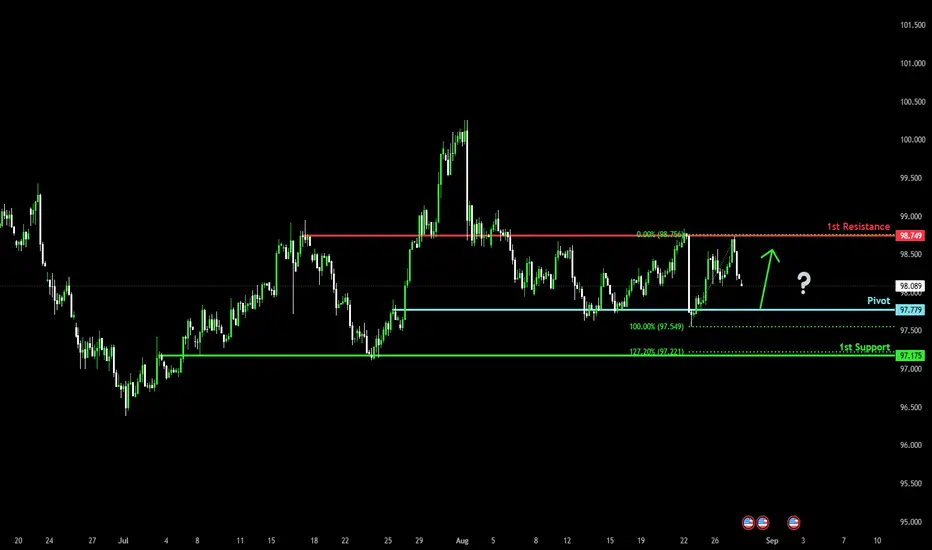
Bullish Bounce off Key Support?US Dollar Index (DXY) is falling towards the pivot and oculd bounce to the 1st resistance.
Pivot: 97.77
1st Support: 97.17
1st Resistance: 98.74
Risk Warning:
Trading Forex and CFDs carries a high level of risk to your capital and you should only trade with money you can afford to lose. Trading Forex and CFDs may not be suitable for all investors, so please ensure that you fully understand the risks involved and seek independent advice if necessary.
Disclaimer:
The above opinions given constitute general market commentary, and do not constitute the opinion or advice of IC Markets or any form of personal or investment advice.
Any opinions, news, research, analyses, prices, other information, or links to third-party sites contained on this website are provided on an "as-is" basis, are intended only to be informative, is not an advice nor a recommendation, nor research, or a record of our trading prices, or an offer of, or solicitation for a transaction in any financial instrument and thus should not be treated as such. The information provided does not involve any specific investment objectives, financial situation and needs of any specific person who may receive it. Please be aware, that past performance is not a reliable indicator of future performance and/or results. Past Performance or Forward-looking scenarios based upon the reasonable beliefs of the third-party provider are not a guarantee of future performance. Actual results may differ materially from those anticipated in forward-looking or past performance statements. IC Markets makes no representation or warranty and assumes no liability as to the accuracy or completeness of the information provided, nor any loss arising from any investment based on a recommendation, forecast or any information supplied by any third-party.
DOLLAR INDEX (DXY)DXY (WEEKLY CHART)
DOLLAR INDEX:
Current rates are clear now in the US. Rates are very close to fair value on the US Treasury market. I’m in the waiting books on this one, another long term year(s) to invest here. Technicals show, there is some sellside liquidity to sweep.
- C.N Skolo
(Journal FX Charts)

Reject from the 98 zone.As we mentioned, the index managed to reach the 98 zone but faced a heavy rejection. Given the current situation of the dollar, it’s very difficult for it to break above 100 unless two or three major news events come in favor of the dollar to give it a push.

DXY Holds Steady, Forming Bullish Wedge Confluence at 100.400"The DXY remains steady, setting confluences for a bullish wedge formation around the 100.400s. This structure suggests potential upward momentum building, with key levels to watch for confirmation of continuation. follow for more insights , comment and boost idea .

DXY BULLISHThe dollar advanced against the euro and sterling on Wednesday but investor concerns over the Federal Reserve's independence continued to linger, potentially limiting the U.S. currency's rise.
The euro
EURUSD
was down about 0.4% at $1.1593 and sterling
GBPUSD
slipped 0.3% to $1.3441, giving back some of the gains spurred by Trump's announcement on Monday that he would fire Fed Governor Lisa Cook over alleged improprieties in obtaining mortgage loans.
Cook's lawyer later said she would file a lawsuit to prevent her ouster, kicking off what could be a protracted legal fight.
Trump's unprecedented bid to remove the Fed Governor adds to the relentless pressure he has put on the central bank to lower interest rates since he returned to the White House this year.

DXY Short Any move up from here is just noise. Divergence on CCI, Macd Histo, TSI and Macd cross down.

Possibility of a drop to 97,800.Given the current situation with the dollar, there is a possibility that it could drop to the mentioned level, and for a bullish move, after reaching 97 we need to see whether it finds support or not.

DXY | 26 AUG – “Risky Countertrend Play”Entry Logic:
Price swept 15M highs → confirmed manipulation ✅
Entered short below liquidity with stops above the sweep.
First target = Asian low (97.93) 🥷
Extended target = 97.83 (daily liquidity pocket) 🎯
⚠️ Note: This is a riskier trade since we’re countering the larger 4H bullish structure and didn’t wait for a clear 1H choch confirmation. Basically a “fade the sweep” type of play.
🔍 My Take:
I actually like this trade, but with caution. We are essentially shorting into higher timeframe bullish orderflow. If DXY respects the 4H premium POI and rolls over, we will catch a clean drive to the downside with great RR.
👉 If it holds above 98.43, though, bulls may squeeze shorts hard and continue higher into 98.57 zone. MUST trail stops aggressively once Asian low is tagged.

DXY Analysis (4H / 6M Outlook)On the higher timeframe (6M), DXY continues to show a bearish scenario with liquidation and further downside pressure. On the monthly chart, a CHoCH formation aligns with the COT reports, confirming continuation of the same narrative we’ve seen in recent weeks.
Looking at the chart, price is rejecting supply zones and struggling to hold above the descending trendline. We could still see one last liquidity grab in the 99.2–99.7 zone before the drop resumes.
My main target remains 97.0–96.5, which could be reached this week or next if the market doesn’t choose to accumulate longer. From there, I would expect a potential retracement towards the 105.0 zone before deciding on longer-term direction.
Keep in mind: with a possible Fed rate cut in the coming weeks, DXY could enter a ranging phase to define its next move toward those key zones.
📉 Bias: Bearish
🎯 Short-term target: 97.0 – 96.5
📌 Possible final liquidity grab: 99.2 – 99.7
📈 Potential retrace: 105.0

Dollar Index (DXY) Bearish Impulse Aims for 97.3The Dollar Index (DXY) displays a bearish sequence with lower lows since its August 1, 2025 peak, signaling further downside. The decline from this high unfolds as a five-wave impulsive Elliott Wave structure. From the August 1 top, wave ((i)) concluded at 98.6, followed by a wave ((ii)) rally peaking at 99.07. The Index then dropped in wave ((iii)) to 97.94, with a corrective wave ((iv)) reaching 98.67. The final leg, wave ((v)), completed at 97.62, marking the end of wave 1 in a higher degree.
A corrective wave 2 emerged as a double three Elliott Wave pattern. From the wave 1 low, wave ((w)) climbed to 98.32, followed by a pullback in wave ((x)) to 97.72. The subsequent wave ((y)) peaked at 98.83, finalizing wave 2. The Index has since resumed its decline in wave 3, structured as another five-wave sequence in a lesser degree. From the wave 2 high, wave ((i)) fell to 97.55, and a wave ((ii)) rally reached 98.54. As long as the pivot at 98.83 holds, the DXY should extend lower, targeting 97.3 in the near term. Traders should monitor this pivot for confirmation of the bearish trend.

Daily Forex Analysis | 2025.08.26In today’s video, we provide a detailed analysis of the most important forex pairs and instruments:
BTCUSD – Today’s outlook and market direction
DXY (Dollar Index) – Current dollar strength analysis
XAUUSD (Gold) – Possible gold movement in today’s session
EURUSD & GBPUSD – Technical analysis on major currency pairs
As always, our analysis follows a top-down approach to help you understand the bigger picture of the market.
Whether you are a beginner or an experienced trader, this video will give you valuable trading insights.

Dollar Index attempt.Trump has done something that has kept the Dollar Index below the key level of 100 for nearly 100 days, and despite all its attempts, it hasn’t even come close to that zone so far.
If it manages to strongly break through the 99 level, there might be hope that in the coming weeks it could return to its original position above 100.

DXY - long move aheadDXY - long move ahead, because of the shify of structure we can see a very clean long setup

LOOKING BEARISHThe DXY looks bearish mainly because markets expect the Fed to cut rates soon, which lowers dollar yields. At the same time, Treasury rallies, inflation fears, and fiscal dominance concerns are hurting confidence in the dollar. Technically, DXY has also broken key support levels, with momentum pointing lower. Investors are increasingly hedging dollar exposure, adding further downside pressure.
