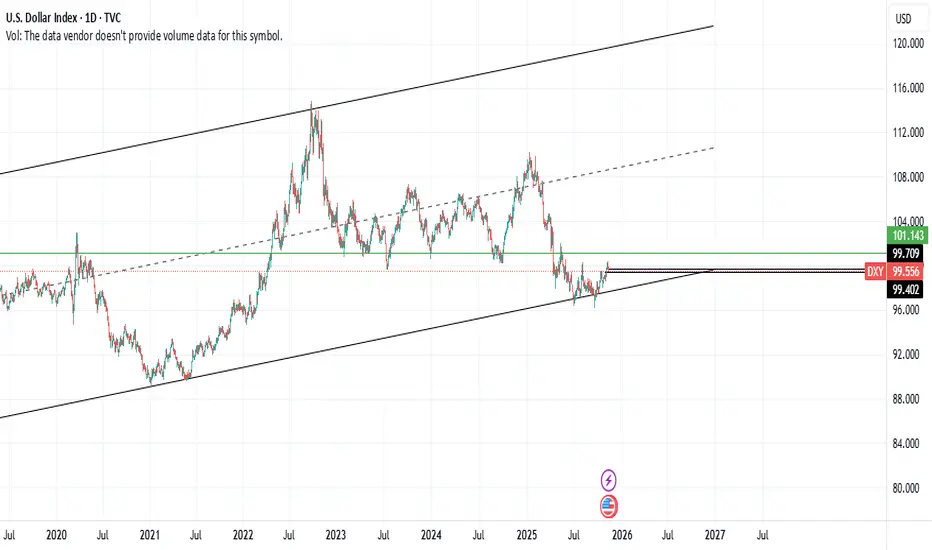
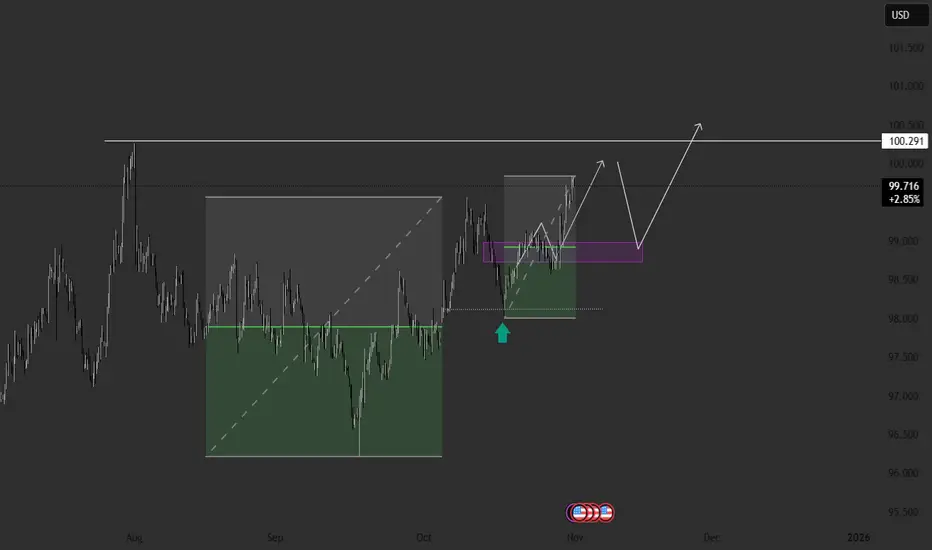
DXY is on an upward path, albeit with some hesitation.DXY is attempting to move away from the bottom of the channel and target higher levels. If the 101.14 level is broken, we can expect the median line of the advancing channel to be reached in higher timeframes. However, it is important to note that the release of economic data has been halted due to the government shutdown, which must be taken into consideration. Additionally, the FOMC’s decision to either lower or maintain Funds Rate is another key factor influencing this situation.
Trade ideas
DXY Bear Cycleif Trump's drill baby drill works and inflation is controlled, then the fed can continue its rate cutting and lead us this scenario..
Yield differentials between USD and other currencies (EUR, JPY, EM FX) shrink.
Global investors rotate out of USD assets into higher-beta risk assets.
then, Stocks 10x to the moon!

$DXY eye a 5 point move. RISK OFF.The dollar index is reversing course.
And I believe highly likely to trigger this complex inverse head and shoulder's.
A swift move to the 105 region
lines up with a expected downside move in #BTC
A corrective move in the #PreciousMetals
and further profit taking on the #AI trade.
I believe this all could play by Xmas.
So the odds of a #SantaRally are slim given current price action that we are seeing across the board.
Higher timeframe outlook for DXY : 8 November 2025Monthly timeframe
Bias : Bullish
Analysis:
Price has formed a low in September 2025, creating a dealing range with the dealing range high forming in January of 2025. This has set a the dollar index in a relative discount condition warranting a bullish bias. Please do note this bullish bias is mainly enforced by lower timeframes which will be addressed below.
The current bullish draw on liquidity on this timeframe is the monthly bearish fair value gaps at 103.197 to 101.977.
Weekly timeframe
Bias : Bullish
Analysis:
Price has displaced above 99.563 and has closed above the high leaving a bullish weekly fair value gap. This is a key indication that price wants to tread higher and is driving the monthly narrative.
It is expected that price to retrace into this bullish weekly fair value gap within the next 1-2 weeks before heading higher towards the monthly draw on liquidity.
4 hourly timeframe
Bias : Initial bearish with an expectation of bullish reversal to the upside.
Analysis:
This week has seen the dollar index displace below 99.671, leaving a bearish 4H fair value gap. This is an indication that price is still looking to tread lower into further discount before a reversal upside.
Note the 4H bearish order block aligning with the monthly opening price for November 2025. This adds confluence that price would reach for this bearish 4H order block and lower taking out the low of 99.398 heading into the bullish weekly fair value gap.
As mentioned in the 4hourly bias, there is an expectation of bullish reversal. This is where the 4hour timeframe starts to align with the weekly and monthly timeframe.
It is expected that this bullish reversal will occur after price heads into the bullish 4H fair value gap at 99.225. A bullish reversal would be confirmed once there is a bullish market structure shift confirmed with a bullish 4h fair value gap, a bullish 4H balanced price range, or an intermediate term low forming after price reacts off the 4H buyside imbalance sellside inefficiency.
Side note s
- Should this analysis not pan out the next point of interest would be the bullish rejection block and propulsion block on the 4H chart. Should these not hold, the bias may turn bearish.
- This analysis is for educational purposes and should not be taken as financial advice. The financial markets carry significant financial risk.
- For ease of readability, please turn off all indicators in my chart. This can be done by using the Ctrl+Alt+H function. Should you see multiple charts you can view one chart at a time by clicking on the one chart while holding down the Alt button.
dxy 4h🔹 Overall Outlook and Potential Price Movements
In the charts above, we have outlined the overall outlook and possible price movement paths.
As shown, each analysis highlights a key support or resistance zone near the current market price. The market’s reaction to these zones — whether a breakout or rejection — will likely determine the next direction of the price toward the specified levels.
⚠️ Important Note:
The purpose of these trading perspectives is to identify key upcoming price levels and assess potential market reactions. The provided analyses are not trading signals in any way.
✅ Recommendation for Use:
To make effective use of these analyses, it is advised to manually draw the marked zones on your chart. Then, on the 15-minute time frame, monitor the candlestick behavior and look for valid entry triggers before making any trading decisions.


DXY LONG ENTRY IDEA I am waiting for the price to drop to the previous bullish 4-Hour Fair Value Gap (FVG) buy-side imbalance sell-side inefficiency (BISI) bullish order block and 99.200 level.
If the price rejects those levels, I will look at my entry model from the 15-minute chart.
My STOP LOSS will be 99.00, and my 1st take profit will be 100.500, and my second TP will be 102.00 level.

World Trade Impacts on Market1. Introduction: The Global Nature of Trade
In today’s interconnected world, no country operates in isolation. Nations depend on each other for raw materials, technology, energy, and consumer goods. This interconnectedness, facilitated by globalization, free trade agreements, and technological advancements, has turned world trade into the backbone of global economic growth. The effects of trade ripple through various markets — financial, commodity, labor, and even digital.
Trade flows determine the direction of capital, affect inflation rates, and shape investment opportunities. A disruption in one part of the world, such as a supply chain bottleneck in Asia or a political crisis in the Middle East, can influence prices and investor sentiment worldwide.
2. Trade and Economic Growth
One of the most significant impacts of world trade on markets is its role in driving economic growth. Open economies that engage actively in trade tend to grow faster than closed economies. When countries export goods and services, they earn foreign exchange, which strengthens their currency reserves and supports domestic investment. Importing advanced technologies and machinery enhances productivity and competitiveness.
For example, China’s rapid rise to become the world’s second-largest economy is largely due to its trade-oriented policies. Similarly, export-driven economies such as Germany, Japan, and South Korea have thrived by focusing on global markets. Growth in trade often translates to rising corporate profits, which boosts stock markets and attracts foreign investors.
3. Impact on Stock Markets
Stock markets are highly sensitive to international trade trends. When global trade expands, companies involved in exports, logistics, and manufacturing often see increased revenues. Investors respond positively, pushing stock prices higher. Conversely, trade slowdowns, tariffs, or geopolitical tensions can lead to stock market volatility.
For instance, during the U.S.-China trade war (2018–2019), uncertainty over tariffs led to significant declines in global equity markets. Export-heavy industries such as automobiles, semiconductors, and agriculture experienced sharp losses due to disrupted trade flows. Conversely, when trade relations improve, optimism returns to the markets, leading to rallies and renewed investor confidence.
Trade also impacts sectoral performance — for example, commodity-exporting companies benefit from high global demand, while domestic-focused sectors might remain unaffected. Therefore, investors closely monitor trade data, global supply chains, and export-import statistics to predict market trends.
4. Impact on Currency Markets
World trade has a direct connection to foreign exchange (Forex) markets. When a country exports more than it imports, it experiences higher demand for its currency, strengthening its exchange rate. Conversely, trade deficits (more imports than exports) can weaken a currency.
For example, if India exports software services worth billions of dollars, foreign clients need Indian rupees to pay for these services, leading to a stronger INR. However, if India imports large amounts of crude oil, it must pay in U.S. dollars, increasing demand for USD and weakening the rupee.
Global trade imbalances also influence monetary policies. Central banks may intervene to stabilize their currencies when trade-related pressures become too strong. Thus, traders and investors watch trade balances, export data, and global demand indicators closely to anticipate currency movements.
5. Impact on Commodity Markets
Commodities such as oil, gold, steel, and agricultural products are the foundation of world trade. International demand and supply determine their prices. A surge in global trade usually increases the demand for raw materials, leading to higher commodity prices. Conversely, trade disruptions or global recessions reduce demand, causing price declines.
For example:
Crude oil prices fluctuate based on global trade volumes, shipping activity, and industrial production.
Gold prices often rise during trade conflicts or economic uncertainty, as investors seek safe-haven assets.
Agricultural commodities depend heavily on trade agreements and weather patterns in major exporting nations.
Hence, world trade patterns influence inflation, production costs, and ultimately, consumer prices across markets.
6. Employment and Labor Market Impacts
World trade also affects job creation and wage levels. Export industries often generate large-scale employment, especially in developing countries. However, increased competition from imports can lead to job losses in domestic industries that cannot compete globally.
For instance, India’s textile and IT sectors have benefited significantly from global trade, creating millions of jobs. On the other hand, industries exposed to cheaper imports (like steel or electronics) have sometimes suffered layoffs. Labor markets must therefore adapt to trade-driven structural changes by focusing on innovation, skill development, and productivity improvement.
7. Foreign Direct Investment (FDI) and Capital Flows
Trade liberalization encourages foreign direct investment (FDI). Multinational corporations (MNCs) set up production facilities in countries with strategic trade advantages — such as low labor costs, favorable tax policies, or access to key markets. FDI inflows create employment, transfer technology, and boost local markets.
For example, automobile giants like Toyota and Hyundai invested in India to serve both domestic and export markets. Similarly, U.S. tech companies have established R&D centers in developing countries to leverage skilled human resources. As trade barriers fall, capital flows more freely, creating interconnected global markets that react swiftly to any trade-related news.
8. Trade Wars and Protectionism
While free trade promotes growth, trade conflicts can destabilize markets. Protectionism — through tariffs, quotas, and trade barriers — distorts market efficiency and raises costs for consumers and producers alike. Trade wars, such as the one between the U.S. and China, reduce global growth prospects and shake investor confidence.
Protectionist policies often lead to inflationary pressures (as imports become expensive), reduced exports, and declining business profits. Global supply chains become disrupted, affecting industries from semiconductors to agriculture. Consequently, financial markets become volatile, and currencies fluctuate unpredictably.
9. Supply Chain Globalization and Market Interdependence
Modern trade is not just about exporting finished goods — it’s about global supply chains. A single product like a smartphone involves components sourced from multiple countries. This interdependence means that disruptions in one country (due to natural disasters, political instability, or pandemics) can have global ripple effects.
The COVID-19 pandemic highlighted this vulnerability. Factory shutdowns in China led to worldwide shortages of electronics, automotive parts, and consumer goods. As supply chains recovered, inflationary pressures spread globally, affecting interest rates and stock valuations. Investors now track supply chain data as closely as trade statistics to assess market risks.
10. Environmental and Social Impacts
World trade also influences environmental and social policies. The demand for raw materials and energy-intensive goods contributes to carbon emissions and climate change. To counter this, many countries are adopting ESG (Environmental, Social, and Governance) frameworks and promoting green trade initiatives like carbon credits and renewable energy exports.
Markets are beginning to reward sustainable trade practices. Investors favor companies that align with eco-friendly standards and responsible sourcing. Thus, the intersection of trade and sustainability is shaping new market trends and investment opportunities.
11. Conclusion: The Future of World Trade and Markets
World trade remains a powerful engine driving global market dynamics. Its impacts are broad and deep — influencing economic growth, currency values, commodity prices, employment, and investment flows. However, as globalization evolves, new challenges such as digital trade, geopolitical tensions, and environmental concerns will redefine how markets respond to trade patterns.
In the future, digital trade, AI-driven logistics, and regional trade alliances (like RCEP and EU partnerships) will shape global commerce. Markets that adapt to these transformations with innovation, transparency, and resilience will thrive in the next era of global trade.
Final Thought
In essence, world trade acts as the heartbeat of the global economy. It integrates nations, drives competition, and promotes prosperity. But it also introduces complexity and vulnerability. Understanding its impacts helps market participants — from policymakers to investors — navigate an ever-changing financial landscape shaped by the flow of goods, services, and ideas across borders.

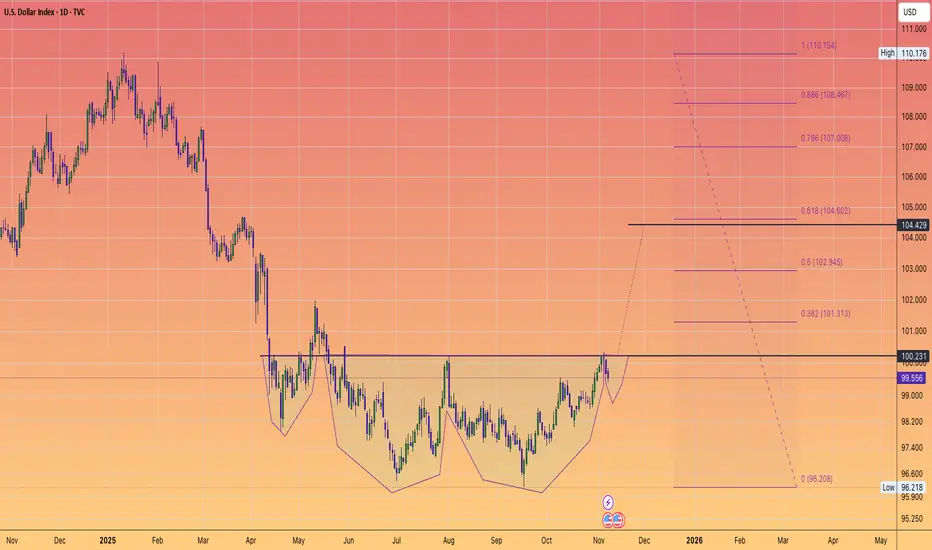
A clear direction of DXYI am expecting dxy to drop into the weekly FAIR VALUE GAB(FVG) around the 99.300 level, then move higher up to the 102.00 level, see 4H chart for entry Idea.

DXY ANALYSIS: TRADING WEEK 3 - 7 NOVEMBER 2025On this video i higlight the importance of the 101.800 area of resistance, a multi year resistance that on my view will be reached soon
I have two possible scenarios for the DXY next week:
- Test of the 101.800 during the first 2/3 trading days and pullback to the 97,700 area of support where the DXY would cover a gap left open 3 weeks ago and where the DXY will start rallying up again
- Test of the 101.300 - 101.500 level of resistance during the first 2/3 trading days and pullback to the 98.500 - 98.400 area of support where the DXY will start rallying up again
Data released through the week and the strength of the Index will ultimately confirm one of the two scenario
I will update and follow up on this trading analysis - setup; please like, comment and share if you like this Trading Idea

DXY — London SessionThe US Dollar traded through 99.357, confirming a wide range between 97.6 and 99.9.
This is already a large playing field, and today’s movement needs extra care.
It’s Friday, and with weekend flows plus U.S. politics in the mix, price can move irregularly.
Signals need double confirmation before bias.
We have our range, and the focus now is to respect it — not rush it.
The professional move: wait for structure to prove intent.
Discipline always beats impulse.
Fundamentals
Dollar strength remains supported by cautious sentiment.
Yields are steady, and investors are holding defensive exposure rather than chasing risk.
It’s less about fresh demand — more about managing positioning ahead of next week’s data.
— CORE5DAN
Institutional Logic. Modern Technology. Real Freedom.

US Dollar Index Daily Chart
Daily supply zone【99.78....100.22】
Previous resistance level。
Position at the upper Bollinger Band,
The RSI indicator shows a high level,
Three consecutive daily candlestick charts,Can be considered as the top structure
Possible trend expectations Bearish direction。
Let's wait and see.

NFP LOOK OUT ON USD INDEX FOR THE MONTHIts a trap, Don't buy now, wait for NFP to playout before you think for a buy or sell. Don't trade for now. BE patient

DXY Macro Thesis – Wyckoff Re-Accumulation Before Global Risk💵 DXY Macro Thesis – Wyckoff Re-Accumulation Before Global Risk Unwind
The U.S. Dollar Index ( TVC:DXY ) has been forming a multi-year Wyckoff re-accumulation structure since late 2023, following the broad risk-on cycle that stretched across BTC, gold, and equities.
After completing a Spring and successful Test in the 95 – 96 region, the index now shows clear signs of Phase D emergence, suggesting the dollar is quietly preparing for its next markup phase.
🧩 Structural Context
Phase A–C (2023 – 2025): Composite operator absorbed liquidity from over-extended risk assets while DXY built a broad base between 92 – 104.
Phase D (Current): We’re witnessing the Last Point of Support (LPS) formation around 99–100 — strengthening price structure, decreasing volatility, and the first signs of demand dominance.
Phase E (Next): Expected breakout and markup toward upper-range resistance zones.
📊 Technical + Macro Alignment
Zone Function Commentary
98.6 – 100.8 Re-accumulation axis. Current control range; sustained closes above 100.82 = Phase D confirmation
105.9 – 108.0 Mid-range objective Dealer hedging likely shifts positive Gamma → supports sustained advance
110 – 114 Primary target zone Historic supply band; aligns with USD liquidity tightening & global risk-off acceleration
116 – 123 Buying climax / terminal rally Final markup phase before next global rebalancing cycle.
🌐 Macro Narrative
This re-accumulation in DXY likely coincides with the early-stage unwind of speculative excess across BTC, gold, and global equities.
As liquidity rotates back into the dollar and short-dated yields stay elevated, risk assets face compression while USD strength re-emerges.
Stablecoin dominance metrics (USDT.D + USDC.D) have begun climbing again > 7.8 %, confirming risk-off capital rotation consistent with the early stages of a macro tightening leg.
🎯 Outlook
✅ Base case: Phase D markup resumes → targets 110–114, then potential buying climax 116–123 into 2026.
⚖️ Alternate: Range extension 98.6–100.8 through Q1 2026 (continuing absorption).
❌ Invalidation: Weekly close < 98.6 opens redistribution toward 95 → 92.6.

DXY Analysis — Tracking Dollar Strength This WeekThe DXY has cleared buy-side liquidity and closed below the Point of Control, signaling potential weakness in the dollar. I’m expecting continued selling on USD pairs (USDCAD, USDJPY) while looking for buying opportunities on EURUSD, GBPUSD, NZDUSD, and AUDUSD. Overall bias: bearish on the Dollar Index.

Dollar index analysisAccording to our previous analysis, the Dollar Index finally managed to reach the 100 zone. Now we need to see whether it can close above the 100 level without making a fake breakout downward. If it can give a solid close above 100, then we can start considering long positions on the Dollar Index or sell positions on EUR/USD.
dxy 1h🔹 Overall Outlook and Potential Price Movements
In the charts above, we have outlined the overall outlook and possible price movement paths.
As shown, each analysis highlights a key support or resistance zone near the current market price. The market’s reaction to these zones — whether a breakout or rejection — will likely determine the next direction of the price toward the specified levels.
⚠️ Important Note:
The purpose of these trading perspectives is to identify key upcoming price levels and assess potential market reactions. The provided analyses are not trading signals in any way.
✅ Recommendation for Use:
To make effective use of these analyses, it is advised to manually draw the marked zones on your chart. Then, on the 5-minute time frame, monitor the candlestick behavior and look for valid entry triggers before making any trading decisions.

DXY - Long Term Trade - Double Bottom - Swing TradeTrade Plan shared on chart. 1:3 Trade Target set. Buy Stop pending Trade set at break of Neckline of the Double Bottom. Analysis shared with detail.

DXY - Long Term Trade - Double Bottom - Swing TradeTrade Plan shared on chart. 1:3 Trade Target set. Buy Stop pending Trade set at break of Neckline of the Double Bottom. Analysis shared with detail.

DXY Weekly Outlook – Two Key Scenarios AheadAs expected in the previous review, the price has reached the local point B.
Now the market stands at a crossroads, so let’s look at the possible scenarios for the upcoming week.
Plan A – Correction Within the Daily Order Flow
The first scenario suggests a slight correction.
The price may move into a small pullback within the daily order flow, find support there, and continue the movement toward point B.
As long as the market structure remains bullish, this scenario stays the main one.
Plan B – Possible Decline
However, we don’t cancel the bearish scenario.
Right now, the price is trading inside the weekly key level, and taking out the fractal high often acts as an indicator of a possible trend reversal.
That’s why, if the price breaks below the lower boundary of the daily order flow, I’ll start considering short setups.
Summary
Overall, the structure is still under pressure from major levels, and the coming week will show who takes control — buyers or sellers.
I’ll continue to monitor the reaction within the daily order flow zone and update the outlook in the next review.
DXY-USD Game PlanDXY-USD Game Plan
📊 Market Sentiment
On 29/10, the FED lowered rates by 25BPS as expected. However, Powell’s remarks introduced uncertainty regarding December’s potential cut, stating that decisions will depend on upcoming data.
One FED member dissented, preferring no cut, a shift from September’s unanimous decision.
As a result, rate cut expectations dropped from 95% to 68%, sparking short-term bullish sentiment for the USD, as traders adjusted portfolios toward defensive positioning.
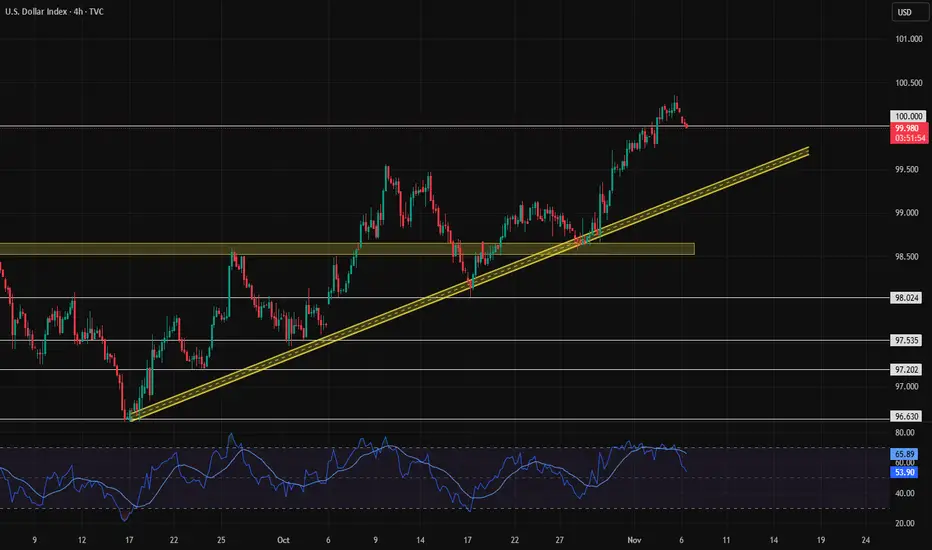
📈 Technical Analysis
The Dollar Index (DXY) hit its HTF Weekly Bullish Trendline and got rejected, forming a structural reversal pattern.
We’ve now seen a break of short-term daily bearish trend, confirming strength and a potential leg higher toward 102.00 (Monthly FFVG).
📌 Game Plan / Expectations
Expecting price to wick or close above 100.25, then potentially retrace before resuming the bullish leg.
Primary upside target: Monthly FFVG zone at 102.00.
Sentiment remains bullish for the dollar short term, which may pressure risk assets (stocks and crypto) temporarily.
💬 If this DXY breakdown supports your macro view, like, comment, and follow.
For deeper insights and liquidity-based macro models, subscribe to my Substack (free access available).
⚠️ Disclaimer
This analysis is for educational purposes only and does not constitute financial advice. Always conduct your own research before trading or investing.

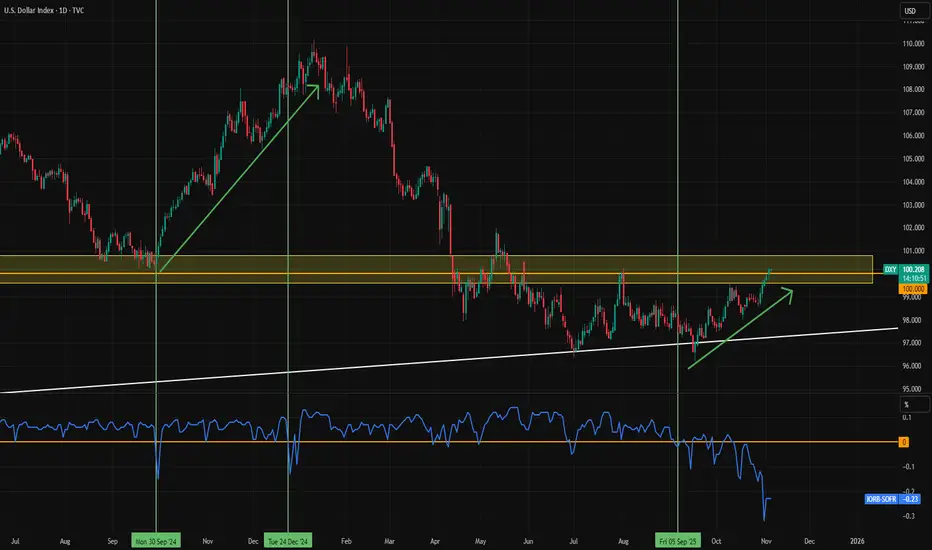
Dollar Rises Amid Record US Shutdown and Liquidity ShortageThe dollar index is climbing as the US faces its longest government shutdown on record. The FRED:SOFR rate is trading 0.23 percentage points above the FRED:IORB , signaling a liquidity shortage. Unfortunately, TradingView data doesn’t cover the 2019 liquidity crunch, but the current situation looks similar.
Earlier this week, Logan highlighted the elevated repo rate and noted that the Fed may need to step in and purchase assets if conditions persist. The liquidity shortage is putting upward pressure on the dollar index. A breakout above 101 could accelerate that pressure further.
If the US shutdown ends, renewed government spending could ease the liquidity strain, allowing the dollar to retreat. Until then, upward momentum is likely to continue.
DXY — London SessionThe Dollar reached its 99.8 target and closed the day above it, confirming short-term strength. Price now trades stretched on the daily chart, well above its normal rhythm. As long as daily lows keep printing higher, structure holds — but with both weekly and monthly charts in correction, momentum could fade quickly. This is a day-by-day market where clarity matters more than conviction.
On the technical side, DXY shows rhythm exhaustion — clear deviation from its average range. When price moves this far from balance, professionals stop chasing and wait for rhythm to reset. The key signal now is whether the next daily low holds or breaks; that decides who controls the tape.
Macro conditions still support the Dollar. The Fed’s tone stays cautious on further cuts, while the U.S. government shutdown keeps data flow limited. Investors prefer safety over yield, and capital continues to park in USD for clarity and liquidity. It’s not a growth story — it’s a stability story.
When a target hits, professionals re-map before acting again. The next decision comes from structure, not emotion.
Operator Rule: After targets hit, think — don’t chase.
- Institutional Logic. Modern Technology. Real Freedom.
