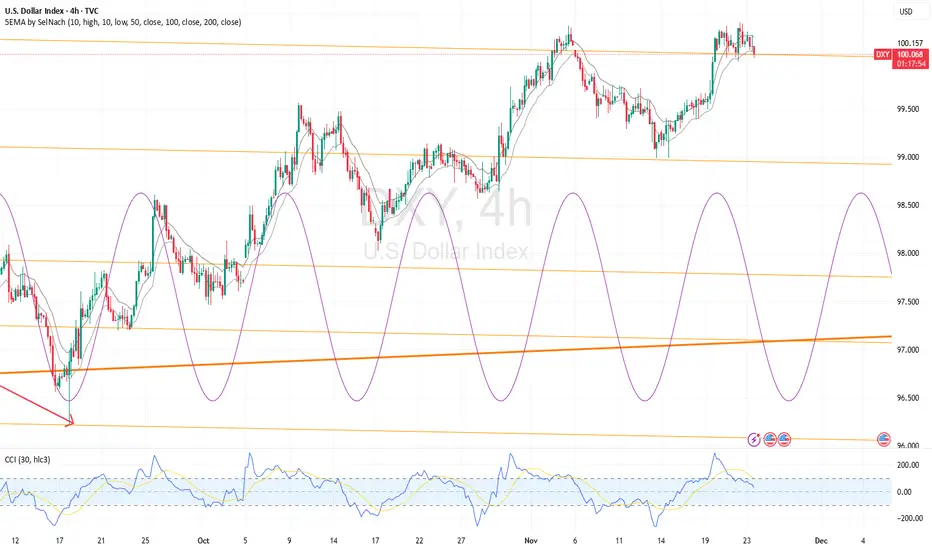
FractalCycles at Work: Analysis of the U.S. Dollar Index (DXY)This chart highlights the dominant 62-period cycle currently steering short-term swings in the U.S. Dollar Index. Price has been respecting the rhythm of this cycle, with recent highs and lows forming close to the projected turning points.
At the moment, DXY is trading near a potential cycle peak, and with the next downward phase approaching, the probability of a short-term pullback increases. Momentum indicators are also softening, offering further confirmation of cycle pressure beginning to turn.
Takeaway:
The 62-period cycle continues to provide reliable structure for timing DXY’s shorter-term movements. If the pattern persists, traders should be prepared for a potential downswing as the next cycle trough unfolds.
Market insights
DXY Bullish Continuation -Buy Zone & Breakout PlanDXY is still holding its bullish structure moving inside the rising channel and currently ranging just under the weak high near 100.50. As long as price stays above the 100.00 support zone this consolidation looks like a pause before another push up toward 100.80–101.00. A deeper dip inside the range is possible but overall momentum remains bullish unless price breaks below the channel support.
Fundamentally the dollar is supported by recent mixed but stable US data, NFP remaining solid-unemployment slightly higher and wage growth cooling moderately combined with a Federal Reserve stance that is not ready for quick rate cuts. This keeps short-term USD sentiment mildly positive. Risk off flows and steady Treasury yields also help maintain dollar strength.
Overall, both technical structure and fundamentals support a bullish continuation after the current range completes its liquidity grab.
Buy Zone:
The ideal buy zone is 99.95 – 100.05 which aligns with the lower boundary of the consolidation range, the mid-channel support and the previous demand area. This is where price is expected to dip, grab liquidity and form a bullish reaction.
Buy Trigger Area:
The buy trigger is a bullish rejection or bullish candle close from 100.00 or a break and retest of 100.20–100.25 from inside the range. A clean bounce from the lower range or a retest reclaim signals the continuation toward 100.50 and then 100.80.
Note
Please risk management in trading is a Key so use your money accordingly. If you like the idea then please like and boost. Thank you and Good Luck!

DXYDXY - U.S Dollar Index
- Completed " 1234 " Impulsive Waves
- Fair Value Gap
- Bullish Channel as an corrective pattern in Short Time Frame
- Resistance Level
- Double Top in Short Time Frame

EU HnLDXY reaching fresh NY support low, EU reaching fresh NY resistance high, with following high relatively a bit far, possible quick reversal, a little early in the week but worth it

The US Dollar Index Hovers Near Key ResistanceThe US Dollar Index Hovers Near Key Resistance
As the chart of the US Dollar Index (DXY) shows, today the value is sitting near an important resistance level around 100.20 points. We highlighted this level earlier — including in our analytical post from 10 November.
Fluctuations in the USD against other currencies are forming a configuration of two channels:
→ A blue bullish trajectory that began back in September. However, this resistance level appears to be a significant obstacle. Last week, the bulls attempted to push the DXY to a six-month high, but they failed to hold those gains.
→ A red alternative bearish trajectory, which may become more pronounced and relevant if the bears seize the initiative once it becomes clear that the bulls are running out of steam.
At the start of the week, the index is also moving within a narrowing triangle — the breakout direction may indicate the key trend into the year-end.
The balance between the two scenarios will largely depend on the fundamental backdrop, with traders mainly focusing on:
→ News related to the prospects of a Federal Reserve rate cut. Barclays analysts expect the Fed to cut rates in December.
→ A possible intervention by the Bank of Japan to support the weakened yen, which has come under pressure due to low domestic interest rates. Japan’s Finance Minister, Satsuki Katayama, reinforced this rhetoric last week.
→ The release of data — including US retail sales and producer prices — which were postponed due to the record-long government shutdown.
This article represents the opinion of the Companies operating under the FXOpen brand only. It is not to be construed as an offer, solicitation, or recommendation with respect to products and services provided by the Companies operating under the FXOpen brand, nor is it to be considered financial advice.

DXY key levels to look out for this week (WC 24/11)DXY key levels for the following week ahead.
Key fundamentals this week includes retail sales release on Tuesday for USD, Unemployment claims on wednesday and Bank holiday on Thursday.

DXY FRGNT Daily Forecast -Q4 | W48| D24 | Y25 |📅 Q4 | W48| D24 | Y25 |
📊 DXY FRGNT Daily Forecast
🔍 Analysis Approach:
I’m applying Smart Money Concepts, focusing on:
Identifying Points of Interest on the Higher Time Frames (HTFs) 🕰️
Using those POIs to define a clear trading range 📐
Refining those zones on Lower Time Frames (LTFs) 🔎
Waiting for a Break of Structure (BoS) for confirmation ✅
This method allows me to stay precise, disciplined, and aligned with the market narrative, rather than chasing price.
💡 My Motto:
"Capital management, discipline, and consistency in your trading edge."
A positive risk-to-reward ratio, paired with a high win rate, is the backbone of any solid trading plan 📈🔐
⚠️ Losses?
They’re part of the mathematical game of trading 🎲
They don’t define you — they’re necessary, they happen, and we move forward 📊➡️
🙏 I appreciate you taking the time to review my Daily Forecast.
Stay sharp, stay consistent, and protect your capital
— FRNGT 🚀
TVC:DXY

DXY (SHORT)
Dollar pullback expected this week
5wave move completed/ ABC move NEXT.
because pairs like GBPUSD and EURUSD Are also showing bullish momentum confirming the weak USD.

MISSED TRADE DUE TO BUSY WEEK. I missed a lot of trade due to busy week. 3 rr is enough to take the trade.

Potential bullish rise?US Dollar Index (DXY) has bounced off the pivot and could rise to the 1st resistance.
Pivot: 99.41
1st Support: 98.61
1st Resistance: 101.92
Disclaimer:
The opinions given above constitute general market commentary and do not constitute the opinion or advice of IC Markets or any form of personal or investment advice.
Any opinions, news, research, analyses, prices, other information, or links to third-party sites contained on this website are provided on an "as-is" basis, are intended to be informative only, and are not advice, a recommendation, research, a record of our trading prices, an offer of, or solicitation for, a transaction in any financial instrument and thus should not be treated as such. The information provided does not involve any specific investment objectives, financial situation, or needs of any specific person who may receive it. Please be aware that past performance is not a reliable indicator of future performance and/or results. Past performance or forward-looking scenarios based upon the reasonable beliefs of the third-party provider are not a guarantee of future performance. Actual results may differ materially from those anticipated in forward-looking or past performance statements. IC Markets makes no representation or warranty and assumes no liability as to the accuracy or completeness of the information provided, nor any loss arising from any investment based on a recommendation, forecast, or any information supplied by any third party.

Higher timeframe outlook for DXY : 8 November 2025Monthly timeframe
Bias : Bullish
Analysis:
Price has formed a low in September 2025, creating a dealing range with the dealing range high forming in January of 2025. This has set a the dollar index in a relative discount condition warranting a bullish bias. Please do note this bullish bias is mainly enforced by lower timeframes which will be addressed below.
The current bullish draw on liquidity on this timeframe is the monthly bearish fair value gaps at 103.197 to 101.977.
Weekly timeframe
Bias : Bullish
Analysis:
Price has displaced above 99.563 and has closed above the high leaving a bullish weekly fair value gap. This is a key indication that price wants to tread higher and is driving the monthly narrative.
It is expected that price to retrace into this bullish weekly fair value gap within the next 1-2 weeks before heading higher towards the monthly draw on liquidity.
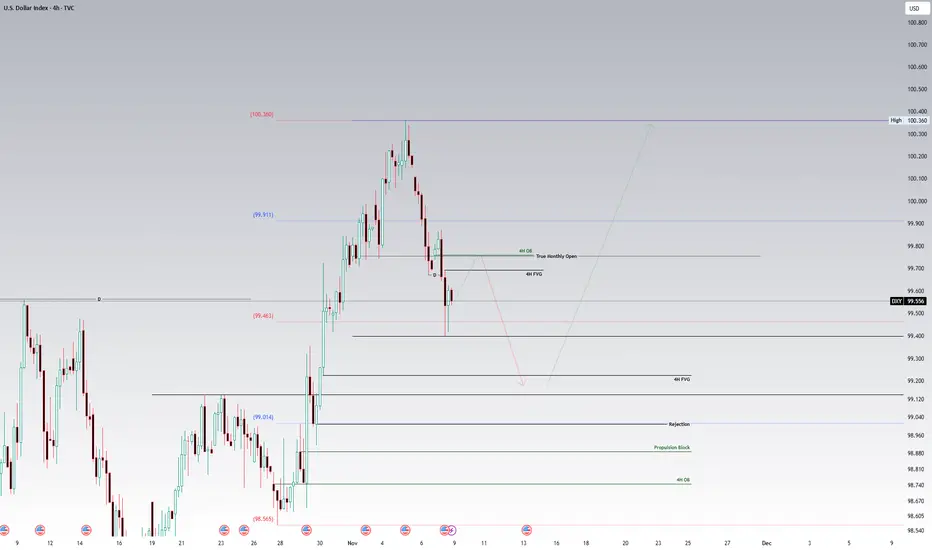
4 hourly timeframe
Bias : Initial bearish with an expectation of bullish reversal to the upside.
Analysis:
This week has seen the dollar index displace below 99.671, leaving a bearish 4H fair value gap. This is an indication that price is still looking to tread lower into further discount before a reversal upside.
Note the 4H bearish order block aligning with the monthly opening price for November 2025. This adds confluence that price would reach for this bearish 4H order block and lower taking out the low of 99.398 heading into the bullish weekly fair value gap.
As mentioned in the 4hourly bias, there is an expectation of bullish reversal. This is where the 4hour timeframe starts to align with the weekly and monthly timeframe.
It is expected that this bullish reversal will occur after price heads into the bullish 4H fair value gap at 99.225. A bullish reversal would be confirmed once there is a bullish market structure shift confirmed with a bullish 4h fair value gap, a bullish 4H balanced price range, or an intermediate term low forming after price reacts off the 4H buyside imbalance sellside inefficiency.
Side note s
- Should this analysis not pan out the next point of interest would be the bullish rejection block and propulsion block on the 4H chart. Should these not hold, the bias may turn bearish.
- This analysis is for educational purposes and should not be taken as financial advice. The financial markets carry significant financial risk.
- For ease of readability, please turn off all indicators in my chart. This can be done by using the Ctrl+Alt+H function. Should you see multiple charts you can view one chart at a time by clicking on the one chart while holding down the Alt button.
DXY idea 12.11.2025For the dollar index, I think that if the price breaks through the golden pocket, the price could reach the level of 100-100.5, which would be an ideal opportunity for a short from a confluence perspective. There is a weekly level and a value high here, and there is also a fibo of 0.786. For a long, I would see potential around the price of 97.7, where the wvap daily level and fibo of 0.382 are located nearby, for a broader context.

DXY– Potential Shift After Momentum StallThe dollar index has shown a strong climb followed by signs of momentum slowing at recent highs. Current price behaviour suggests the possibility of a corrective move developing after this consolidation phase, with downside continuation becoming more likely if bullish follow-through fails to materialise. We’ll be monitoring structure and momentum closely as the next leg unfolds.
Disclosure: We are part of Trade Nation's Influencer program and receive a monthly fee for using their TradingView charts in our analysis

Bullish USIndex/DXYTechnically looking at a bullish momentum. Price might consolidate inside the box pattern or just break or bounce inside the descending channel breaking out

dxy 4h🔹 Overall Outlook and Potential Price Movements
In the charts above, we have outlined the overall outlook and possible price movement paths.
As shown, each analysis highlights a key support or resistance zone near the current market price. The market’s reaction to these zones — whether a breakout or rejection — will likely determine the next direction of the price toward the specified levels.
⚠️ Important Note:
The purpose of these trading perspectives is to identify key upcoming price levels and assess potential market reactions. The provided analyses are not trading signals in any way.
✅ Recommendation for Use:
To make effective use of these analyses, it is advised to manually draw the marked zones on your chart. Then, on the 15-minute time frame, monitor the candlestick behavior and look for valid entry triggers before making any trading decisions.

DXY ( Doller Index ) I expect to see the dollar index begin to rise from these areas. The wave will take months, perhaps even two years, to reach the upward target

Weekly DXY Candle AnalysisIt’s been nearly 220 days that the Dollar Index has been trading below the key 100 level, and this week it managed to approach 100 with a relatively strong candle compared to previous ones.
If this week closes above 100, and next week also manages to hold above it, we can expect the Dollar Index to strengthen.
As long as the DXY hasn’t given a proper confirmation above 100, we remain sellers on the index.


DXYSo DXY showing great structure after failing to continue bullish as it did not break above the supply zone and now, moving bearish ensuring the to move towards previous demad zone which price created.

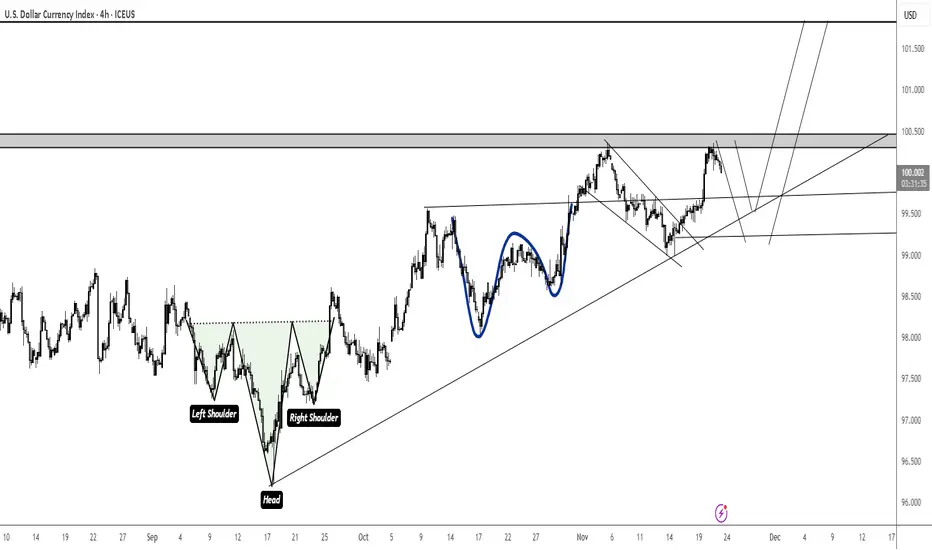
SL GU tradeMarket came down to Support zone to form a W suggesting a possible bullish reversal at the second hand of the W, correlating with WH+SH on DXY. Against Bias but setup is convincing, with good R2R (1:2)

Dollar Index Double Top!Within a 4-hour time frame, the DXY (Dollar Index) is forming a double top. There's a slight bullish divergence at RSI 14, which makes it a potential buy signal.
With FVG (Fair Value Gap), Buy Limit would be at around 100.03, and if taking Buy Stop (a more cautious approach), then the entry point would be at around 100.45.

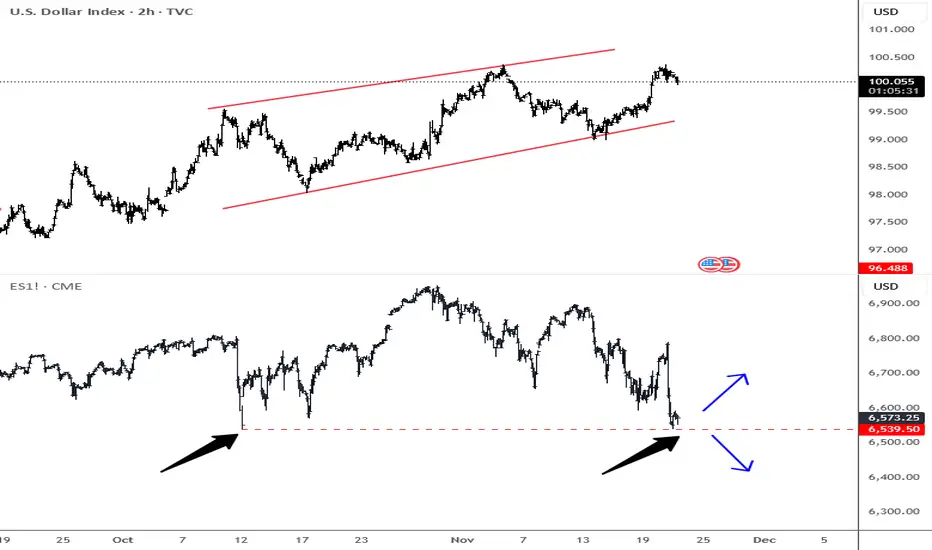
SP500 Testing Do-Die Support Stocks are seeing a pretty strong and aggressive decline, interestingly right after Nvidia delivered earnings that beat expectations, so it looks like the market still wants to move lower as AI-related valuations in the tech sector are simply too high and the market needs a deeper retracement. What stands out is that the S&P 500 has now retraced perfectly back to that October 10th Friday gap, when we saw a massive 3.5% sell-off in just one session, so I’m wondering if this zone could act as an interesting support for a potential rebound.
Keep in mind that despite the weakness in stocks over the last few sessions, we are not seeing that much strength on the dollar as you would normally expect in risk-off; so if stocks rebound the dollar could also slow down, ideally around 100.35–100.65 where the upside could be limited at the upper side of a wedge formation. I really want to see how the market will close today, because if we get a positive reaction in stocks then we may have some reason for a bounce next week, but if not and the market fails to recover today, then I’m afraid we can see much lower levels on the S&P 500 while DXY invalidate the diagonal formation.
DXY General Trend Is Still Bullish But Pullback Highly ProbableThe trend is clearly still bullish. There is no sign yet of a reversal of a trend.
But a retracement is highly probable.