JPN225 H4 | Bullish reversal off pullback supportJPN225 has bounced off the buy entry at 42,071.68, which is a pullback support and could rise from this level to the upside.
Stop loss is at 41,254.99, which is a pullback support that is slightly below the 61.8% Fibonacci retracement.
Take profit is at 43,045.81, which is a multi swing high resitance that is slightly abov the 50% Fibonacci retracement.
High Risk Investment Warning
Trading Forex/CFDs on margin carries a high level of risk and may not be suitable for all investors. Leverage can work against you.
Stratos Markets Limited (tradu.com ):
CFDs are complex instruments and come with a high risk of losing money rapidly due to leverage. 65% of retail investor accounts lose money when trading CFDs with this provider. You should consider whether you understand how CFDs work and whether you can afford to take the high risk of losing your money.
Stratos Europe Ltd (tradu.com ):
CFDs are complex instruments and come with a high risk of losing money rapidly due to leverage. 66% of retail investor accounts lose money when trading CFDs with this provider. You should consider whether you understand how CFDs work and whether you can afford to take the high risk of losing your money.
Stratos Global LLC (tradu.com ):
Losses can exceed deposits.
Please be advised that the information presented on TradingView is provided to Tradu (‘Company’, ‘we’) by a third-party provider (‘TFA Global Pte Ltd’). Please be reminded that you are solely responsible for the trading decisions on your account. There is a very high degree of risk involved in trading. Any information and/or content is intended entirely for research, educational and informational purposes only and does not constitute investment or consultation advice or investment strategy. The information is not tailored to the investment needs of any specific person and therefore does not involve a consideration of any of the investment objectives, financial situation or needs of any viewer that may receive it. Kindly also note that past performance is not a reliable indicator of future results. Actual results may differ materially from those anticipated in forward-looking or past performance statements. We assume no liability as to the accuracy or completeness of any of the information and/or content provided herein and the Company cannot be held responsible for any omission, mistake nor for any loss or damage including without limitation to any loss of profit which may arise from reliance on any information supplied by TFA Global Pte Ltd.
The speaker(s) is neither an employee, agent nor representative of Tradu and is therefore acting independently. The opinions given are their own, constitute general market commentary, and do not constitute the opinion or advice of Tradu or any form of personal or investment advice. Tradu neither endorses nor guarantees offerings of third-party speakers, nor is Tradu responsible for the content, veracity or opinions of third-party speakers, presenters or participants.
JPN225.F trade ideas

JP225 Long Trade - to hit 42,550FOREXCOM:JP225 Long Trade
Entry: 42,000 - 42,200
TP: 42,550
This is good trade.
Don't overload your risk like Greedy gambler!!!
Be Disciplined Trader, what what you can afford.
Use proper risk management.
Disclaimer: Trading is risky, only idea, not advice.

Nikkei 225 Short: Completed 5-wave structure at Fibo ExtensionI may, or not may, go through this idea in a video but the information provided on the chart should be self-explanatory.
I am still figuring out how to label the cycle level waves (since 2009) that may potentially signal that this is the ultimate peak and we are going into a strong downturn. But primarily study doesn't show any nice Fibonacci properties although it won't technically be wrong (I just prefer to have nice Fibo extension levels). Till I can convince myself of the longer-term counts, for trading purpose, the current count is sufficient for a seriously good risk-reward trade.
Good luck!

NIKKEI Rising Support! Buy!
Hello,Traders!
NIKKEI is trading along
The rising support and
The index is going down
Now but as we are bullish
Biased we will be expecting
A bullish rebound and
And a move up after
The retest
Buy!
Comment and subscribe to help us grow!
Check out other forecasts below too!
Disclosure: I am part of Trade Nation's Influencer program and receive a monthly fee for using their TradingView charts in my analysis.

NIKKEI Buy Plan — ATH Breakout Incoming!🚀 NIKKEI Buy Plan — ATH Breakout Incoming!
Buyers should stay alert and confident — NIKKEI is not just aiming to break its previous all-time high, it's preparing to print a brand new one. The recent price action shows strong bullish continuation, supported by:
✅ Weekly Fair Value Gap respected and driving upward
✅ Monthly FVG served as solid foundation
✅ No sign of rejection candles, just healthy retracements
✅ Liquidity magnets overhead are pulling price aggressively
Expect big bullish candles to form soon as price targets external liquidity.
Momentum is on buyers’ side — new ATH is not a matter of "if", but "when"!

JP225 Nikkei 225What is JP225?
The JP225, also known as the Nikkei 225, is a major stock market index in Japan. It tracks the performance of 225 of the largest and most liquid publicly traded companies listed on the Tokyo Stock Exchange (TSE). The Nikkei 225 covers a wide array of sectors such as automotive (Toyota, Honda), technology (Sony, Panasonic), finance (Mitsubishi UFJ), consumer goods, and more. It is price-weighted, meaning the stocks with higher prices have a bigger influence on the index value, similar to the Dow Jones Industrial Average in the US.
The Nikkei 225 serves as a key barometer for the health of the Japanese economy and equity market performance.
How Does the JB10Y and BOJ Interest Rate Decision Affect the JP225?
1. Japan 10-Year Government Bond Yield (JB10Y)
The JB10Y yield reflects long-term borrowing costs and investor expectations on Japan’s economy and inflation.
Rising 10-year yields typically signal improving growth or inflation expectations, which can be positive for equities like the Nikkei if higher yields reflect stronger economic prospects.
However, higher yields also increase financing costs for companies, which may weigh on profit margins and stock prices if the rise is rapid or caused by inflation worries.
Falling yields can indicate economic pessimism or deflation fears, which usually weigh on the Nikkei due to adverse growth expectations.
2. Bank of Japan (BOJ) Interest Rate
BOJ’s interest rate policy primarily influences short-term rates and liquidity in the Japanese economy.
Japan has historically maintained very low or even negative interest rates to stimulate economic growth and combat deflation.
BOJ rate hikes might increase borrowing costs and dampen stock valuations in the short term but could also signal confidence in economic recovery.
Maintaining or lowering rates supports corporate borrowing and investment, generally providing a tailwind to the Nikkei.
BOJ policy also influences currency strength (JPY), which affects export-oriented companies within the index.
Summary
The JP225 (Nikkei 225) is influenced by both the longer-term JB10Y bond yields and the Bank of Japan’s interest rate decisions. Rising JB10Y yields can indicate stronger growth but come with higher costs, impacting the index positively or negatively depending on the economic context. BOJ’s interest rates affect short-term borrowing, liquidity, and market sentiment, with low or easing rates typically supporting equity markets like the Nikkei.
#jp225 #stocks #indices
These factors, combined with global market trends and currency movements, shape the Nikkei 225’s performance and investor sentiment in Japan.

Nikkei 225 Short: Going for Wave 3 of 3In this video, I go through the Elliott Waves for Nikkei 225 and study the sub-wave 2 of 3 as an irregular correction and why that supports a strong wave 3 down.

NIKKEI SELLnikkei I see distribution occurring on the 4h, any pull-ups to premium areas is shorts for me

JPN225 Technical Analysis: Comprehensive Nikkei 225# JPN225 Technical Analysis: Comprehensive Nikkei 225 Multi-Timeframe Trading Strategy
Executive Summary
**Current Price:** 42,087.6 (August 30, 2025, 12:54 AM UTC+4)
**Market Sentiment:** Bullish with consolidation signals near all-time highs
**Primary Trend:** Strong uptrend with potential for further extension
**Key Resistance:** 43,876 (recent all-time high)
The Nikkei 225 continues to demonstrate exceptional strength, trading near record levels after reaching its highest quote on August 19, 2025 at 43,876.42 JPY. The index has shown remarkable resilience with monthly gains of 5.08% and yearly gains of 10.53%, outperforming global peers while benefiting from accommodative global monetary policy and renewed investor confidence in Japanese equities.
Market Context & Fundamental Backdrop
Monetary Policy Environment
The Bank of Japan maintains a carefully balanced approach with the benchmark interest rate at 0.50 percent, representing a significant shift from the ultra-loose policies of recent years. Markets expect a gradual return to tighter policy likely starting in autumn 2025 or early 2026 if economic conditions remain favorable.
Economic Fundamentals
The Japanese economy shows signs of sustainable recovery with corporate earnings supporting equity valuations. The recent all-time highs reflect growing expectations of US Federal Reserve interest rate cuts and improved global risk sentiment.
Key Market Drivers
Global Liquidity:** Fed rate cut expectations supporting risk assets
Corporate Governance:** Continued improvements in ROE and shareholder returns
Yen Dynamics:** Currency stability supporting foreign investment flows
Export Recovery:** Gradual improvement in global trade conditions
Technical Analysis Framework
Japanese Candlestick Analysis
**Monthly Pattern:** Strong bullish engulfing pattern confirming long-term uptrend
**Weekly Pattern:** Inside bar formation suggesting consolidation before next move
**Daily Pattern:** Small-bodied doji candles near highs indicating indecision
**Intraday Patterns:** Morning star and hammer formations frequent in 1H timeframe
Elliott Wave Analysis
**Primary Wave Count:**
Major Degree:** Wave 5 of multi-year bull market cycle in progress
Intermediate Degree:** Subwave 3 of 5 potentially completed near 43,876
Minor Degree:** Currently in subwave 4 correction within larger Wave 5
**Alternative Count:** Extended Wave 3 scenario targeting 45,000-46,000 zone
**Critical Levels:** Wave 4 support at 40,500-41,000 maintains bullish structure
Harmonic Pattern Analysis
**Active Patterns:**
Bullish Cypher:** Completion zone at 40,800-41,200 (potential retracement target)
AB=CD Extension:** Current formation targeting 44,200-44,800
Potential Bearish Gartley:** Formation risk above 44,500 suggesting reversal
**Fibonacci Confluence:**
- 61.8% retracement of major swing: 41,450
- 38.2% retracement: 42,650 (current area)
- 1.618 extension target: 44,200
Wyckoff Method Analysis
**Current Phase Assessment:** Sign of Strength (SOS) after successful test
**Accumulation Characteristics:**
- Volume increasing on advances, decreasing on declines
- Spring action completed in July 2025 low
- Markup phase showing healthy progression
**Composite Operator Activity:** Evidence of institutional accumulation between 40,000-42,000
W.D. Gann Technical Analysis
# Square of 9 Application
**Current Position:** 42,087.6 = 205.15° on the Gann wheel
**Key Resistance Levels:**
- 42,025 (205°) - recently tested
- 42,436 (206°) - immediate resistance
- 43,681 (209°) - major resistance near ATH
**Support Levels:**
- 41,616 (204°) - immediate support
- 41,209 (203°) - strong support zone
- 40,401 (201°) - major support level
# Time Theory Application
**Critical Time Cycles:**
- September 6-9: 90-degree time angle from major low
- September 23: Autumn equinox - natural turning point
- October 7: 180-degree time cycle completion
# Price Squaring Analysis
**Square Root of Price:** √42,087.6 = 205.15
**Next Square Levels:**
- 206² = 42,436 (immediate resistance)
- 207² = 42,849 (intermediate target)
- 210² = 44,100 (extended target)
**Previous Square Support:**
- 204² = 41,616
- 203² = 41,209
- 200² = 40,000 (psychological support)
Ichimoku Kinko Hyo Analysis
**Current Cloud Configuration:**
Tenkan-sen (9):** 42,155 - Price slightly below, neutral bias
Kijun-sen (26):** 41,920 - Price above, bullish confirmation
Senkou Span A:** 42,037 (cloud top)
Senkou Span B:** 40,885 (cloud bottom)
**Assessment:** Price trading above cloud with bullish bias intact, though near cloud resistance requiring breakout for continuation.
Multi-Timeframe Technical Indicator Analysis
5-Minute Chart (Scalping Focus)
**RSI(14):** 52.3 - Neutral zone with slight bullish bias
**VWAP:** 42,065 - Price oscillating around VWAP, indecision
**Bollinger Bands:** Middle band at 42,070, bands contracting (low volatility)
**Volume:** Below average, typical for consolidation phase
15-Minute Chart (Scalping Focus)
**MACD:** Histogram flattening, momentum slowing
**Stochastic(14,3,3):** 48.2 in neutral territory
**Williams %R:** -52% suggesting no extreme conditions
**Support/Resistance:** 42,040/42,130 key levels for range
1-Hour Chart (Day Trading)
**RSI(14):** 58.7 - Neutral with slight bullish momentum
**VWAP:** 41,995 providing dynamic support
**Moving Averages:** EMA(20) > EMA(50) maintaining bullish alignment
**Volume Profile:** High volume node at 42,000-42,100
**Key Levels:**
Resistance:** 42,150, 42,250, 42,380
Support:** 42,000, 41,920, 41,800
4-Hour Chart (Swing Trading)
**RSI(14):** 61.4 approaching overbought but not extreme
**MACD:** Positive but showing slight divergence with price
**Bollinger Bands:** Price near upper band, expansion needed for breakout
**ADX(14):** 31.2 indicating moderate trend strength
**Critical Levels:**
Primary Resistance:** 42,400-42,500
Secondary Resistance:** 43,000-43,200
Primary Support:** 41,700-41,800
Secondary Support:** 41,200-41,400
Daily Chart (Position Trading)
**RSI(14):** 64.8 in bullish territory but not overbought
**Moving Averages:** All major MAs (20, 50, 100, 200) aligned bullishly
**Volume:** Consolidation pattern with average volume
**Pattern:** Ascending triangle formation with apex near 42,400
Weekly Chart (Long-term Analysis)
**RSI(14):** 69.1 approaching overbought threshold
**MACD:** Strong positive momentum but rate of change slowing
**Long-term Trend:** Powerful uptrend since October 2024 low
**Major Resistance:** 43,876 (ATH) and 44,000-44,500 zone
Monthly Chart (Strategic View)
**RSI(14):** 73.2 significantly overbought (caution warranted)
**Long-term Pattern:** Multi-year cup and handle completion
**Measured Move Target:** 46,000-48,000 based on pattern analysis
**Support Structure:** 38,000-40,000 major support zone
Comprehensive Support and Resistance Analysis
Primary Support Structure
1. **42,000-42,050:** Psychological level with VWAP confluence
2. **41,920-41,950:** Kijun-sen and previous resistance turned support
3. **41,700-41,800:** Previous consolidation zone with volume
4. **41,400-41,500:** 38.2% Fibonacci retracement level
5. **41,200-41,300:** Square of 9 support and trend line
6. **40,800-41,000:** Major support zone and Elliott Wave 4 target
7. **40,000-40,200:** Psychological and long-term trend support
Primary Resistance Structure
1. **42,150-42,200:** Immediate resistance with intraday significance
2. **42,380-42,450:** Square of 9 resistance and daily pivot
3. **42,800-43,000:** Intermediate resistance zone
4. **43,200-43,400:** Previous consolidation resistance
5. **43,800-43,900:** All-time high resistance zone
6. **44,100-44,300:** Extended targets and measured moves
7. **45,000-45,500:** Long-term bull market targets
Weekly Trading Strategy (September 2-6, 2025)
Monday, September 2, 2025
**Market Environment:** Post-weekend positioning, likely range-bound opening
**Primary Strategy:** Range trading with breakout preparation
**Volatility Expectation:** Below average due to consolidation phase
**Intraday Trading Levels:**
Long Entry Zone:** 42,020-42,040
- Stop Loss: 41,980
- Target 1: 42,090 (1:1 R/R)
- Target 2: 42,140 (1:2 R/R)
Short Entry Zone:** 42,140-42,160
- Stop Loss: 42,200
- Target 1: 42,090 (1:1 R/R)
- Target 2: 42,040 (1:2 R/R)
**Swing Setup:** Monitor for break above 42,200 for continuation to 42,400
Tuesday, September 3, 2025
**Market Environment:** Potential volatility increase, global macro focus
**Primary Strategy:** Momentum trading with trend following bias
**Key Events:** Watch for any BOJ communication or USD/JPY moves
**Trading Approach:**
Bullish Scenario:** Break above 42,200 targets 42,350-42,400
- Entry: 42,210-42,230
- Stop: 42,150
- Targets: 42,320, 42,400
Bearish Scenario:** Break below 42,000 targets 41,850-41,900
- Entry: 41,990-42,010
- Stop: 42,050
- Targets: 41,920, 41,850
**Risk Management:** Reduce position sizes by 25% given potential volatility
Wednesday, September 4, 2025
**Market Environment:** Mid-week consolidation expected
**Primary Strategy:** Scalping within established range
**Focus:** High-frequency opportunities with tight risk management
**Scalping Strategy:**
Range Parameters:** 42,000-42,180
Long Scalps:** 42,010-42,025, Target: 42,070-42,090
Short Scalps:** 42,150-42,165, Target: 42,100-42,080
Stop Losses:** 15-20 points maximum for scalp trades
**Breakout Preparation:**
Bullish Breakout:** Above 42,200 with volume confirmation
Bearish Breakdown:** Below 41,980 with increased selling pressure
Thursday, September 5, 2025
**Market Environment:** Potential trending day, higher volatility expected
**Primary Strategy:** Breakout trading with momentum confirmation
**Critical Factors:** Volume analysis crucial for sustained moves
**Breakout Scenarios:**
Upside Breakout:** Above 42,250
- Targets: 42,400, 42,550, 42,700
- Volume Requirement: 1.5x average
- Stop Loss: 42,150
Downside Breakdown:** Below 41,950
- Targets: 41,800, 41,650, 41,500
- Volume Requirement: 1.3x average
- Stop Loss: 42,050
**Position Management:**
- Scale into positions on confirmed breakouts
- Trail stops aggressively after first target achieved
Friday, September 6, 2025
**Market Environment:** Weekly close positioning, potential profit-taking
**Primary Strategy:** End-of-week consolidation trading
**Focus:** Weekly close levels for next week's setup
**Weekly Close Strategy:**
Bullish Close:** Above 42,150 sets up next week advance
Neutral Close:** 42,000-42,150 maintains current range
Bearish Close:** Below 42,000 suggests correction risk
**Day Trading Approach:**
Morning Session:** Trend continuation from Thursday
Afternoon Session:** Range trading and position squaring
Final Hour:** Light volume, avoid new large positions
Advanced Risk Management Framework
Position Sizing Guidelines
**Account Risk per Trade:**
5M Scalping:** 0.25-0.5% maximum risk
15M Scalping:** 0.5-0.75% maximum risk
1H Day Trading:** 1-1.5% maximum risk
4H Swing Trading:** 1.5-2% maximum risk
Daily Position Trading:** 2-3% maximum risk
Stop Loss Parameters
**Timeframe-Specific Stops:**
5-Minute Charts:** 30-50 points maximum
15-Minute Charts:** 50-80 points maximum
1-Hour Charts:** 80-120 points maximum
4-Hour Charts:** 150-250 points maximum
Daily Charts:** 300-500 points maximum
Profit-Taking Strategy
**Systematic Approach:**
First Target (50% position):** 1:1 Risk/Reward ratio
Second Target (30% position):** 1:2 Risk/Reward ratio
Third Target (20% position):** 1:3+ Risk/Reward ratio
Trailing Stops:** Implement after first target achievement
Maximum Daily Loss Limits
Scalping Combined:** -1% of account maximum
Day Trading:** -2% of account maximum
Swing Positions:** -3% of account maximum
Total Portfolio:** -5% daily stop loss (all strategies combined)
Geopolitical and Market Risk Assessment
Domestic Risk Factors
**Bank of Japan Policy:**
- Expected gradual tightening starting autumn 2025
- Communication changes could trigger volatility
- Yield curve control adjustments impacting bond markets
**Economic Indicators:**
- Corporate earnings season performance
- Wage growth and inflation data
- Consumer spending patterns
International Risk Factors
**US Federal Reserve Policy:**
- Interest rate cut expectations driving current rally
- Any hawkish surprises could trigger risk-off sentiment
- Dollar strength impacting Japanese export competitiveness
**China Economic Data:**
- Manufacturing PMI and economic indicators
- Trade relationship developments
- Commodity demand affecting Japanese materials sector
**Geopolitical Considerations:**
- Regional security tensions
- Trade policy developments
- Energy security concerns
Currency Risk (USD/JPY Impact)
**Current Dynamics:**
- Yen stability supporting foreign investment
- Intervention risk if excessive yen weakness
- Carry trade dynamics affecting equity flows
**Key Levels to Monitor:**
- USD/JPY above 155: Intervention risk increases
- USD/JPY below 140: Export competitiveness concerns
- Current range 145-150 supportive for equities
Sector Analysis and Rotation Themes
Outperforming Sectors
1. **Technology:** AI and semiconductor strength
2. **Financial Services:** Rising rate environment benefits
3. **Export-Oriented Manufacturing:** Stable yen supporting margins
4. **Tourism and Services:** Domestic consumption recovery
Underperforming Sectors
1. **Utilities:** Interest rate sensitivity
2. **Real Estate:** Commercial property concerns
3. **Traditional Retail:** E-commerce competition
4. **Energy Imports:** Cost pressures from global prices
Rotation Indicators
Growth vs Value:** Currently favoring quality growth
Domestic vs Export:** Balanced performance
Large Cap vs Small Cap:** Large cap leadership maintained
Advanced Pattern Recognition
Ichimoku Trading Signals
**Current Setup:** Tenkan/Kijun twist near cloud top
**Bullish Signals:** Price above cloud, future cloud bullish
**Entry Trigger:** Break above Tenkan-sen with volume
**Exit Signal:** Return below Kijun-sen or cloud
Gann-Based Trade Setups
**Square of 9 Long:** Buy at 203° (41,209) target 206° (42,436)
**Square of 9 Short:** Sell at 206° (42,436) target 203° (41,209)
**Time Cycles:** Major turns expected September 6-9 window
Wyckoff Phase Analysis
**Current Assessment:** Markup Phase B
**Expected Development:** Test of supply around 43,000
**Bullish Continuation:** Successful test leads to Phase C
**Distribution Risk:** Heavy volume above 43,500 warns of Phase A
Market Microstructure Considerations
High-Frequency Trading Impact
**Active Zones:** Increased HFT activity around 42,000 and 42,200
**Optimal Entry Times:** 9:00-9:30 JST and 14:30-15:00 JST
**Liquidity Concerns:** Reduced depth above 43,000 level
Algorithmic Trading Patterns
**Support/Resistance:** Algorithms defending 42,000 level
**Momentum Algos:** Active above 42,200 breakout level
**Mean Reversion:** Strong between 42,000-42,150 range
Order Flow Analysis
**Large Block Activity:** Evidence near 42,000 support
**Institutional Flows:** Accumulation on weakness below 42,000
**Retail Sentiment:** Generally bullish but positioning light
Technology Integration and Tools
Recommended Platforms
1. **TradingView:** Comprehensive charting and analysis
2. **MT5/MT4:** Order execution and automation
3. **Bloomberg Terminal:** Real-time data and news flow
4. **Refinitiv Eikon:** Fundamental analysis integration
Alert Systems
**Price Alerts:**
- 42,200 breakout level
- 42,000 breakdown level
- 43,000 major resistance
- 41,500 major support
**Volume Alerts:**
- 1.5x average volume spikes
- Unusual options activity
- Block trade notifications
**News Alerts:**
- BOJ communications
- Economic data releases
- Geopolitical developments
- Corporate earnings surprises
Seasonal and Cyclical Analysis
Historical Patterns
**September Performance:** Typically weak month for Japanese equities
**Q4 Seasonality:** Strong performance into year-end typically
**Monthly Cycles:** Pension fund flows mid-month supporting prices
Holiday Calendar Impact
**Labor Day (Sep 2):** Reduced US market activity
**Autumnal Equinox (Sep 23):** Japanese market closed
**Sports Day (Oct 13):** Market holiday consideration
Conclusion and Strategic Outlook
The Nikkei 225 stands at a critical inflection point, having achieved new all-time highs while showing signs of consolidation near these elevated levels. The technical picture remains constructively bullish across most timeframes, though some overbought conditions on longer-term charts warrant measured optimism.
**Key Investment Themes:**
1. **Trend Continuation:** Primary uptrend intact with higher high potential
2. **Range Trading Opportunity:** 42,000-42,400 range likely to persist near-term
3. **Breakout Preparation:** Accumulation above 42,400 could trigger significant advance
4. **Risk Management Priority:** Elevated levels require disciplined position sizing
**Week Ahead Strategy:**
- Favor range trading initially with breakout preparation
- Monitor volume carefully for sustained directional moves
- Reduce position sizes given September seasonality concerns
- Focus on high-probability setups with multiple confluence factors
**Medium-term Outlook (1-3 months):**
The combination of supportive global liquidity conditions, improving Japanese corporate fundamentals, and technical momentum suggests potential for further advances toward 44,000-45,000. However, traders should remain vigilant for any shift in central bank communications or global risk sentiment that could trigger meaningful corrections.
**Risk Scenarios:**
Bullish Case:** Break above 43,900 targets 45,000-46,000
Base Case:** Consolidation between 41,500-43,500 through September
Bearish Case:** Break below 41,000 suggests correction to 39,000-40,000
The technical analysis framework presented incorporates multiple methodologies to provide robust trade identification and risk management protocols. Market participants should adapt position sizes and holding periods based on their risk tolerance and market conditions while maintaining disciplined adherence to the technical levels identified.
---
*This analysis represents a comprehensive technical assessment based on multiple methodologies and should be combined with proper risk management and individual risk tolerance considerations. Markets can exhibit unexpected behavior, and all trading decisions should incorporate current market conditions and individual financial circumstances.*

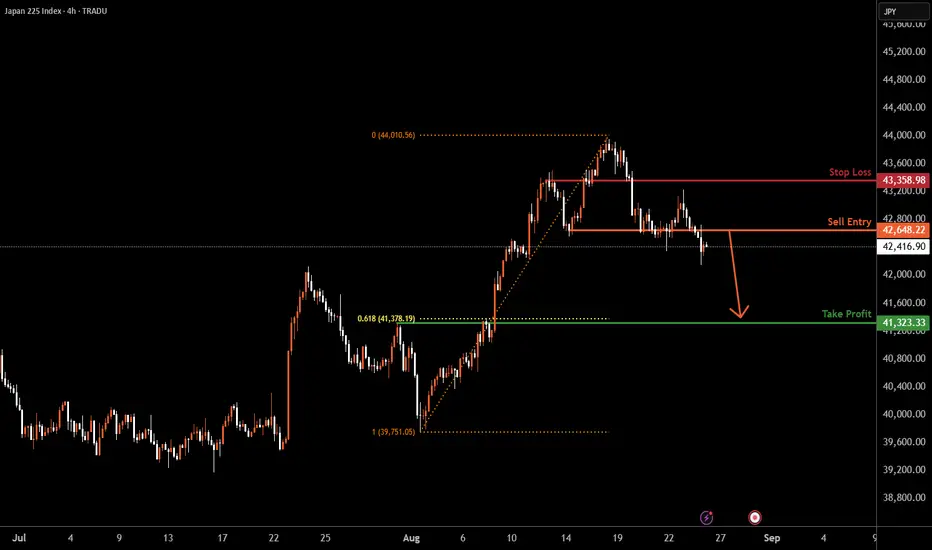
JPN225 H4 | Could the price drop from hereJPN225 is rising towards the sell entry at 42,648.22, which is a pullback resistance and could reverse from this level to the downside.
Stop loss is at 43,358.98, which is a pullback resistance.
Take profit is at 41,323.33, which is a pullback support that aligns with the 61.8% Fibonacci retracement.
High Risk Investment Warning
Trading Forex/CFDs on margin carries a high level of risk and may not be suitable for all investors. Leverage can work against you.
Stratos Markets Limited (tradu.com ):
CFDs are complex instruments and come with a high risk of losing money rapidly due to leverage. 65% of retail investor accounts lose money when trading CFDs with this provider. You should consider whether you understand how CFDs work and whether you can afford to take the high risk of losing your money.
Stratos Europe Ltd (tradu.com ):
CFDs are complex instruments and come with a high risk of losing money rapidly due to leverage. 66% of retail investor accounts lose money when trading CFDs with this provider. You should consider whether you understand how CFDs work and whether you can afford to take the high risk of losing your money.
Stratos Global LLC (tradu.com ):
Losses can exceed deposits.
Please be advised that the information presented on TradingView is provided to Tradu (‘Company’, ‘we’) by a third-party provider (‘TFA Global Pte Ltd’). Please be reminded that you are solely responsible for the trading decisions on your account. There is a very high degree of risk involved in trading. Any information and/or content is intended entirely for research, educational and informational purposes only and does not constitute investment or consultation advice or investment strategy. The information is not tailored to the investment needs of any specific person and therefore does not involve a consideration of any of the investment objectives, financial situation or needs of any viewer that may receive it. Kindly also note that past performance is not a reliable indicator of future results. Actual results may differ materially from those anticipated in forward-looking or past performance statements. We assume no liability as to the accuracy or completeness of any of the information and/or content provided herein and the Company cannot be held responsible for any omission, mistake nor for any loss or damage including without limitation to any loss of profit which may arise from reliance on any information supplied by TFA Global Pte Ltd.
The speaker(s) is neither an employee, agent nor representative of Tradu and is therefore acting independently. The opinions given are their own, constitute general market commentary, and do not constitute the opinion or advice of Tradu or any form of personal or investment advice. Tradu neither endorses nor guarantees offerings of third-party speakers, nor is Tradu responsible for the content, veracity or opinions of third-party speakers, presenters or participants.
Japan 225 Index (Nikkei 225) Forecast for This WeekThe Japan 225 index, commonly known as the Nikkei 225, is positioned for continued volatility this week amid a complex interplay of domestic and international factors. The index closed at 42,807.82 on Monday, August 26, gaining 0.4% and extending its winning streak for a second consecutive day.
Key Technical Analysis and Short-Term Outlook
Technical indicators suggest a mixed but cautiously bullish outlook for the week. The index recently recovered from a 4% decline that brought it down to an intraday low of 42,330 on Friday, August 22. Several technical elements point to a potential bullish reversal:
Based on Elliott Wave analysis, the current short-term bullish impulsive sequence from the August 1 low of 39,749 suggests potential for continued upward movement. Key resistance levels to watch are 43,560 and 44,050/44,110, while support is found at 41,975.
Daily forecasts for this week show:
• Tuesday, August 26: Target 42,984, with a maximum of 45,993 and minimum of 39,975
• Wednesday, August 27: Target 43,007, ranging between 46,017 and 39,997
• Thursday, August 28: Target 42,727, with a range of 45,718 to 39,736
• Friday, August 29: Target 42,082, between 45,028 and 39,136
Major Market Drivers This Week
Federal Reserve Policy Impact
The most significant catalyst for Japanese markets this week stems from Fed Chair Jerome Powell’s dovish Jackson Hole speech, which opened the door to a September rate cut. This has created a favorable environment for risk assets globally, with increased prospects for US monetary easing acting as a tailwind for Japanese tech stocks.
The speech led to a surge in the yen, which rose 1% against the dollar as investors anticipate the rate gap between Japan and the US will narrow. While this currency strength may pressure export-oriented companies, it reflects expectations of continued monetary policy divergence.
Bank of Japan Policy Outlook
The Bank of Japan’s next monetary policy meeting is scheduled for September 18-19, 2025. Recent inflation data shows Japan’s core CPI remained at 3.1% in July, above the BOJ’s 2% target, reinforcing expectations for potential rate hikes.
BOJ Governor Kazuo Ueda, speaking at Jackson Hole, highlighted that wage growth is spreading from large enterprises to smaller companies, with the tight labor market expected to continue exerting upward pressure on wages. This supports growing market speculation of another interest rate hike, possibly as early as October.
Key Economic Data Releases
Several important economic indicators are scheduled for release this week:
Thursday, August 29:
• Unemployment Rate (forecast: 2.5%)
• Tokyo Core CPI YoY (previous: 2.9%, forecast: 2.7%)
• Industrial Production MoM (forecast: -0.5%)
• Retail Sales YoY (forecast: 2.2%)
These data points will be crucial for assessing the health of Japan’s economy and the BOJ’s policy trajectory.
Sector-Specific Outlook
Technology Sector
Nvidia’s earnings report on Wednesday will be particularly important for Japanese semiconductor and tech stocks. The company’s results often serve as a bellwether for the global tech sector, and Japanese chip-related stocks like SoftBank Group and Advantest have already shown strength in anticipation.
Automotive Sector
Japanese automakers continue to face headwinds from US tariffs, despite the recent trade agreement that reduced duties from 25% to 15%. The automotive sector remains under pressure, with exports to the US showing significant declines and companies absorbing tariff costs through price reductions.
Banking Sector
Financial stocks have been recent outperformers, benefiting from rising JGB yields as markets price in potential BOJ rate hikes. The 10-year Japanese government bond yield has risen to around 1.61%, hovering near its highest levels since 2008.
Risk Factors and Challenges
Several factors could weigh on market performance this week:
1. Currency strength: The yen’s appreciation may hurt export competitiveness
2. Global growth concerns: Slowing global demand could impact Japan’s export-dependent economy
3. Trade tensions: Despite the US-Japan trade deal, automotive tariffs remain elevated compared to historical levels
4. Technical resistance: The index faces significant resistance levels around 43,560
Weekly Forecast Summary
The Nikkei 225 is expected to trade within a volatile range this week, with potential for modest gains if technical resistance levels are cleared. The index benefits from:
• Fed dovish pivot supporting risk sentiment
• Strong corporate earnings and governance improvements
• Continued monetary policy normalization by the BOJ
However, traders should remain cautious given the mixed technical signals, currency headwinds, and upcoming key economic data releases. The index’s ability to maintain levels above 42,000 will be crucial for sustaining the current upward momentum.
Target range for the week: 42,000 - 44,000, with key resistance at 43,560 and support at 41,975.

NI225: Target Is Up! Long!
My dear friends,
Today we will analyse NI225 together☺️
The recent price action suggests a shift in mid-term momentum. A break above the current local range around 43,018.70 will confirm the new direction upwards with the target being the next key level of 43,345.35 and a reconvened placement of a stop-loss beyond the range.
❤️Sending you lots of Love and Hugs❤️


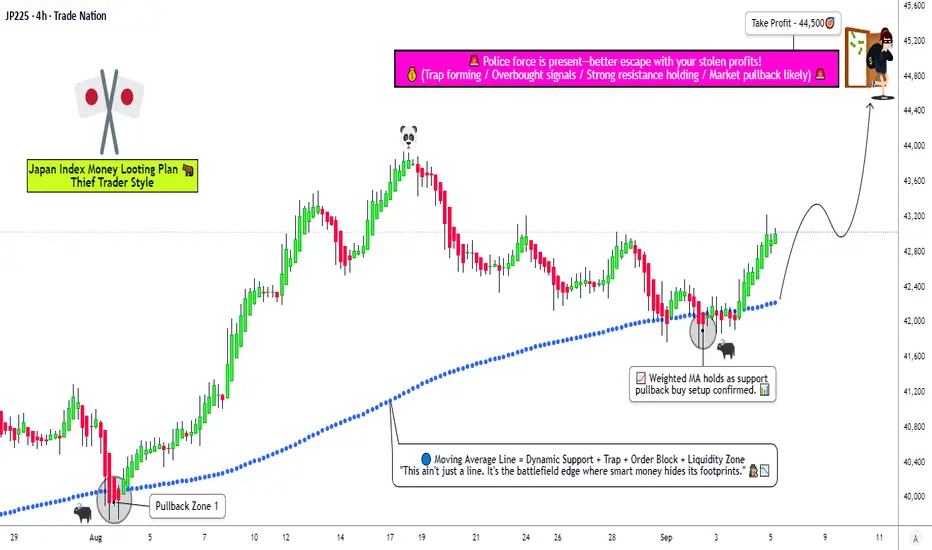
JP225 – Multi-Layer Entry, Smart SL & Steal Profits!🚀🇯🇵 JP225 (JAPAN 225) CFD - THIEF STRATEGY BULLISH PLAN 🇯🇵🚀
🎯 Core Trading Idea
The "Thief Strategy" uses layered limit orders to stealthily accumulate positions during bullish momentum, targeting a swift escape before key resistance levels. This approach maximizes entry efficiency while minimizing market impact – perfect for the current JP225 setup!
📊 THIEF STRATEGY EXECUTION PLAN
⚡ Entry Protocol (Layered Limit Orders)
🔰 Layer 1: 42,200
🔰 Layer 2: 42,400
🔰 Layer 3: 42,600
🔰 Layer 4: 42,800
💡 Pro Tip: Add more layers based on your risk tolerance and capital allocation
🛑 Stop Loss Configuration
Thief OG SL: 41,800 (Strategic support breach level)
⚠️ Disclaimer: Adjust SL based on your personal risk management rules. This is NOT financial advice.
🎯 Profit-Taking Target
Primary Escape Zone: 44,500 (Take profits before police barricade resistance at 45,000)
Remember: Escape with your stolen money wisely! Partial profits at 43,800 and 44,200 recommended
📈 WHY THIS PLAN? MARKET CONTEXT & ANALYSIS
🎯 Real-Time Index Snapshot (Sep 05, 2025)
Current Price: 43,002.00 (+423.82 / +1.00% 📈)
Monthly Gain: +5.48% (Strong momentum ✅)
Yearly Gain: +18.24% (Bullish trend intact ✅)
All-Time High: 43,876.42 (August 2025 🏆)
😰😊 Market Sentiment: Fear & Greed Index
Current Reading: Greed (Score ~70/100) 😊
Momentum: Strong (Above 125-day MA) 📈
Volatility: Low to Moderate 😌
Safe Haven Demand: Low 🚫
Options Activity: Neutral 📊
✅ Fundamental Drivers (BULLISH CATALYSTS)
🏎️ Trade Policy Win: U.S. auto tariffs reduced to 15% (from 27.5%) - massive boost for Japanese exporters
💰 Wage Growth Breakthrough: Real wages turned positive (+0.5%) for first time since December 2024
💵 Investment Surge: $550B Japanese investments in U.S. projects announced
🌍 Global Liquidity Support: Fed rate cut expectations supporting risk assets
🏢 Corporate Strength: Toyota (+1.98%), Honda (+1.14%), and Mitsubishi UFJ (+0.93%) leading gains
⚠️ Key Risks (BE AWARE)
💴 Yen Appreciation Risk: Potential JPY strength if U.S. accelerates rate cuts
🎯 Inflation Pressure: Consumer inflation at 3.6% (above BoJ's 2% target)
📉 Mixed Economic Signals: Coincident index dropped to 113.3 (from 116.7)
📊 Technical Assessment
🎯 Trend Structure: Bullish above 41,500 support
📊 Momentum: Strong upward trajectory with occasional consolidation
🧱 Resistance Levels: 43,900 (Recent high), 45,000 (Psychological barrier)
🛡️ Support Levels: 41,800 (Strategy SL), 41,200 (Strong weekly support)
🌐 RELATED PAIRS TO WATCH
FX:USDJPY - Critical for exporter competitiveness
INDEX:NKY - Nikkei 225 futures correlation
SP:SPX - Global risk sentiment gauge
OANDA:EURJPY - Yen strength indicator
📊 BULLISH/BEARISH SCORECARD
Technical: 80% Bullish ✅ | 20% Bearish
Fundamental: 75% Bullish ✅ | 25% Bearish
Sentiment: 70% Bullish ✅ | 30% Bearish
Risk/Reward: 80% Favorable ✅ | 20% Unfavorable
OVERALL: 76% BULLISH ✅ | 24% BEARISH
👑 TRADER PERSPECTIVES
🎯 Retail Traders: Optimistic but cautious near ATHs. Watch for breakout above 43,900
🏦 Institutional Flow: Accumulating on dips, focusing on exporters and tech names
🇯🇵 Domestic Investors: Positive on wage growth and trade developments
✨ "If you find value in my analysis, a 👍 and 🚀 boost is much appreciated — it helps me share more setups with the community!"
⚠️ RISK DISCLAIMER
This idea is for educational purposes only. I am not a financial advisor. The "Thief Strategy" is a personal approach and may not suit all traders. Always conduct your own analysis and manage risk appropriately. Past performance doesn't guarantee future results. Trading CFDs carries substantial risk of loss.
#JP225 #Japan225 #NIKKEI #TradingSetup #SwingTrading #DayTrading #TradingStrategy #CFD #MarketAnalysis #TechnicalAnalysis #TradingView #ThiefStrategy #Bullish #Investing #Stocks #Finance
NI225 LongObserving the Fibonacci Chart:
A temporary index growth appears at the 50% Level.
Eyes on the Golden 61.8% Level for potentially Strong growth,backed by Significant Technical Divergence.

NI225: Local Bearish Bias! Short!
My dear friends,
Today we will analyse NI225 together☺️
The price is near a wide key level
and the pair is approaching a significant decision level of 42,718.42 Therefore, a strong bearish reaction here could determine the next move down.We will watch for a confirmation candle, and then target the next key level of 42,619.72.Recommend Stop-loss is beyond the current level.
❤️Sending you lots of Love and Hugs❤️


NI225: Next Move Is Up! Long!
My dear friends,
Today we will analyse NI225 together☺️
The market is at an inflection zone and price has now reached an area around 42,633.24 where previous reversals or breakouts have occurred.And a price reaction that we are seeing on multiple timeframes here could signal the next move up so we can enter on confirmation, and target the next key level of 42,940.13 .Stop-loss is recommended beyond the inflection zone.
❤️Sending you lots of Love and Hugs❤️

JP225 22.08.2025~+ JP CPI Miss; GDP Beat last week
~+ BoJ is quite optimistic about the economy at the last Rate Decision

Rally Japanese style: #NIKKEI breaks recordsOn August 18, 2025, #NIKKEI hit a new all-time high (43,929). The main driver of growth was the weakening of the yen , which instantly improved export expectations and pushed up automakers: Toyota and Honda were among the leaders. plus positive corporate outlooks and an influx of foreign money amid global expectations of interest rate cuts. Banks and some chip stocks pulled in the opposite direction that day, but the weight of the auto sector and consumer leaders was enough to make the session a “record-breaking” one.
#NIKKEI on the rise: 5 keys to growth in 2025:
1. Yen exchange rate ↔ exports . A weak/volatile yen supports the margins and multipliers of exporters (automotive, industrial electronics), so any periods of currency weakness remain a catalyst for the index.
2. Soft global “rate” background . The market is pricing in a high probability of an Fed rate cut; the cheaper dollar and general risk appetite are fueling flows into Japanese stocks, especially beneficiaries of external demand.
3. Corporate reforms and buybacks . Strengthened corporate governance practices, stock market pressure to increase ROE/PB, and growth in share buyback programs remain long-term supports for the rally.
4. Industrial cycle: automotive and “new electronics.” Models with high export leverage (automotive, EV/ADAS components, semiconductor equipment) are benefiting from global fleet renewal and growth in technology CAPEX, which is maintaining the profitability of Nikkei's “core” weights. (Inference based on current trends and index structure; confirmed by the composition of session leaders.)
5. Domestic demand and earnings . Moderate wage growth and improved corporate earnings forecasts for the second half of the year are boosting the resilience of domestic demand — another plus for estimates.
The current surge is a classic mix of a weak yen + strong exporters + soft global rates . If corporate reforms and buybacks continue to work and external demand does not “collapse,” the #NIKKEI has a chance to stay close to record levels. FreshForex analysts remind us of the possible risks — a sharp reversal of the yen, delays in trade agreements, and possible tightening by the Bank of Japan — but the underlying backdrop is still playing in favor of the bulls.

JP225 - BUY TRADE IDEA 📊 with observation of the price structure, JP225 is currently holding on support level and forming a reversal pattern (Double bottom) on the support levels. A push to the upside is possible before Retesting the previous trendline support as resistance before seeing a continuation of the fall on JP225
⚠️ a break below support would suggest JP225 entering strongly into bearish territory.

JP225 Short TradeFOREXCOM:JP225 Short Trade
Entry: 43,452–43,420
TP: 42,850
This is good trade.
Don't overload your risk like Greedy gambler!!!
Be Disciplined Trader, what what you can afford.
Use proper risk management.
Disclaimer: Trading is risky, only idea, not advice.
