Trade ideas

NAS100 INTRADAY TECHNICAL ANALYSIS ═════════════════════════════════════════════════════════════════════
NAS100 INTRADAY TECHNICAL ANALYSIS & MARKET OUTLOOK
November 17, 2025 | 10:30 AM UTC+4 | Current Level: 25,187.5
═════════════════════════════════════════════════════════════════════
CRITICAL SUPPORT & RESISTANCE LEVELS
RESISTANCE ZONES (Sell Targets):
R1: 25,245.80 (First Profit Zone - 58.3 points) | RSI 65-70 zone
R2: 25,335.40 (Intermediate Target - 147.9 points) | EMA 20 confluence + Rising Wedge apex
R3: 25,445.20 (Strong Resistance - 257.7 points) | Weekly pivot + Gann 1x1 angle
SUPPORT ZONES (Buy Opportunities):
S1: 25,115.20 (Initial Support - 72.3 points) | 15m Bollinger Band lower band
S2: 25,010.60 (Intermediate Support - 176.9 points) | SMA 50 daily + Gann angle
S3: 24,885.40 (Strong Support - 302.1 points) | Harmonic AB=CD node
CURRENT PRICE ACTION
Index rallying after Wyckoff accumulation completion. Price above EMA 20/50 on 4h = bullish confirmation. Bollinger Bands expanding—breakout phase active. RSI at 62 (bullish) on 1h suggesting momentum continuation. Rising Wedge pattern on 30m approaching apex breakout. Volume surging into US session. Ichimoku cloud bullish alignment below price.
═════════════════════════════════════════════════════════════════════
ENTRY & EXIT SETUPS - INTRADAY EXECUTION
═════════════════════════════════════════════════════════════════════
BULLISH SETUP (Optimal on 5m/15m continuation):
ENTRY: 25,210.40 (Break above 25,200 resistance + candle close confirmation)
STOP LOSS: 25,140.00 (Beneath S1 by 0.20 risk buffer)
TARGET 1: 25,245.80 (35.4 points) | Scale 50% profits
TARGET 2: 25,335.40 (125 points) | Scale 30% profits
TARGET 3: 25,445.20 (234.8 points) | Hold 20% to runner with trailing stop at 25,380
RISK/REWARD: 1:6.2 ratio | Risk 70.40 to win 437.25
BEARISH SETUP (Optimal on 1h wedge apex rejection):
ENTRY: 25,160.50 (Break below support + rejection candle formation)
STOP LOSS: 25,235.00 (Above R1 by 0.20 risk buffer)
TARGET 1: 25,115.20 (45.3 points) | Scale 50% profits
TARGET 2: 25,010.60 (149.9 points) | Scale 30% profits
TARGET 3: 24,885.40 (275.1 points) | Hold 20% with trailing stop at 24,935
RISK/REWARD: 1:3.8 ratio | Risk 74.50 to win 283.25
═════════════════════════════════════════════════════════════════════
TIMEFRAME-SPECIFIC TACTICS
═════════════════════════════════════════════════════════════════════
5-MIN SCALPING: Monitor Rising Wedge squeeze. Target 15-22 points on wedge breakout. Tactical range 25,175-25,210. Volume surge = apex confirmation.
15-MIN SWING: Head & Shoulders potentially forming on rejection. RSI divergence at 25,245 = sell signal. Hold 45-65 points per trade.
30-MIN POSITION: Rising Wedge apex critical—breakout within 60 minutes. EMA 9/21 bullish cross validated. Harmonic ratios at R2 confluence.
1-HOUR MACRO: Gann 1x1 angle support at 25,010. Price must hold above 25,160 for continued upside. Ichimoku Tenkan-sen/Kijun-sen bullish alignment. Wyckoff markup phase accelerating.
4-HOUR BIAS: Daily pivot at 25,115 institutional support. Close above 25,245 = sustained rally to R3. Gann Square of 9 confluences: 24,885 (S3), 25,187.5 (current), 25,445 (R3). Below 25,160 = triangle breakout to downside.
═════════════════════════════════════════════════════════════════════
SESSION EXECUTION RULES
═════════════════════════════════════════════════════════════════════
✓ ENTRY ONLY on candle close confirmation (not wick touch)
✓ STOP always 0.20-0.40 points BEYOND level (never AT exact level)
✓ SCALE profits: Take 50% at R1/S1, 30% at R2/S2, trail 20% to R3/S3
✓ Rising Wedge apex breakout = directional confirmation signal
✓ IF price closes below 25,115 or above 25,245 = trend acceleration likely
✓ Maximum 3 trades per session. Exit after 2 consecutive losses
✓ Volume confirmation mandatory—low volume = false breakout likely
✓ Gann angle violation = position review trigger
═════════════════════════════════════════════════════════════════════
Risk Disclaimer: Analysis is educational. Past performance ≠ future results.
═════════════════════════════════════════════════════════════════════

US Tech 100 Cash (NAS100 / NASDAQ) Recorded: 11/17 – 1:52Thesis:
Price swept prior liquidity and printed aggressive delta absorption at the demand zone. Despite selling imbalance, buyers continued to lift the offer, signaling passive accumulation rather than continuation selling. This aligns with the current higher-timeframe trend structure.
Footprint Evidence:
Large negative delta absorbed at the lows (2.9K → 3.3K stacked).
No follow-through selling despite footprint imbalance.
Subsequent candle printed trapped sellers and initiated responsive buy programs.
Cumulative delta failed to make a lower low → bullish divergence.
Market Context:
NASDAQ remains in a trending environment with controlled pullbacks. Current positioning shows willingness from larger participants to defend the zone rather than liquidate. As long as price remains above the absorption block, bullish continuation remains the higher-probability play.
Trade Logic:
Entered on absorption confirmation. If price reclaims the imbalance above, I expect continuation toward liquidity at the previous session high.
Invalidation is below the absorption block, where passive buyers failed.
Summary:
Smart money absorbed sell pressure at demand, trapped shorts, and rotated the auction higher. Bias remains long until structural invalidation.


NAS100 Trade Plan: Counter-Trend Opportunity Into Friday CloseI’m currently watching the NASDAQ NAS100 📊 and looking for a potential setup as we head into the Friday close. The market has pushed into the weekly low, and I’m anticipating the possibility of a retracement, which could offer a counter-trend opportunity during the New York session. 🚀📉📈 All details are broken down clearly in the video — this is not financial advice. ⚠️

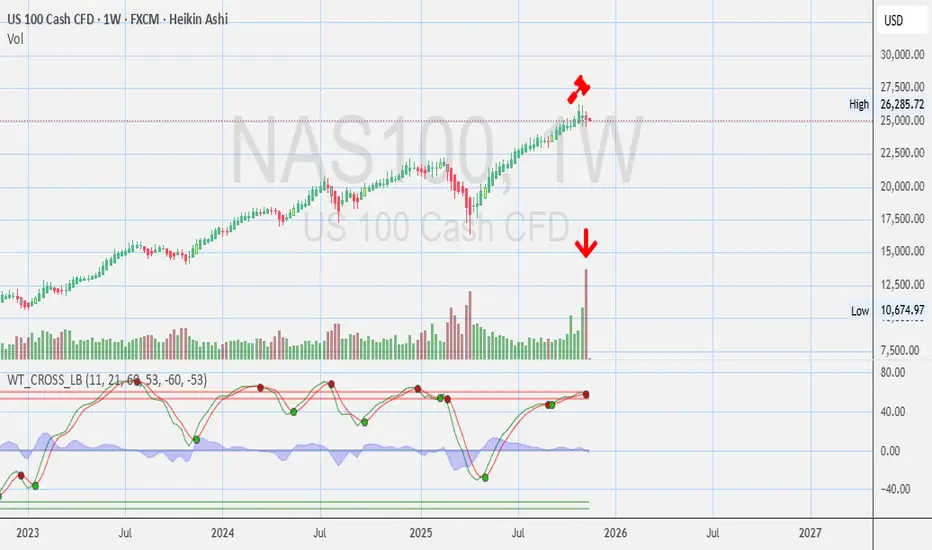
NASDAQ - Weekly Chart Opinions? Game Over ? or 🧠 Keep it on watch. Momentum shifting.
Any Opinions on HUGE VEEKLY VOLUME? Game Over? or?
⚠️ Disclosures :
This analysis is for informational purposes only and is not financial advice. It does not constitute a recommendation to buy, sell, or trade any securities, cryptocurrencies, or stocks. Trading involves significant risk, and you should consult with a qualified financial advisor before making any investment decisions. Past performance is not indicative of future results.
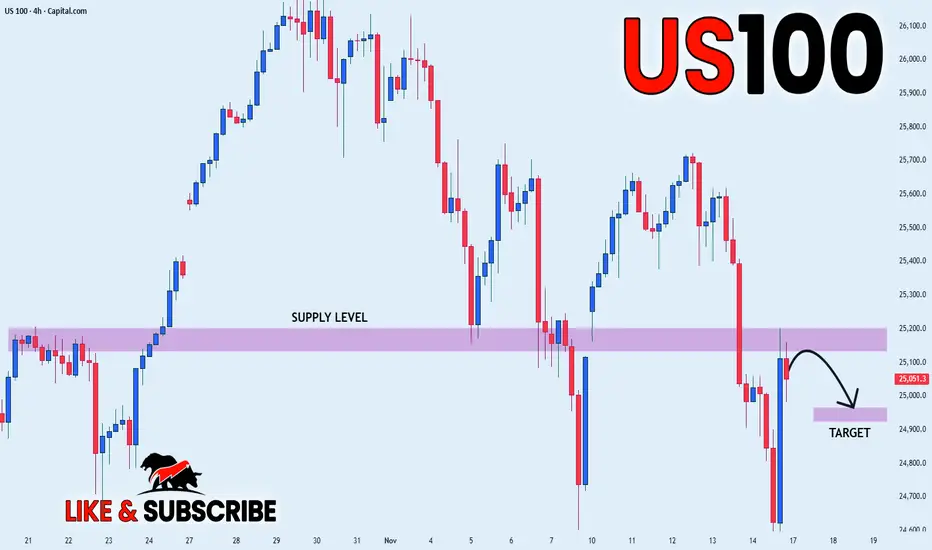
US100 LOCAL SHORT|
✅US100 price rejects the supply block and forms a clean displacement lower, hinting at a draw on liquidity toward the inefficiency below. A corrective retrace before targeting the marked zone is likely. Time Frame 4H.
SHORT🔥
✅Like and subscribe to never miss a new idea!✅
US100 | Bullish Reversal From Demand Zone — Targeting 25,200 LiqUS100 has reacted strongly from the 24,400–24,900 major demand zone, showing a sharp rejection and reclaiming structure. Price is now building momentum toward the 25,200 buy-side liquidity level.
A clean consolidation + breakout pattern is forming just below liquidity, indicating potential continuation to the upside.
Market Breakdown:
HTF Bias: Bullish
Demand Zone: 24,400 – 24,900
Intraday Target: 25,201 liquidity zone
Extended Target: 25,722 (major buy-side liquidity)
Confirmation: Break & retest above 25,100
Invalidation: Clean break below 24,950

Daq buyWhat is up ma friends? Happy Government reopen! Price flushed straight into a demand pocket after a steady selloff. The long triggers right as the candle sweeps the previous lows and snaps back. classic liquidity grab followed by an immediate reclaim.

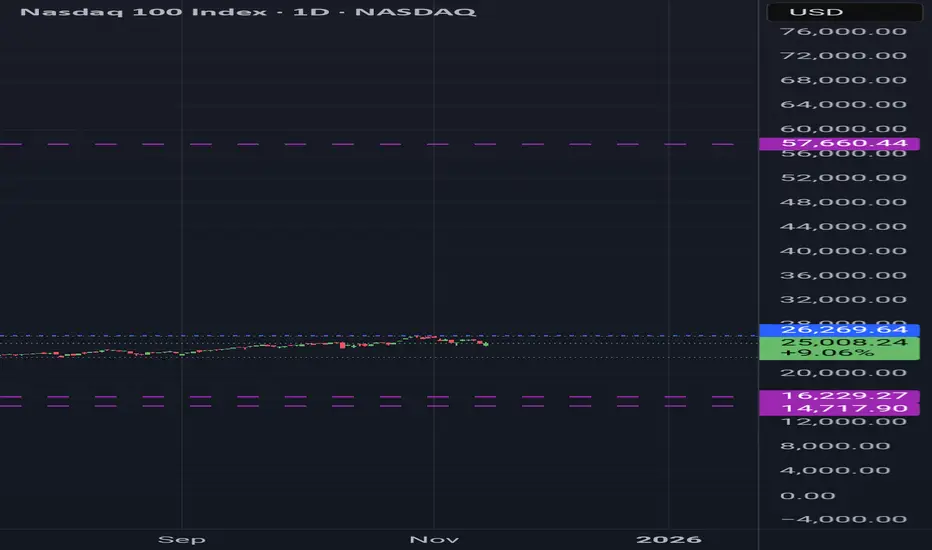
DECODED RESISTANCE ANALYSIS NDX (NASDAQ)DECODED RESISTANCE ANALYSIS NDX (NASDAQ)
After testing the support at $14,717 in Q4 2026 (as mentioned yesterday in my post), the stock market will rise to reach a new high over the next four years, with the DECODED resistance at $57,660, marking the end of the first Grand cycle.
Once the first Grand cycle ends, a huge correction will occur. The market will turn bearish and decline over the next 19 years, forming lower highs. During this period, the market will drop to the support level $16,229.
The second Grand pattern will form around 2050/2051.
I see what others call impossible, every support and resistance I draw is already written. I do not predict, I decode, even in uncharted areas.
This message is for educational purposes only. Always DYOR.
The Deeper Logic Behind Price Delivery (Nobody Talks About This)Most traders think some pairs are slow and others are fast.
But that belief is the reason they stay confused, lose trades, and can’t read delivery.
The truth is deeper, and once you see it, you can’t unsee it.
This is the real explanation behind timing, alignment, and phase delivery — the part nobody teaches.
Most traders think some markets “move fast” and other markets “move slow.”
That’s a surface-level observation. It sounds true, but it completely misses the deeper mechanics behind why price behaves the way it does.
The truth is this:
Markets don’t move fast or slow — markets move according to timing.
Every pair follows the same structural blueprint.
The only difference is where each pair is within its delivery cycle.
Price is always doing one of two things:
1. Delivering a continuation leg (impulsive, clean, fast movement)
2. Building the pullback leg (corrective, choppy, slower movement)
When a pair is fully aligned on the higher timeframe — when the trend, liquidity objectives, and structural breaks are all synchronized — the continuation phase will always look fast. It’s clean, directional, and decisive because the cycle is ready to deliver.
When a pair is still developing inducements, collecting liquidity, or forming the structure it needs for the next leg, it will naturally look slow or indecisive. Not because the pair is slow, but because the cycle is incomplete.
This is why one pair may be exploding while another is barely moving:
they’re simply in different phases of the same universal process.
Price is never random.
Price is never “lazy” or “weak.”
Price is simply obeying its timing.
Higher timeframes reveal that timing.
They show you:
• Whether continuation is ready
• Whether the pullback is still developing
• Whether liquidity has been engineered
• Whether the dominant leg is prepared to deliver
• Whether the cycle is aligned or still maturing
Lower timeframes only express what the higher timeframe already decided.
So the idea that “some pairs move fast and some move slow” is a misunderstanding. No pair is naturally fast or slow — every pair delivers exactly the same way, just not at the same time.
Fast movement = HTF alignment + continuation phase
Slow movement = HTF development + liquidity engineering phase
Once you understand timing, you stop comparing pairs by their speed and start reading them by their position in the cycle.
That’s when trading stops being guesswork and starts becoming recognition.
Because the deeper truth is simple:
Price isn’t unpredictable — traders are just unaware of what time it is.
-Do you view the market by timing or by “speed”?
Let me know — I read every comment.
#NAS100 #Education #SMC #MarketTiming #PriceAction #SmartMoney #Forex #Indices
NAS100US100 4H CHARTUS100 4H — Price reacting near 0.382 Fib (25,484) after impulsive move. Current zone may act as inducement for deeper liquidity sweep into 0.5/0.618 (25,394–25,304). Watching for displacement and BOS above 25,741 to confirm bullish intent. If price sweeps 0.618 and leaves bullish PA, that’s my POI for long setups.

$QQQ: Doubtful Low The QQQ is currently showing a lower high and a lower low, indicating a likely corrective Zig Zag pattern, with wave C only slightly longer than wave A. The 1x1 Extension is positioned at 586. Last Friday's promising bounce was halted at the horizontal resistance level of 613.
The RSI has reached the same area where previous bounces occurred during the rally from the April low. The bulls need to demonstrate that last Friday's low can serve as a springboard for a recovery.

BULLISH ON NASThe 4HR tf had a break of the low, created a new low with a morning star that gave us a change of character toward the upside and pulled back with 2 bearish rejecting candles and now is starting to push up without a bullish engulfing candle. Details are more visible on the 2Hr tf.

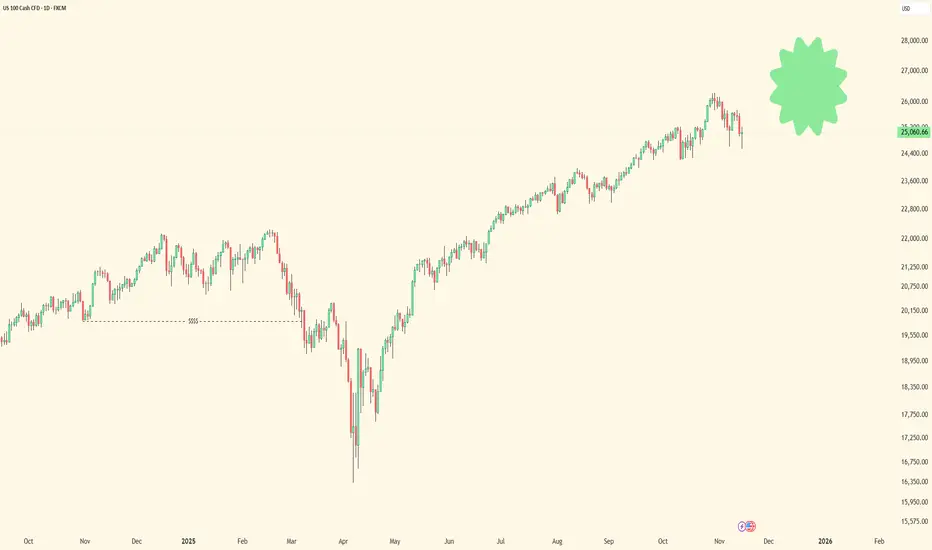
DECODED ANALYSIS OF NDX (NASDAQ) DECODED ANALYSIS OF NDX (NASDAQ)
The quarterly first grand pattern is currently in its second last stage, a dip is required, after which a significant upward move will follow.
The key decoded support level is $14,717 in Q4 2026.
Once this grand pattern completes, approx 70% correction will occur, initiating a new grand pattern.That final cycle takes decades to complete it's uptrend.
This message is for educational purposes only, always DYOR.

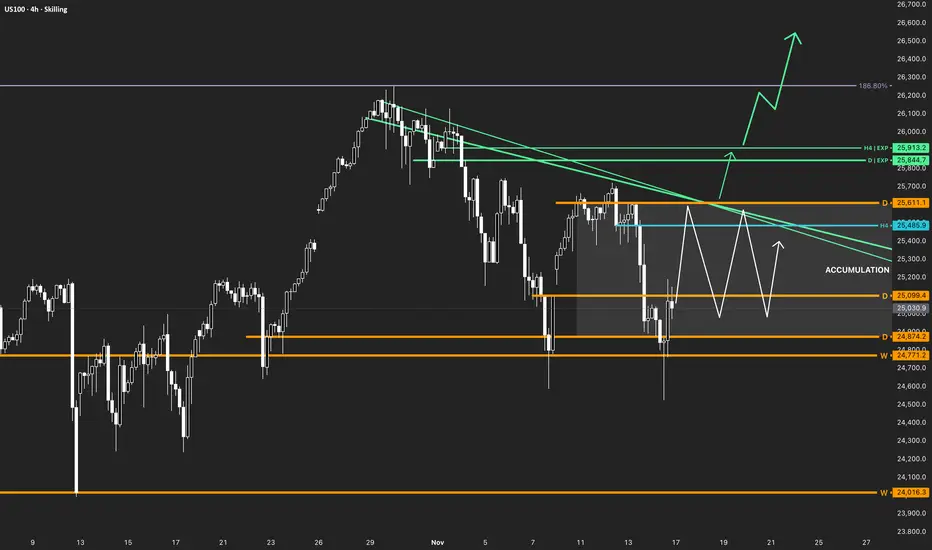
NASDAQ100 (US100) | Accumulation Phase in the Bullish trendHey Traders,
This is a zone where the market usually changes direction a lot, so be careful.
Trend: Primary Bullish
Weekly: 🟢
Daily: 🔴
H4: ⚪️
Phase: Accumulation
Bullish: D Close > 25,611.1 | → 25,844.7 → 25,913.2
Bearish: W Close < 24,016.3
Be Patient!
Peter
nas100 4h🔹 Overall Outlook and Potential Price Movements
In the charts above, we have outlined the overall outlook and possible price movement paths.
As shown, each analysis highlights a key support or resistance zone near the current market price. The market’s reaction to these zones — whether a breakout or rejection — will likely determine the next direction of the price toward the specified levels.
⚠️ Important Note:
The purpose of these trading perspectives is to identify key upcoming price levels and assess potential market reactions. The provided analyses are not trading signals in any way.
✅ Recommendation for Use:
To make effective use of these analyses, it is advised to manually draw the marked zones on your chart. Then, on the 15-minute time frame, monitor the candlestick behavior and look for valid entry triggers before making any trading decisions.
NAS1001. HTF crt forming + key level
2. LTF crt + csd
Entry on the second candle of a crt (AMD) Manipulating waiting for distribution

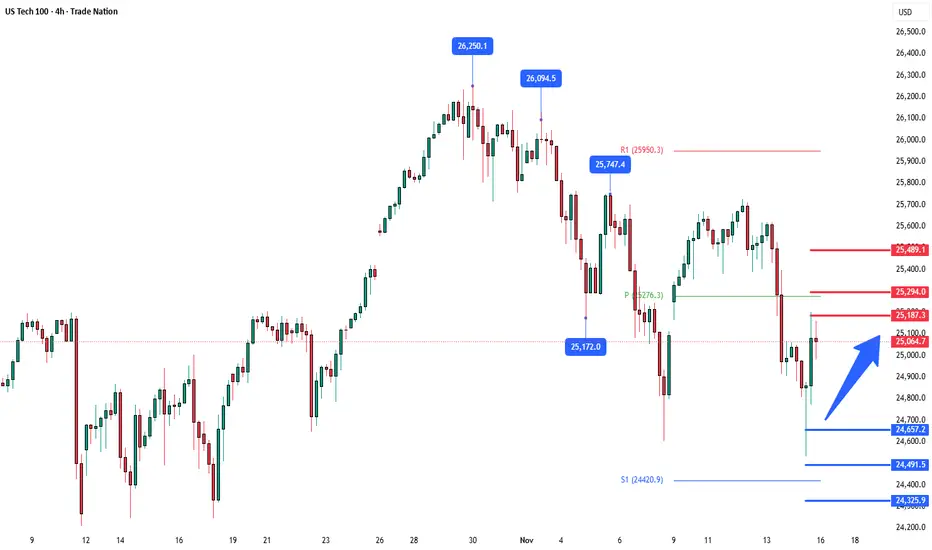
NSDQ100 The Wek Ahead, Key Trading LevelsKey Support and Resistance Levels
Resistance Level 1: 25180
Resistance Level 2: 25300
Resistance Level 3: 25500
Support Level 1: 24655
Support Level 2: 24490
Support Level 3: 24330
This communication is for informational purposes only and should not be viewed as any form of recommendation as to a particular course of action or as investment advice. It is not intended as an offer or solicitation for the purchase or sale of any financial instrument or as an official confirmation of any transaction. Opinions, estimates and assumptions expressed herein are made as of the date of this communication and are subject to change without notice. This communication has been prepared based upon information, including market prices, data and other information, believed to be reliable; however, Trade Nation does not warrant its completeness or accuracy. All market prices and market data contained in or attached to this communication are indicative and subject to change without notice.
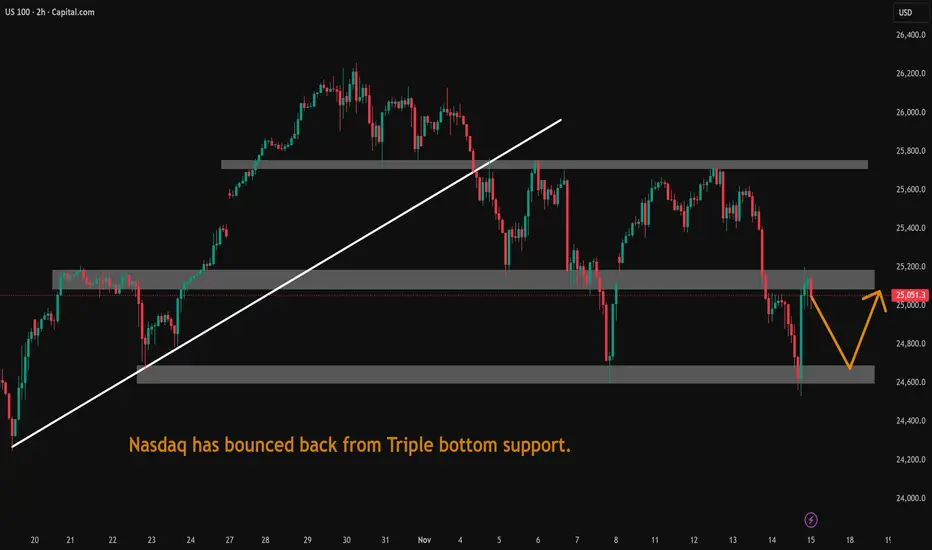
Nasdaq has bounced back from Triple bottom support.Nasdaq has bounced back from Triple bottom support. Next week may also be volatile.
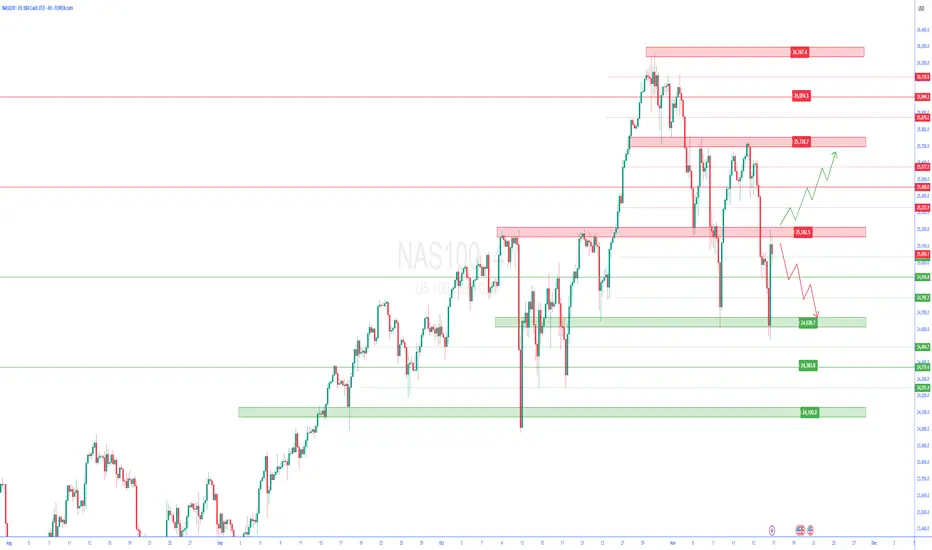
NAS100 8H - real correction or just another dramatic rehearsal?NAS100 held the 24850–25000 demand zone with precision, forming a classic false break followed by a sharp recovery back into the rising channel. Volume expansion on the reversal, strong lower wicks, and sustained support at the dynamic trendline all signal that the medium-term bullish structure remains intact. The path toward 26300 inside the channel stays open, and a breakout above this level unlocks the next target at 27300 - the upper boundary of the current impulse.
The NAS100 index represents the core of the US tech sector, reflecting demand for IT, cloud infrastructure, AI technologies, communication platforms, and high-growth digital companies.
Fundamentally , the backdrop on November 15 strengthens the bullish case: the market continues to price in a softer Fed stance, bond yields are easing, major tech companies are raising guidance, and demand for AI-driven solutions remains stable. With inflation trending into a manageable range and expectations for improved credit conditions rising, liquidity is rotating into high-beta assets, providing structural support and limiting corrective depth. Strong margins, solid earnings and resilient tech demand continue to anchor the broader uptrend.
As long as price holds above 24850–25000, the bullish scenario remains active. A confirmed breakout above 26300 opens the way toward 27300. Any controlled pullback into 24850–25000 remains a buy zone within the prevailing trend.
NASDAQ likes to overact, but more often than not it’s simply warming up before the next performance.

US100 Free Signal! Sell!
Hello,Traders!
US100 is reacting inside the horizontal supply, where bearish orderflow continues to cap every rally attempt. With liquidity sitting below the prior swing lows, price is positioned for a corrective push lower.
--------------------
Stop Loss: 25,210
Take Profit: 24,901
Entry Level: 25,048
Time Frame: 2H
--------------------
Sell!
Comment and subscribe to help us grow!
Check out other forecasts below too!
Disclosure: I am part of Trade Nation's Influencer program and receive a monthly fee for using their TradingView charts in my analysis.

Us100 on bullishDouble bottom has confirmed following with shooting star and a bullish engulfer on a h4 timeframe
