45min 200SMA broke, next 1hr 200SMA UP TO 18550!Shorts going to cover, also earnings and other good stuff happened this week.
Apple is about to break resistances upwards, it has lot of room to go.
NAS100 trade ideas


NASDAQ - How Far Can It Bounce?After the massive selloff of recent weeks, it seems that a countermove is brewing in the NASDAQ. However, bulls should consider that there are now a lot of resistances to overcome. A recovery is therefore likely to be much bumpier than most investors hope for. For long trades, it's advisable to initially choose modest targets.

NASDAQ IS BACK AGAIN DOINTNasdaq is always up to us to know where it is about to go, and now see....
Now we taking buys to the PSTG 1 AND 2

DEMO: ICT liquidity sweep, market structure shift, fvg for entryDEMO: ICT liquidity sweep, market structure shift, fvg for entry

NASDAQ100 │ NAS100 │ MONTHLY OUTLOOK │ BULLISH RUN INCOMINGMonthly-timeframe
After an extensive bull run breaking all-time highs since December 2023, the bulls are finally taking a breather and price is retracing towards November 2021 all-time highs, will this old level of resistance hold price as support? Time will tell but this market is extremely bullish and unless a crash is due, this is just an opportunity to buy at discounted levels
Reference
As seen in the chart below, not even the crash in 2020 could hold price below the 2018 highs.
Daily-timeframe
A clear down trend has commenced with virtually no pullback, further supporting my theory that the market is just pulling back from the over 100-day Bull Run we had.
Four-hour timeframe
The motive is clear, price is trending beautifully to the downside and we can take advantage of the need of the market to go lower on the 15-minute timeframe thereby taking advantage of this four-hour trend
Final Thoughts
Do not be in a rush; wait for a higher timeframe to switch bullish once we reach our POI. No need to catch a sniper entry in runs like the one coming up

NAS100USD - Bullish TradeNAS100USD in Bearish trend depicted Trend Reversal Pattern along with Bullish Divergence. This indicates Advancing Phase ahead.

NAS100I have spotted a chart pattern on the daily timeframe ,price has gone further to break out of the neckline .i anticipate Nas price to consistently break the lows on the daily timeframe, in the mean time i will be wait for prices to pull back into 17800 .as sellers will like step in to drive price lower

US 100 - Ranges overview The breaker (yellow box) annotated yesterday held perfectly and we are back towards the LTF highs - and the overall lows of the HTF range. (dotted alert lines)
No need to try and predict the market that is not our job. So IF you feel FOMO don't get involved with the market and wait for it to show you its hand.
Plan is clear...IF we hold the current levels we should consider this run on the sellside liquidity as the deviation before heading back towards the highs of the HTF range
IF we fail to hold these current levels we will continue lower towards the sellside liquidity from the previous month.
NO NEED TO FRONT RUN THE MARKET...WAIT FOR IT... PLAN IT AND ACT UPON IT
Stay safe and never risk more than 1-5% of your capital per trade. The following analysis is merely a price action based analysis and does not constitute financial advice in any form.

#US Nas100 #nazdaq #trade #stockmarketThe NASDAQ index has a crucial support level at $17,000, which has held strong in recent trading sessions. In the 3-hour (3H) time frame, there is a notable divergence in the Relative Strength Index (RSI), indicating potential weakening of the current trend. Concurrently, a double bottom pattern has formed after the completion of a five-wave pattern, suggesting a potential trend reversal to the upside. Traders should closely monitor price action around the $17,000 level for confirmation of a trend change.

NAS 100 I Potential pullback and long from supportWelcome back! Let me know your thoughts in the comments!
** NAS100 Analysis - Listen to video!
We recommend that you keep this pair on your watchlist and enter when the entry criteria of your strategy is met.
Please support this idea with a LIKE and COMMENT if you find it useful and Click "Follow" on our profile if you'd like these trade ideas delivered straight to your email in the future.
Thanks for your continued support!

The idea of a bullish scenario! Think about structureEsteemed analysts and traders,
I hope this correspondence finds you in good health and high spirits, prepared to tackle the upcoming week with renewed energy. I extend my best wishes for your continued success in all your business endeavors. It is worth noting that success in trading is largely dependent on the consistent definition and adherence to one's own rules.
As a supporter of the Elliott Wave Principle, I consider this methodology an invaluable tool for market analysis. After three years of personal experience, I have developed my approach by combining this principle with meticulous consideration of different market scenarios. I strive to avoid market surprises by maintaining a range of market prospects, which enables me to recognize the market structure forming with 100% accuracy.
I am pleased to share my analysis with you, with the caveat that I do not provide buy or sell signals. My perspective on idea analysis is entirely impartial, and if my analysis meets your standards, it may serve as a guide to making an informed decision.
For your reference and comparison, I have attached my previous analysis of the same market. All the details of my analysis are clearly labeled for ease of comprehension. Nonetheless, familiarity with the Elliott Wave Principle theory would facilitate an understanding of the analytical idea.
My study of the Elliott Wave Principle took nearly three years, during which my understanding and experience with this invaluable tool have grown. My progress thus far is a testament to the legacy of Ralph Nelson Eliot, whose genius has provided the foundation for my achievements. May he rest in peace.
I express my gratitude for your continued support and kindness, and welcome your comments and critiques.
May my analysis be a valuable asset to your business journey, and I remain sincerely yours,
Mr. Nobody
The bearish scenario of any corrective pattern and trend continuation

NAS100 LONGLooking for NAS100 to complete what I believe to be an intraday inverse H&S. Earnings could lead to a bounce off the current lows.

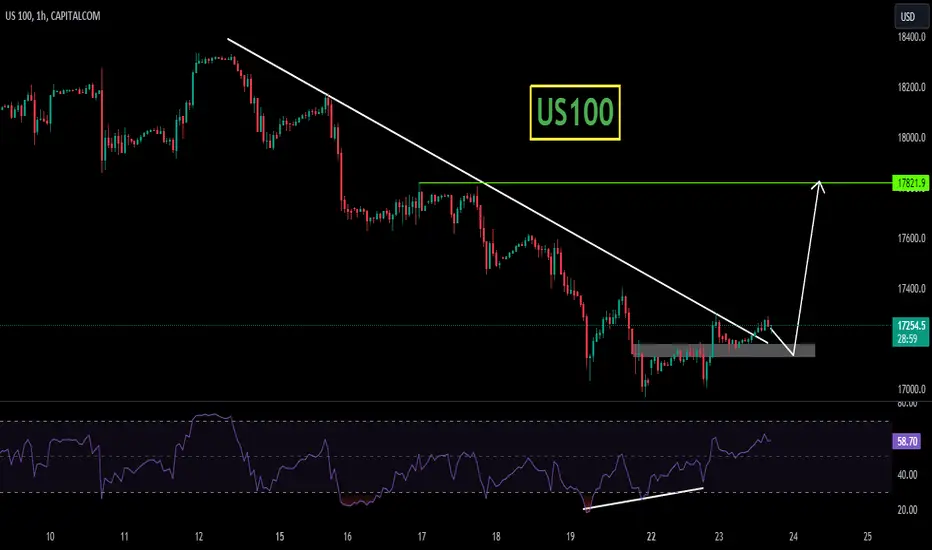
US100US100 is trading in falling wedge pattern. The price was reacting well the support and resistance of wedge.
Currently the price has given the massive breakout from falling wedge and after successful retest of the level will be bullish signal and seems like the price may go for another leg higher.
If the breakout sustain to upside the optimum target could be 17850
What you guys think of this idea?
NASDAQ STAYING DOWN OR BREAKBased on 1h we can see it's not a good sign for NASDAQ since it keeps rejecting at the same area . But the New York session has not started yet , we still have a chance to see where the price will go. There's two scenarios for NASDAQ;
1. Breaking the Fibb OTE 1h and confirm the hourly rejection
2. Bouncing, at the golden time around NY Sessions( my secret recipe )
.
Remember, today will be a bumpy ride , with lots of high catalyst news , it's offers an opportunity
.
.
Stay Safe
X.CO
.
PS. If u want to request analysis DM for pricing, thank u

4/23/2024 NASDAQ PERSPECTIVEPOI areas for today. I'm waiting for price to take liquidity and react to these areas. I shall personally take entries dependent on how price reacts in these zones. If price takes liquidity on the 1m timeframe in any area and shoots towards a POI, then that POI is more then likely invalidated. If price slows down before reaching a POI, then it's more then likely valid. Trade at your own risk. Good luck today!

NASDAQ Relief rally to 18000 ahead?Nasdaq (NDX) finally hit yesterday our long-term bearish Target (17130), which we called a while ago (March 12, see chart below) but was postponed due to the Double Top formation:
The index is now on a mixed sentiment as even though it is on a correction sequence below the 1D MA100 (green trend-line), the 1D RSI hit the 30.00 oversold limit as this Bearish Leg almost completed a -8.50% decline.
During the previous Bearish Leg of the multi-month Channel Up pattern, the index had a relief rally towards the 0.786 Fib, after an initial -8.50% decline. We can see that this took place on the 0.3 Fib (blue) from the top.
As a result we expect a short-term (at least) bounce to 18000. As long as the index doesn't break above the (blue) Channel Down and in particularly close a 1D candle above the 0.786 Fib (18150), we can expect a Lower Low after this relief rally. If it does close above it, we will resume most likely the long-term bullish trend earlier and we will update our position.
-------------------------------------------------------------------------------
** Please LIKE 👍, FOLLOW ✅, SHARE 🙌 and COMMENT ✍ if you enjoy this idea! Also share your ideas and charts in the comments section below! This is best way to keep it relevant, support us, keep the content here free and allow the idea to reach as many people as possible. **
-------------------------------------------------------------------------------
💸💸💸💸💸💸
👇 👇 👇 👇 👇 👇

US100 - sell trade 1/2 hi this is a US100 sell trade have 2 probability for sell this si first one ! dont overcomplicate your trading style

Indices higher with the Vix as Support 🧐Hello traders.. kicking off the week here the stock indices are up alongside the USD strength. We have the vix which sold off dring the london session and this tells us that sentiment is leaning towards risk on as call options are being bought. The Nasdaq is moving up here and we could mirror some of the candles to the left handside that we observed during Friday of last week. We could move up to 17,303 or at least towards there since we have clean traffic on the 1hr chart and 4hr. Oil has continued to selloff as I anticpated and gold has sold off even more denoting some risk-off sentiment from commodities. Bond yields are up slightly denoting some risk on sentiment to begin the week here. The overall trend for yields has been up the last few weeks. It will be important to observe how candles close around 17,164 daily level as this will tell us of impending strength or weakness in Nasdaq. We may retreat towards 17,070 if price cannot sustain around 17,164 daily level.

Nasdaq prepares for the bounceVolatility had grown across all indices indices. The Nasdaq is still lagging after a spectacular drop in NVDA, AMD, and other related stocks.
There is a possibility to observe a sharp pullback for Nasdaq, which would unlikely overwrite the historical highs, but may cover most of the recent decline: that's the usual behavior of the market in the context of rising volatility and a potential bear phase.
Market structure points to a potential beginning of the upswing, which may give a point of entry to the long side with very limited risk and extended potential reward.

NAS Outlook Hello Traders,
Here we are looking at NAS from the Daily timeframe and I have identified two possible scenarios that could play out this week.
Scenario 1 is that if price closes above $17600 - $17400 then that will push price further to the upside back to $18k area
Scenario 2 is that is price closes below this $17600 - $17400 area then that will indicate a further push to the downside for price.
Good luck all and trade responsibly!!
