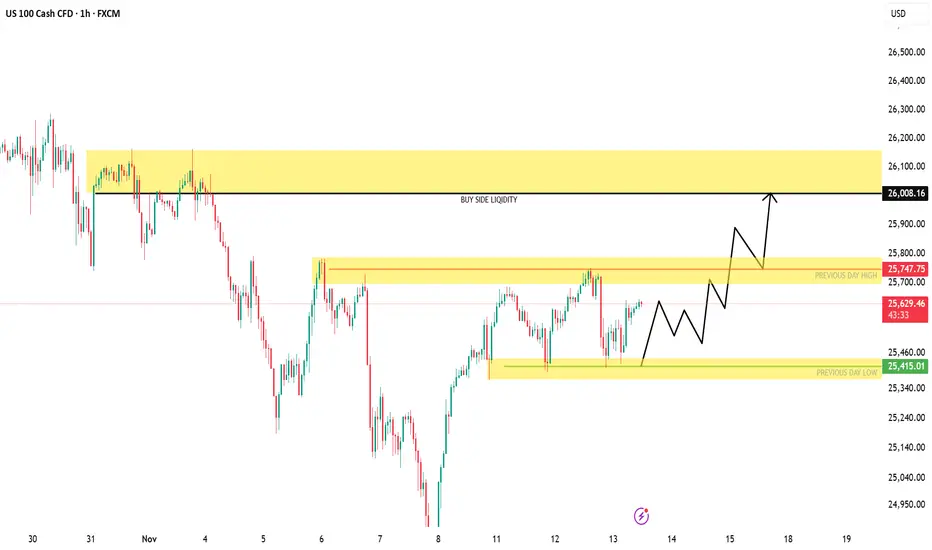
US100 | Building Liquidity for a Potential Push Toward 26,000NASDAQ (US100) is consolidating between 25,400–25,750, forming a potential accumulation zone below short-term liquidity. A clean break and retest above 25,750 could trigger a bullish expansion toward the 26,000–26,200 range, where major buy-side liquidity sits.
Market Structure:
Bias: Bullish (HTF structure shifting higher)
Key Demand Zone: 25,400 – 25,450
Breakout Zone: 25,750
Target Zone: 26,000 – 26,200
Invalidation: Below 25,400
Concepts: Liquidity Grab | Market Structure Shift | Demand Zone | Breaker Block | Smart Money Flow
Trade ideas
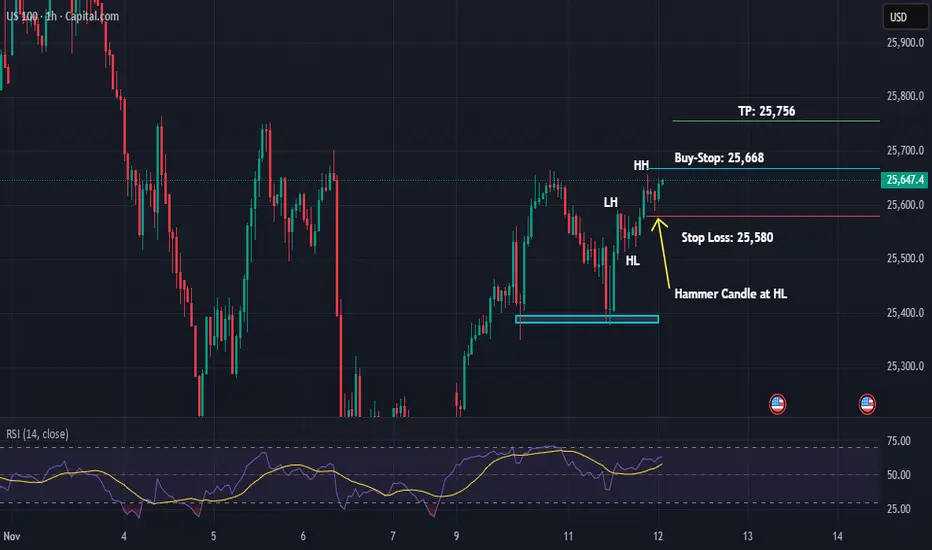
US100 Buy-Stop Setup on 1HNasdaq is in a Bullish Trend on 1H timeframe... It looks like it can go further up.
Let's take a 1:1 Long Trade here.
NASDAQ IS BEARIcHcheck out this , on the higher time frame the price seems to be bearish and the market couldn't puch higher than the previous Lower high , so we expect the market to rebalance after grabbing enough liquidity

US100 PRICE MAY DECLINE!The H4 chart shows there could be a good probability for a sell as price just reacted off 25,705 a sell opportunity is envisaged. I anticipate price to decline. I’m selling short US100

US NAS 100Preferably suitable for scalping and accurate as long as you watch carefully the price action with the drawn areas.
With your likes and comments, you give me enough energy to provide the best analysis on an ongoing basis.
And if you needed any analysis that was not on the page, you can ask me with a comment or a personal message.
Enjoy Trading ;)

NAS100 Trade Set Up Nov 12 2025Price trading above PDH and has a daily gab above to fill but first i would want to see a sweep of London lows/SSL before looking for 1m-5m IFVG/CISD to continue higher to sweep BSL and fill the daily imbalance

Nasdaq Holds Firm After Support Rebound| Focus on 25820 BreakoutUSNAS100 | Overview
The price retested our support at 25430 and bounced perfectly, just as outlined in the previous analysis.
After reaching the resistance zone, the index is now consolidating between 25700 and 25820, awaiting a decisive breakout.
A 1H close above 25820 would confirm bullish continuation, targeting 25960 and 26170.
However, a 4H close below 25700 would indicate the start of a bearish correction, with downside potential toward 25570 and 25430.
Pivot Line: 25700
Resistance: 25820 · 25960 · 26170
Support: 25570 · 25430 · 25230
Outlook:
USNAS100 remains bullish while above 25700, with upside targets at 25960–26170.
A confirmed 4H close below 25700 would shift the short-term tone to a bearish correction toward 25570–25430.

Will NAS100 Sustain Its Bullish Momentum After the Pullback?NAS100 🚀 Bullish Swing Setup | SuperTrend Pullback & Layered Entry Strategy
🎯 TRADE IDEA: NAS100 (US100) BULLISH SWING
Capitalize on a structured pullback in the NASDAQ 100! This plan leverages a proven indicator confluence for a high-probability long opportunity.
📊 ANALYSIS & CONFIRMATION:
Trend: Primary Bullish Trend is intact. ✅
Trigger: Price is pulling back into a demand zone, offering a favorable risk-to-reward entry.
Indicator: The SuperTrend ATR Line is acting as dynamic support on the 4H/Daily timeframe. A bounce from this level confirms our bullish bias.
⚡ STRATEGY: "THE THIEF" LAYERED ENTRY
This method uses multiple limit orders to average into a position, perfect for volatile markets like the NASDAQ.
Entry Zone: Look for entries between 25,200 - 25,600
Layer Example:
🟢 Limit Order 1: 25,600
🟢 Limit Order 2: 25,400
🟢 Limit Order 3: 25,200
👉 You can adjust the number of layers and prices based on your capital and risk appetite.
❗ RISK MANAGEMENT:
Stop Loss (SL): A decisive break below 24,800 would invalidate the bullish structure.
⚠️ IMPORTANT NOTE: This is MY protective stop. Dear Thief OG's 👑, you MUST adjust your position size and SL based on your personal risk management strategy. Protect your capital first!
🎯 PROFIT TARGETS:
Primary Target: 25,600 (Initial resistance & profit-taking zone).
Key Reasoning: We anticipate a reaction here due to:
Moving Average resistance.
Potential overbought conditions on lower timeframes.
A "trap" for late buyers.
👉 Smart Move: Consider taking partial profits at 25,600 and trailing your stop for the remainder. Escape the trap with your profits! 💰
⚠️ REMINDER: Dear Thief OG's 👑, your Take Profit (TP) is your own decision. Secure gains based on your trading plan and market behavior.
🔍 RELATED ASSETS & MARKET CORRELATION:
Watching these related instruments can provide confirmation and a broader market view.
TVC:DXY (U.S. Dollar Index): 🟡 NEGATIVE CORRELATION
A weakening Dollar ( TVC:DXY DOWN) is generally bullish for Nasdaq. If the Dollar is falling, it adds confidence to this long thesis.
USTECH (CFD on Nasdaq 100): 🟢 DIRECT CORRELATION
Moves in sync with NAS100. Perfect for cross-verifying price action and volume.
NASDAQ:AAPL , NASDAQ:MSFT , NASDAQ:TSLA (Mega-Caps): 🟢 HIGH IMPACT
These heavily weighted Nasdaq components drive the index. Bullish momentum in these stocks supports a rising NAS100.
FOREXCOM:SPX500 (S&P 500): 🟢 POSITIVE CORRELATION
A strong S&P 500 often lifts the Nasdaq. Monitor for overall U.S. market strength.
💬 Let me know your thoughts in the comments!
What's your entry strategy for the NAS100 this week?
#NAS100 #US100 #TradingView #SwingTrading #Bullish #SuperTrend #TradingStrategy #IndexTrading #LayeredEntry #ThiefStrategy

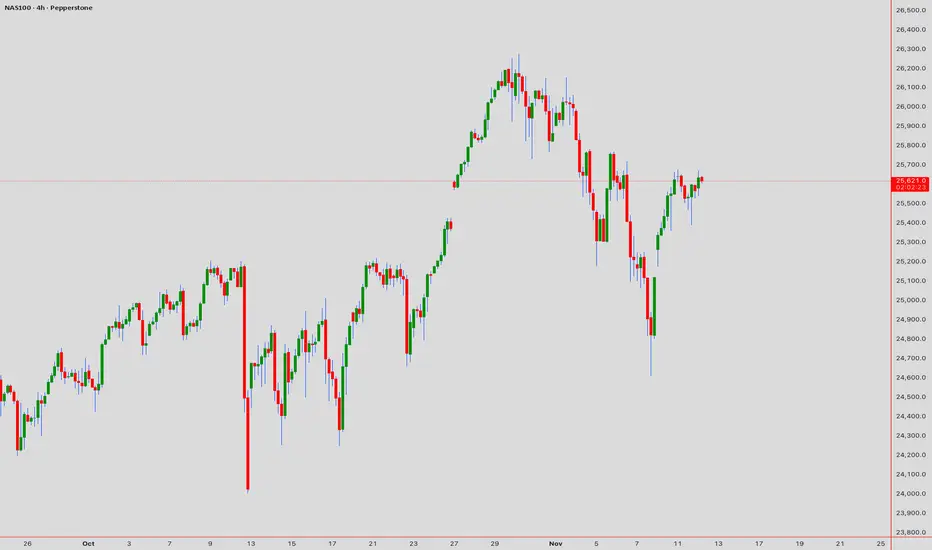
NAS100: Threshold Analysis & Decision FrameworkNAS100: Threshold Analysis & Decision Framework | November 12
Reference Point: 25,625 | 08:45 UTC+4
MARKET PREMISE
The Nasdaq 100 has stabilized within a confined bandwidth, presenting traders with a defined set of bifurcated outcomes. The micro-structure reveals a market in the midst of accumulation, where directional bias remains contested between competing institutional flows.
TECHNICAL ASSESSMENT MATRIX
Primary Trend (Dow Theory Lens): Uptrend remains intact; lower-bound support at 25,500 preserves bullish structure. Failure to maintain this floor signals potential regime shift.
Pattern Development: A Symmetrical Triangle is in formation across the 1H/4H timeframes. Contraction suggests breakout imminent—directional confirmation required.
Elliott Wave Interpretation: Wave IV consolidation underway. Upon completion, Wave V upleg anticipated toward fresh resistance territories.
Harmonic Configuration: Potential bearish Bat pattern exists if price recedes; conversely, completion of bullish Crab pattern supports upside continuation above 25,750.
INDICATOR CONFLUENCE TABLE
| Indicator | Timeframe | Status | Signal |
|-----------|-----------|--------|--------|
| Ichimoku Kumo | 4H | Price-Kumo Contact | Neutral-to-Bullish |
| RSI(14) | 4H | ~50 Median | Energy Stored |
| VWAP Proximity | Intraday | At Fair Value | Equilibrium |
| EMA(50) Stack | 1H | Bullish Alignment | Support Intact |
| Bollinger Squeeze | 30M | Band Tightening | Volatility Expansion Pending |
OPERATIONAL TRADE MATRIX
Bullish Engagement (Primary):
- Activation: Hourly close above 25,700 (Triangle apex breakout)
- Entry Coordination: 25,720–25,750
- Protective Stop: 25,580
- Profit Sequencing: 25,900 (T1) → 26,150 (T2)
- Risk-Reward Ratio: 1:2.4
Bearish Contingency (Secondary):
- Activation: Sustained close below 25,500 (Foundation breach)
- Entry Coordination: 25,480–25,450
- Protective Stop: 25,650
- Profit Sequencing: 25,250 (T1) → 25,000 (T2)
- Risk-Reward Ratio: 1:1.8
GANN TEMPORAL OVERLAY
Key cyclical windows on the 4D chart suggest consolidation resolution within the 12–15 hour window. Volume profile at the 25,650 level indicates potential liquidity pool; breakouts through this zone warrant heightened position management.
TRADE DIRECTIVE: Await breakout confirmation with concurrent volume expansion. Triangle compression suggests potential catalytic move. Disciplined position-sizing essential given binary outcome structure.
US NAS 100With your likes and comments, you give me enough energy to provide the best analysis on an ongoing basis.
And if you needed any analysis that was not on the page, you can ask me with a comment or a personal message.
Enjoy Trading ;)

US NAS 100Preferably suitable for scalping and accurate as long as you watch carefully the price action with the drawn areas.
With your likes and comments, you give me enough energy to provide the best analysis on an ongoing basis.
And if you needed any analysis that was not on the page, you can ask me with a comment or a personal message.
Enjoy Trading ;)

buy to sellLooking to buy from demand zone → targeting imbalance fill at 25,900.
Will look for short opportunities once price reaches IMB/supply zone.

US100 – Bullish Reversal Setup-H4: Turning bullish with a new high at 25,667.
Pullback: Formed a lower high, now H1 shifting bullish again.
Plan: Looking for buys above 25,542, SL below last H1 LH.
Adjustment: If another H1 LH forms and breaks upward, trail SL for tighter risk.
-Fundamental: Shutdown-end hopes , supporting the bullish scenario.

NQ1 high probable shortsNas should be on a correction today for the H1 and H4 sells. I anticipate nas either breaking its bullish level where sellers sit in the next 2-3 days or continuing down for the next week or two.

NAS100 CONTINUE TO BULLISH RALLYTechnically:
1) Trendline broke and then retest
2) Support becane resistance
3) no bearish divergence

NASDAQ Long ConfirmationsShould price pullback to dig deeper into the highlighted support, look for long confirmations.

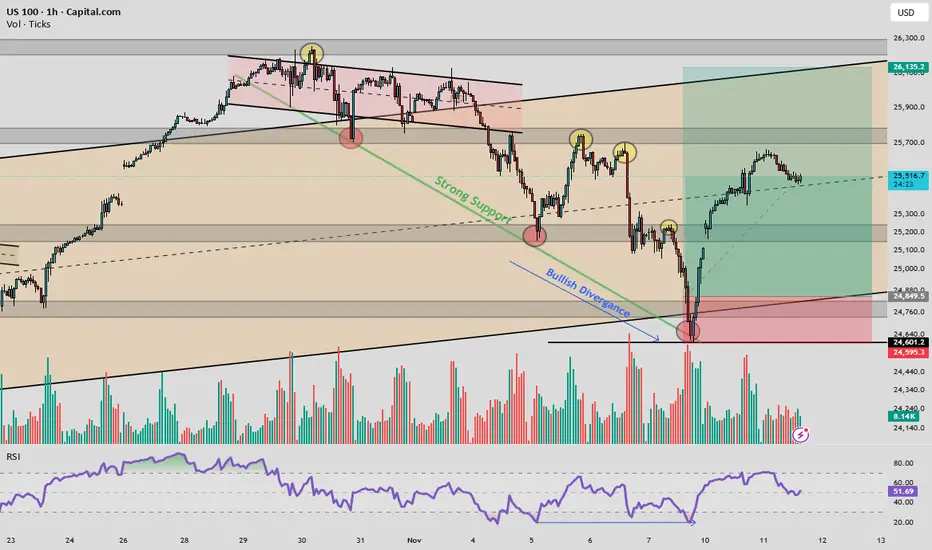
US100: Bullish Divergence Meets Institutional SupportUS100 1H Analysis – Bullish Divergence at Strong Support
Price is compressing within a descending channel, currently testing a multi-touch support zone around 24,730–24,490. Volume shows signs of accumulation, and RSI reveals bullish divergence, hinting at potential reversal. If support holds, a bounce toward 25,900–26,250 is likely. Breakdown below 24,490 invalidates the setup.
Follow @GoldenZoneFX for more content and valuable insights.
US NAS 100Preferably suitable for scalping and accurate as long as you watch carefully the price action with the drawn areas.
With your likes and comments, you give me enough energy to provide the best analysis on an ongoing basis.
And if you needed any analysis that was not on the page, you can ask me with a comment or a personal message.
Enjoy Trading ;)

NAS100 Trade Set Up Nov 11 2025Price swept PDH and inverted a 4h FVG plus broke structure to the downside on the 1h so i will want to see a internal BSL sweep to then see a continuation lower to SSL and possibly 1h FVG

NSDQ100 key trading levelsKey Support and Resistance Levels
Resistance Level 1: 25180
Resistance Level 2: 25300
Resistance Level 3: 25500
Support Level 1: 24655
Support Level 2: 24490
Support Level 3: 24330
This communication is for informational purposes only and should not be viewed as any form of recommendation as to a particular course of action or as investment advice. It is not intended as an offer or solicitation for the purchase or sale of any financial instrument or as an official confirmation of any transaction. Opinions, estimates and assumptions expressed herein are made as of the date of this communication and are subject to change without notice. This communication has been prepared based upon information, including market prices, data and other information, believed to be reliable; however, Trade Nation does not warrant its completeness or accuracy. All market prices and market data contained in or attached to this communication are indicative and subject to change without notice.

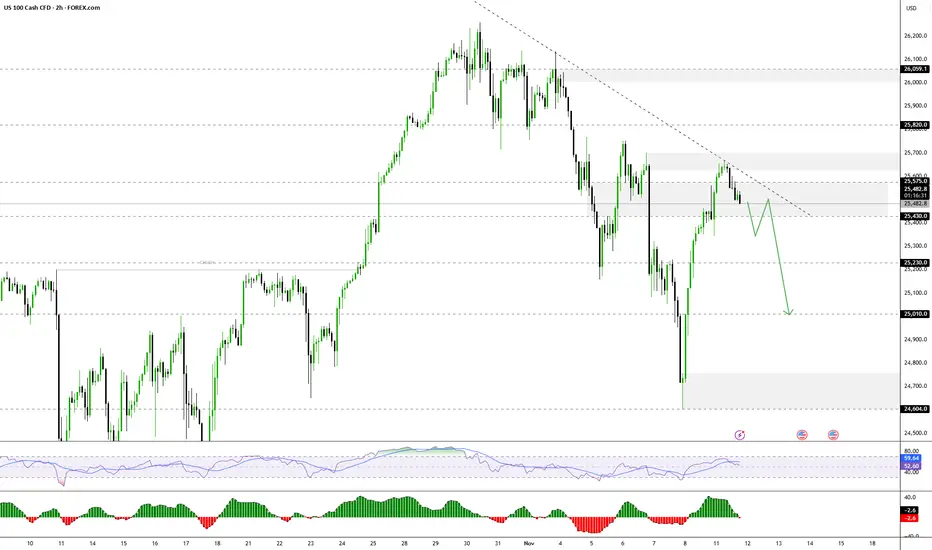
Nasdaq Potential for Further CorrectionThe NASDAQ index currently appears to be in a short-term correction, with the price likely to retest 25430 from 25570 before further movement.
- Above 25430–25575: Bullish continuation towards 25700 → 25820 → 25960.
- Below 25430: Bearish momentum is likely towards 25230 → 25010.
Wall Street Tech Rally Resumes | USNAS100 Holds Firm Above 25440USNAS100 – MARKET OUTLOOK | Bullish Bias Above 25440
The Nasdaq continues to trade with bullish momentum after stabilizing above 25440, supported by strength in tech stocks and improving market sentiment.
Above 25440: Bullish continuation toward 25700 → 25820 → 26170 (ATH).
Below 25430: Bearish correction possible toward 25230 → 25000 → 24760.
Pivot: 25440
Support: 25230 · 25000 · 24760
Resistance: 25570 · 25700 · 25820
USNAS100 remains bullish while above 25440, but a confirmed 1H close below 25430 could trigger a short-term bearish correction toward 25230–25000.

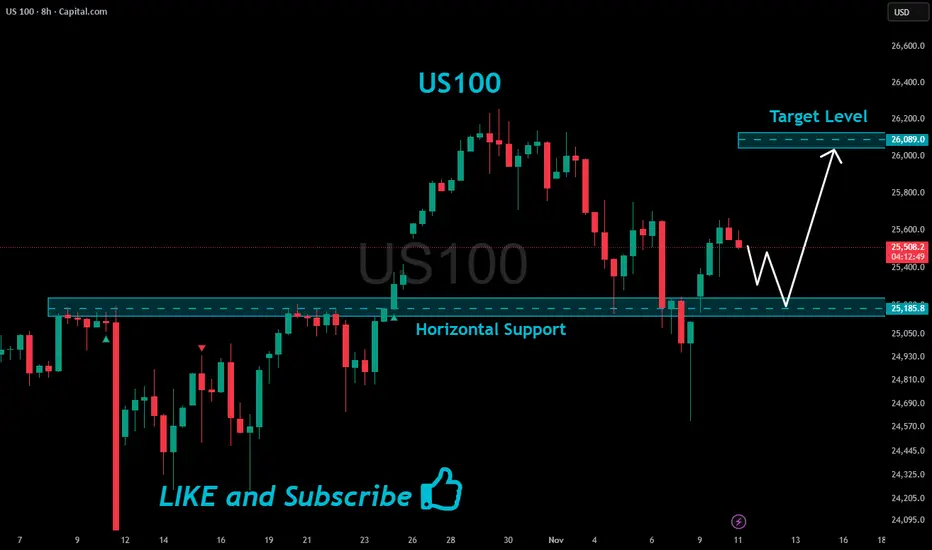
US100 Support Ahead!
HI,Traders !
#US100 is making a local
Bearish correction but
We are bullish biased mid-term
So after the pair hits the horizontal
Support of 25185.8 we will be
Expecting a local bullish rebound !
Comment and subscribe to help us grow !