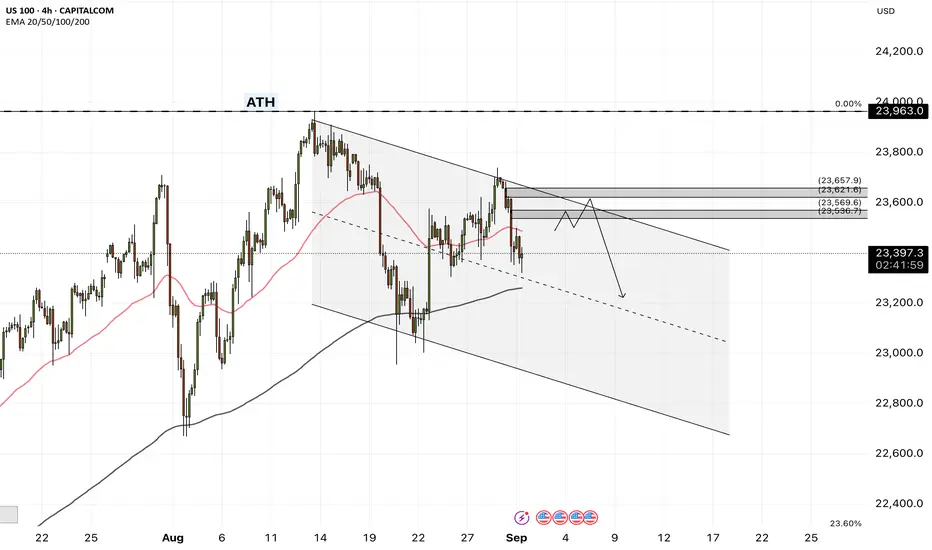
NAS100 - Stock Market, in the Work Week!The index is below the EMA200 and EMA50 on the four-hour time frame and is in its short-term descending channel. If this channel is maintained and the specified range is reached, a close sale can be made with a suitable reward.
Economists anticipate that customs tariffs will push consumer prices higher while slowing economic growth in the coming months. Inflation is expected to accelerate, though not to the extreme levels of the 1970s when the term “stagflation” was coined to describe the combination of high inflation and economic stagnation. Unlike a recession—where the economy contracts and prices fall—stagflation features rising prices despite economic weakness. The U.S. economy could be heading toward a 1970s-style stagflationary environment, though analysts believe this time it will be far less severe.
Many experts argue that the U.S. is on the verge of a period of sluggish growth paired with accelerating inflation. The root cause lies in President Donald Trump’s tariffs, which simultaneously raise consumer costs and weigh on the labor market. However, economists expect this inflationary wave to be much milder than the double-digit annual increases that strained household budgets in the 1970s.
On the corporate front, Nvidia released its second-quarter earnings last week. Revenue reached $46.7 billion, exceeding analysts’ expectations of $46.23 billion. The company’s data center unit—the main growth driver—generated $41.1 billion, slightly below the $41.29 billion forecast. Adjusted earnings per share came in at $1.05, while the adjusted gross margin stood at 72.7%.
Looking ahead, Nvidia projected third-quarter revenue of around $54 billion, with a margin of error of plus or minus 2%. Its board also approved an additional $60 billion share repurchase program. Regarding China, the company reported zero sales of H20 chips to Chinese clients during Q2 and stated that no shipments are planned for that market in the near future.
In the earnings call, CEO Jensen Huang emphasized that the Chinese market could present a $50 billion opportunity for Nvidia this year. He estimated annual growth in China at nearly 50%, noting that the country is the world’s second-largest computing market and home to half of global AI researchers. Huang stressed that maintaining a presence in China is vital for the company’s long-term future, even amid ongoing political and trade tensions between Washington and Beijing.
On the monetary policy side, UBS warned that weakening the independence of the Federal Reserve—especially following Trump’s threat to remove Fed board member Lisa Cook—could have significant economic consequences. In its analysis of Jerome Powell’s speech at the Jackson Hole symposium, UBS described it as “classic Powell”: hinting at the possibility of a September rate cut to offset tariff effects but lacking a broader long-term framework for the evolving economy.
UBS emphasized that failure to strongly defend Fed independence could heighten political risks and destabilize markets.The bank warned that if the central bank comes under political influence, potential outcomes include the reemergence of inflationary instability, a one-percentage-point increase in real borrowing costs, and negative effects on fiscal policy, corporate investment, housing affordability, household savings, and speculative activity.
This week begins with one fewer trading day due to the Labor Day holiday, yet the economic calendar remains packed, with the labor market at the center of attention. On Tuesday, the ISM Manufacturing PMI for August will be released, followed by the JOLTS job openings report on Wednesday.
Thursday will be particularly important, bringing the August ADP private payrolls report, weekly jobless claims, and the ISM Services Index—all at once. These data points are especially significant given the recent large revisions to the Nonfarm Payrolls (NFP) report, which have renewed focus on the degree of convergence or divergence between ADP and NFP figures.
Historically, ADP and NFP reports have often diverged, leaving traders mispositioned when relying too heavily on ADP data. A recent example occurred in July, when ADP reported a decline of 33,000 jobs, while NFP the following day showed a gain of 147,000—well above expectations of 110,000. However, after NFP revisions, the actual trend proved more consistent with ADP’s numbers.
The most important event of the week will take place on Friday: the release of the August U.S. Nonfarm Payrolls report. Investors will be monitoring it closely, as any signs of labor market weakness could reinforce expectations for a Fed rate cut in mid-September.
Despite growing stagflation risks and heightened market volatility, Bank of America (BofA) suggested that autumn could be an attractive entry point for bullish investors. The bank cautioned that while volatility may exert short-term downward pressure, potential pullbacks could serve as buying opportunities.
The VIX volatility index fell to its lowest level of the year following Powell’s dovish remarks at Jackson Hole. Still, concerns about stretched stock valuations, a potential AI-driven bubble, and political risks tied to Fed independence suggest that this calm may not last.
NAS100 trade ideas
BUY STOP (NAS100)NAS is bullish
Inverse H&S
Buy stop on neckline and hold the buy until next psychological number = 24000.00

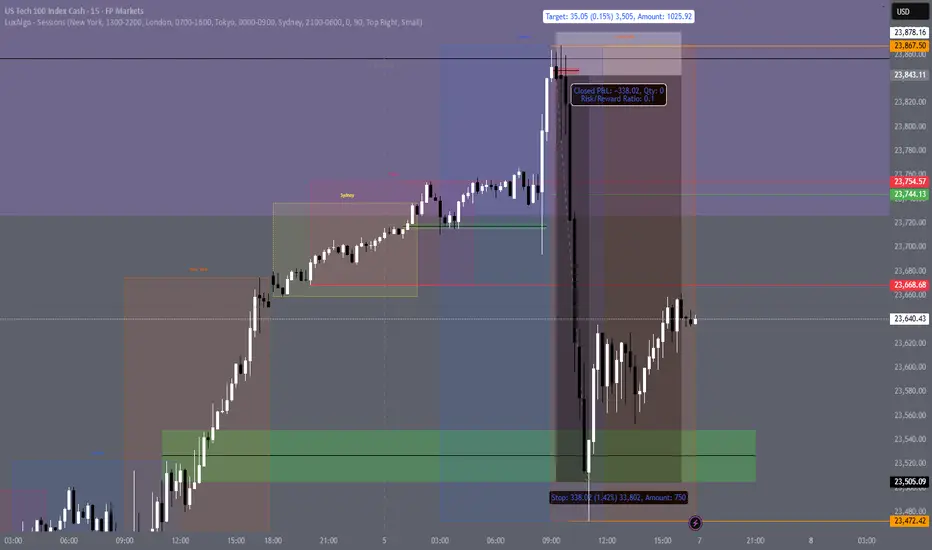
Nas100 Trade Set Up Sep 4 2025FX:NAS100
www.tradingview.com
price has made HH/HL with a big gap in between. It had came up and swept PDH in london session with a close below so what i want to see is either a sweep of SSL, close above, followed by 1m IFVG to go higher or a close below SSL levels to go lower towards HL/PDL

NQ Weekly Analysis!FA Analysis:
1- We know that the FED opened the door for a rate cut in September (Next week). The FED gave priority to address Employment Mandate issue and considered the higher inflation data as one time shot.
2- Hence, the Inflation (the second FED mandate) the most relevant data this week with both PPI and CPI to validate the FED view of one time shot. Another higher inflation will destroy this narrative and the FED might revise the way forward.
The story is simple: Higher Inflation data will send NQ down and vice-versa for inline and softer inflation.
TA Analysis:
Weekly TF:
The weekly close expresses really the incertitude regarding the direction. No clear direction; both direction are open; all will depend on inflation data.
Daily TF:
The daily close was bearish. NFP data provided an inline inflation data but a very negative employment data. As mentioned, bad data data is bad for NQ and vice-versa.
From daily perspective, price might retest Friday high or just NFP low (magenta dotted line) and continue down towards TP1, TP2 and TP3 particularly if Inflation data comes strong.
H4 TF:
H4 provided a break down. Inline with daily analysis, the least resistance is that price continues down after a short retrace up.
GL Everyone!
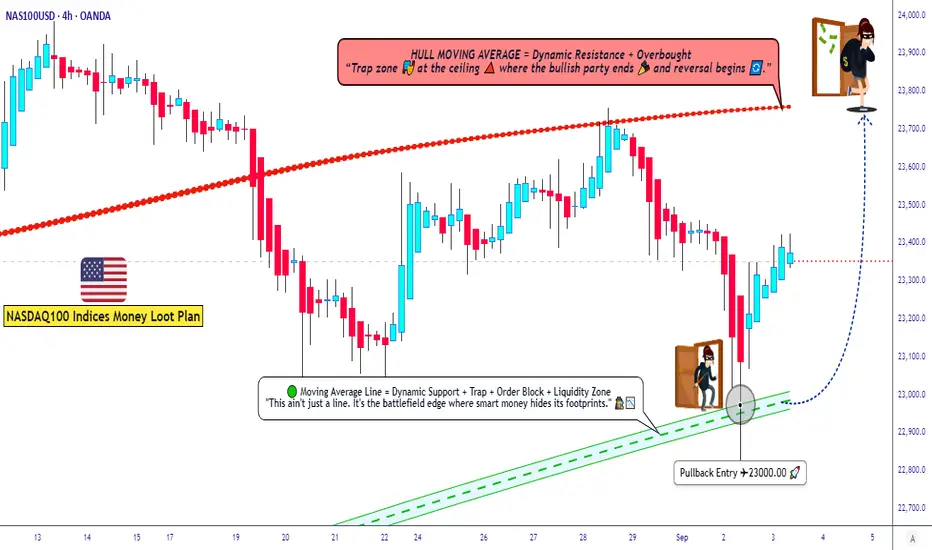
US100 Trading Plan ¦ Layering Strategy + Macro Sentiment Drivers🚀 NASDAQ100 / US100 Index – Thief Money Heist Plan 🎭
📌 Plan: Bullish Swing / Scalping Setup
Dear Ladies & Gentlemen (Thief OG’s), here’s the heist-style breakdown for US100 🔑:
🏴☠️ Entry Style (Thief Layering Strategy)
Using layered limit orders for flexibility & precision:
• 23200.0
• 23250.0
• 23300.0
• 23350.0
(You may increase limit layers based on your strategy & risk appetite)
📉 Moving Average Pullback Entry Plan
• Buy entries on pullbacks to the Fibo level 382 Triangular Moving average zone.
• Look for bullish candles confirming the bounce from these MAs.
• This offers better risk-to-reward by catching momentum on retracements instead of chasing highs.
❓ Why This Works?
• Moving averages often act as dynamic support/resistance in trending markets.
• Institutional traders & algos track them heavily, making them high-probability zones.
• Combining with layering entries = higher flexibility + reduced risk of mistimed single entry.
🛡️ Stop Loss (Protect the Vault)
• Thief SL: @23000.0
• Reminder: Adjust your SL based on your own strategy & risk tolerance.
🎯 Target (Escape Zone)
• Overbought + Trap Zone ahead!
• Escape target: @23750.0
• Note: Don’t rely only on my TP — secure profits at your own pace and risk.
📊 US100 Index CFD Real-Time Data Sep 03
📈 Daily Change: +133.47 (+0.57%)
📅 Monthly Performance: +0.76%
📆 Yearly Performance: +23.48%
😰😊 Fear & Greed Index
📊 Current Reading: 53/100 (Neutral)
🧐 Interpretation: Market sentiment is balanced, showing neither extreme fear nor greed. Investors are cautious but not panicked.
🧠 Retail vs. Institutional Sentiment
👥 Retail Traders: Moderately bullish (55% Long, 45% Short)
🏦 Institutional Traders: Slightly cautious (50% Long, 50% Short)
🔑 Key Drivers: Mixed signals from manufacturing data and upcoming labor market reports.
📉📈 Fundamental & Macro Score
📊 Macro Score: 6/10
Manufacturing PMI (48.7) still in contraction but improving.
Labor market data (JOLTS) awaited for clarity.
⚡ Volatility Score: 5/10 (Moderate)
VIX near average levels, indicating stable expectations.
💧 Liquidity Score: 7/10
Strong volume and breadth in large-cap tech stocks.
🐂🐻 Overall Market Outlook
✅ Bullish (Long): 60%
Supported by strong yearly gains and resilience in big tech.
⚠️ Bearish (Short): 40%
Concerns over manufacturing contraction and inflation pressures.
💡 Key Takeaways
📈 US100 is trending mildly positive today (+0.57%).
😐 Sentiment is neutral—no extreme fear or greed.
📊 Macro data hints at cautious optimism but watch for upcoming labor reports.
🐂 Overall bias leans slightly bullish for long-term holders.
📊 Related Pairs to Watch
FOREXCOM:SPX500
TVC:DJI
TVC:VIX
NASDAQ:NDX
FX:USDOLLAR
✨ “If you find value in my analysis, a 👍 and 🚀 boost is much appreciated — it helps me share more setups with the community!”
#NASDAQ100 #US100 #NDX #SPX500 #DJI #TradingView #SwingTrade #ScalpTrading #LayeringStrategy #MarketAnalysis
NAS100USD (SHORT)
Fib Level to continue Down trent
Break and retest on bullish flag
Nasdaq is a Downtrend

NASDAQ 1D MA50 SUPPORT NASDAQ 1D MA50 Support 🟢
NDX consolidating on the 1D MA50 inside its Channel Up since May.
RSI setup looks like the May 30 Higher Low ✅.
Last bullish leg from this formation gave +6.80% — same play now targets 24,500 🎯.
Kaizo precision. Rally loading… 🥷🚀

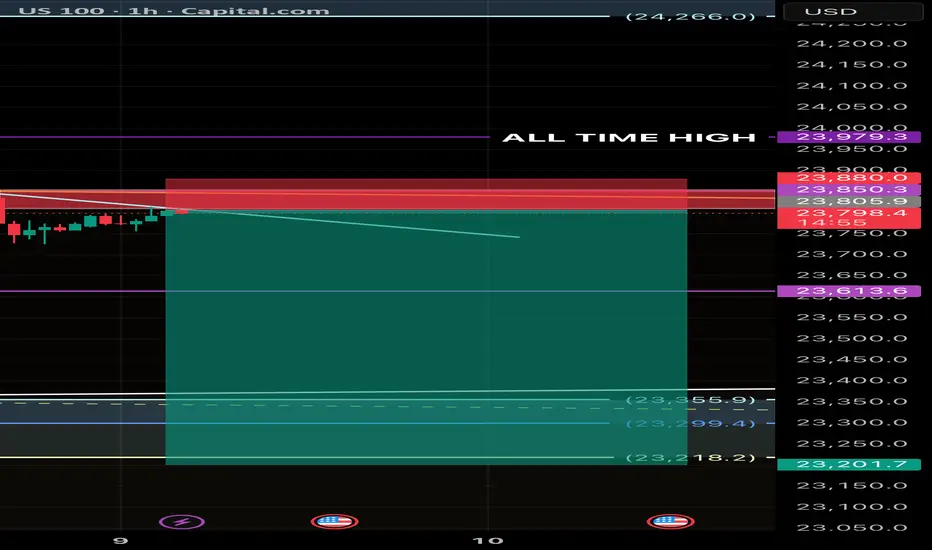
US100 – Short Setup Near All-Time High US100 – Short Setup Near All-Time High
Price is currently testing a critical resistance zone near the all-time high at 23,979. After rejecting from this level, I’ve identified a potential short opportunity with a favorable risk-to-reward ratio.
Price testing ALL-TIME HIGH (23,979) and rejecting from resistance zone.
🔴 Entry: 23,798 – 23,805
🛑 SL: 23,880
🎯 TP1: 23,613 | TP2: 23,355 | TP3: 23,201
⚡ Strong supply zone + rejection → high R:R setup (~1:5).
❌ Invalidation above 23,880.
#US100 #NASDAQ100 #indices #PriceAction #TradingSetup #SupplyDemand #ShortTrade
NASDAQ - Bullish Flow into Highs
Bias: Bullish
HTF (4H Overview):
From the bird’s-eye view, structure remains bullish. Liquidity is being targeted across the 30M–4H multi-timeframe play, with strong bullish intent confirmed by volume printing to the upside.
LTF (30M / 5M Confirmation):
A proper CHoCH has been established. Once the trend shift occurs, we wait for the pullback before attending longs.
Entry Plan:
Look for entry after the courtyard liquidity is collected and demand is mitigated (slash zone).
Targets:
Initial: 5M highs
Extended: 30M highs, depending on market delivery.
Mindset Note:
Patience—let liquidity do its job before striking.

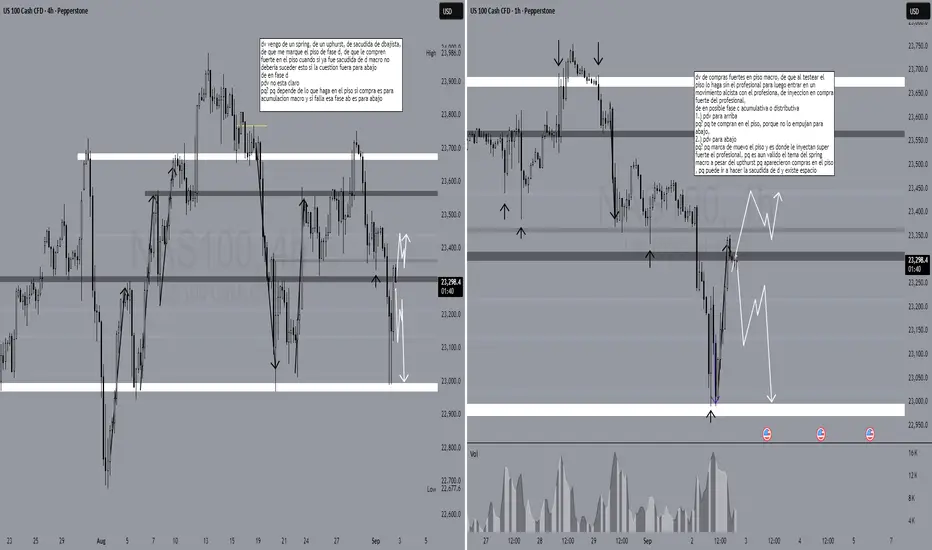
key levels for the nqIf the nq breaks 23362 we have enough information to wait for a shakeout and then enter. if it breaks 23210.7 we got to wait for a retracement and then a shakeout to sell. But, be aware that for sales the target should be more aggressive which means to cover on 23k, and just in case, we can leave a small portion of the position open but cover more than 70% because it might be the macro shakeout.
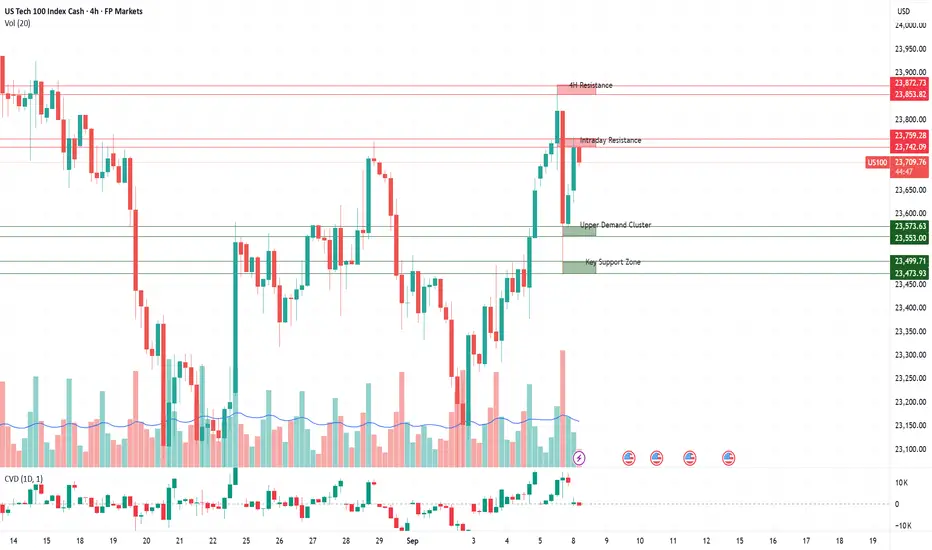
Nas100: Trading Levels in FocusSupply Zones (Red)
23,853 - 23,873
A strong supply zone near recent highs. Sellers are expected to defend aggressively here, making it a potential rejection area. A confirmed breakout and retest, however, could open the path toward new highs.
23,742 – 23,759
This zone reflects last week’s high-volume rejection. Acts as an intraday decision area: sharp rejections can trigger short setups, while a clean break and hold above would strengthen bullish momentum.
Demand Zones (Green)
23,553 – 23,573
A fresh demand zone aligned with recent breakout structure. Buyers may attempt to defend here for continuation longs. If broken, the zone flips into resistance, adding downside pressure.
23,473 – 23,500
Well-tested support area with prior absorption. Strong bounce potential, but multiple retests increase the risk of a breakdown. A failure here would likely accelerate bearish momentum.
Overall Sentiment: Cautiously Bullish on Fragile Ground
At its core, the market is cautiously optimistic right now. Positive momentum from Big Tech and expectations of looser monetary policy are fueling short-term upside potential. At the same time, consolidation and uncertainty around macro data keep sentiment restrained. Momentum is present but it relies on breakout moves holding.
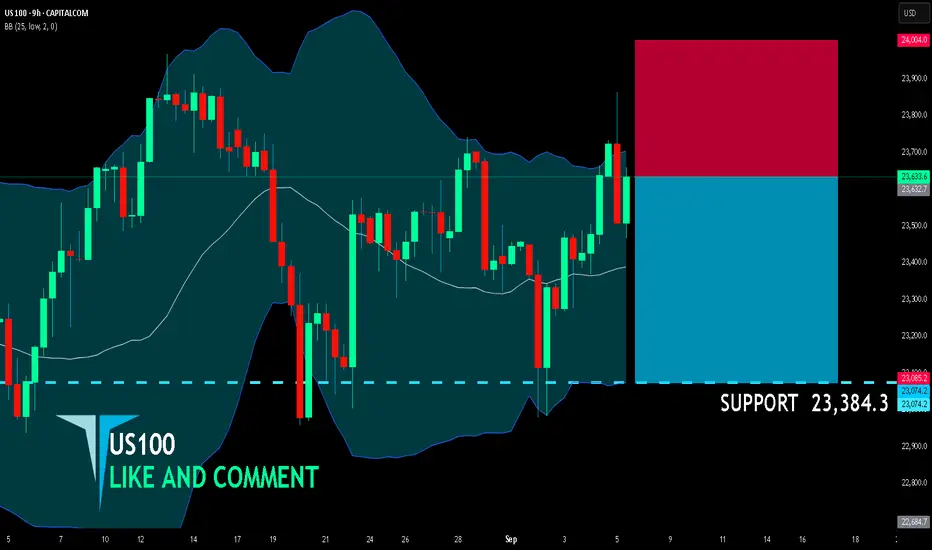
US100 SHORT FROM RESISTANCE
US100 SIGNAL
Trade Direction: short
Entry Level: 23,632.7
Target Level: 23,384.3
Stop Loss: 24,004.0
RISK PROFILE
Risk level: medium
Suggested risk: 1%
Timeframe: 9h
Disclosure: I am part of Trade Nation's Influencer program and receive a monthly fee for using their TradingView charts in my analysis.
✅LIKE AND COMMENT MY IDEAS✅
NAS100 LongThis is now oversold on all timeframes, showing sellers exhaustion
There is a deep crab pattern on H4 and H1 displaying a potential reversal zone
There is great support at this level as daily trend is also pointing up
Double bottom on M15 showing divergence
Stoploss of 150 pips

Nasdaq Under Pressure as Rally StallsThe Nasdaq is showing signs of weakness after its recent surge toward record highs. Profit-taking, especially at the end of the month, has weighed on tech stocks, while the broader market digests Powell’s dovish signals from Jackson Hole.
Despite optimism around potential rate cuts, valuations in the Nasdaq remain stretched, leaving the index vulnerable to corrections. Rising bond yields, even if off their peaks, are still creating headwinds for high-growth sectors.
Geopolitical concerns and renewed tariff discussions add another layer of uncertainty. At the same time, several heavyweight tech names have already reported earnings, removing a key driver of recent upside momentum.
Technically, the index is testing short-term support. If this level fails, a retracement toward 21,500 or even the 50-day moving average could follow. The daily chart has started to print rejection candles, hinting that buying pressure is fading.
While the long-term trend remains intact, short-term risks are building. Unless the Nasdaq can reclaim its highs quickly, a pullback looks increasingly likely as markets rebalance and investors take a more cautious stance.

Bullish bounce off 61.8% Fibonacci support?US100 is falling towards the support level which is a pullback support that aligns with the 61.8% Fibonacci retracement and could bounce from this level to our take profit.
Entry: 23,289.88
Why we like it:
There is a pullback support that aligns with the 61.8% Fibonacci retracement.
Stop loss: 22,983.03
Why we like it:
There is a multi-swing low support.
Take profit: 23,729.56
Why we like it:
There is a pullback resistance.
Enjoying your TradingView experience? Review us!
Please be advised that the information presented on TradingView is provided to Vantage (‘Vantage Global Limited’, ‘we’) by a third-party provider (‘Everest Fortune Group’). Please be reminded that you are solely responsible for the trading decisions on your account. There is a very high degree of risk involved in trading. Any information and/or content is intended entirely for research, educational and informational purposes only and does not constitute investment or consultation advice or investment strategy. The information is not tailored to the investment needs of any specific person and therefore does not involve a consideration of any of the investment objectives, financial situation or needs of any viewer that may receive it. Kindly also note that past performance is not a reliable indicator of future results. Actual results may differ materially from those anticipated in forward-looking or past performance statements. We assume no liability as to the accuracy or completeness of any of the information and/or content provided herein and the Company cannot be held responsible for any omission, mistake nor for any loss or damage including without limitation to any loss of profit which may arise from reliance on any information supplied by Everest Fortune Group.

killzone ideal setup to takeSTEP 1: Spot session HH/LL (prefered asia session)
STEP 2: Wait for next session to sweep HH/LL of previous session
STEP 3: Spot FVG,OB or wtv that confirm reversal/continuation
STEP 4: Enter position after confirmation of market reaction
NAS100 At Major Resistance - Breakout or Reversal?NAS100 Technical Analysis: 🚀 At Major Resistance - Breakout or Reversal? 📉
Asset: NAS100 (NASDAQ 100 CFD)
Analysis Date: September 5, 2025
Current Closing Price: 23,639.8 (as of 12:59 AM UTC+4)
Timeframes Analyzed: 1H, 4H, D, W
Executive Summary & Market Outlook 🧐
The NAS100 is at a critical technical juncture, testing a formidable resistance zone between 23,600 and 23,800. 📊 The index is in a clear long-term bullish trend but shows signs of short-term exhaustion after a powerful rally. This is a classic "make-or-break" level. A decisive breakout above 23,800 could ignite a new leg up towards 24,500, while a rejection here may trigger a significant corrective pullback towards 22,800. This analysis provides a roadmap for both intraday traders 🎯 and swing traders 📈.
Multi-Timeframe Technical Analysis 🔍
1. Trend Analysis (Daily & 4-Hour Chart):
Primary Trend: 🟢 Bullish. Price is above all major Daily Moving Averages (200, 100, 50 EMA), which are aligned bullishly.
Short-Term Trend: 🟡 Bullish but Overextended. The rally has been near-vertical, suggesting the market is ripe for a pause or pullback.
2. Key Chart Patterns & Theories:
Resistance Confluence Zone 🧱: The current price is battling a massive resistance cluster. This zone includes:
A prior major swing high (Price Action Resistance).
The 127.2% and 161.8% Fibonacci extension levels from the last significant correction.
A potential Bullish Cypher pattern's Potential Reversal Zone (PRZ).
Elliott Wave Theory 🌊: The rally from the last major low is best counted as a powerful Impulse Wave. We are likely in the final stages of Wave 5 or a complex Wave 3 extension. This implies that while the trend is up, a larger Wave (4) correction is increasingly probable. Typical retracement targets for a Wave 4 are the 38.2% Fib level near 22,800.
Ichimoku Cloud (H4/D1) ☁️: Price is trading high above the Cloud on daily charts, confirming the strong bullish trend. The Lagging Span (Chikou Span) is also well above price, indicating sustained buying pressure. However, such extreme extensions often precede consolidation.
Gann Theory ⏳: The 23,600-23,800 area represents a key mathematical resistance zone. A daily close above this could open the path to the next Gann angle target.
3. Critical Support & Resistance Levels:
Resistance (R1): 23,800 - 24,000 (Key Psychological & Technical Ceiling) 🚨
Resistance (R2): 24,500 (Projected Target)
Current Closing Price: ~23,640
Support (S1): 23,200 - 23,400 (Immediate Support & 21-period EMA) ✅
Support (S2): 22,800 - 23,000 (Major Support - 38.2% Fib & Prior Breakout Zone) 🛡️
Support (S3): 22,200 (200-Day EMA & 50% Fib)
4. Indicator Consensus:
RSI (14-period on 4H/D): Reading is above 70 on both timeframes, signaling severely overbought conditions. 📛 This is a warning against chasing longs at these highs. A bearish divergence is forming on the 4H chart, hinting at weakening momentum.
Bollinger Bands (4H) 📏: Price is consistently riding the upper band, a sign of a strong trend. However, a move back towards the middle band (20-period SMA) is a common next step after such extensions.
Moving Averages: The bullish alignment (EMA8 > EMA21 > EMA50) is intact. The EMA 21 on the 4H chart (~23,400) is critical immediate support.
Volume & VWAP: Volume has been declining on the most recent push higher, a potential bearish divergence 📉 suggesting a lack of conviction at these highs.
Trading Strategy & Forecast 🎯
A. Intraday Trading Strategy (5M - 1H Charts):
Bearish Scenario (Rejection Play) ⬇️: This is the preferred setup given overbought conditions. Look for bearish reversal candlestick patterns (e.g., Bearish Engulfing, Evening Star 🌟) at or near the 23,800 resistance.
Entry: On confirmation of rejection.
Stop Loss: Tight, above 23,850.
Target: 23,400 (TP1), 23,200 (TP2).
Bullish Scenario (Breakout Play) ⬆️: If buyers overpower and we get a strong 1H close above 23,850, a momentum long could be viable.
Entry: On a small pullback to ~23,780 (re-test as support) or on the breakout.
Stop Loss: Below 23,650.
Target: 24,200 (TP1), 24,500 (TP2).
B. Swing Trading Strategy (4H - D Charts):
Strategy: WAIT FOR A PULLBACK. The risk/reward for new long entries at this resistance is poor. 🚫 The optimal strategy is to wait for a healthy correction to key support zones to add long positions.
Ideal Long Zones: 23,200 (shallow pullback) or 22,800 (deeper correction). ✅
Bearish Risk: A daily close below 22,800 would signal a much deeper correction is likely underway, potentially targeting 22,200.
Risk Management & Conclusion ⚠️
Key Risk Events: High-impact US economic data (e.g., NFP, CPI) and Fed policy announcements are paramount. 🔥 Any hawkish surprises could be the catalyst for a sharp tech-led selloff.
Position Sizing: The potential for increased volatility demands conservative risk management. Never risk more than 1-2% of your account on a single trade.
Conclusion: The NAS100 is bullish but exhausted. 🥴 The current resistance zone is a high-risk area for new longs and a high-probability area for a pullback. 🎯 Swing traders should be patient for a better entry. Intraday traders can play the range between 23,200 and 23,800 until a decisive break occurs. The overall trend remains up, but a period of consolidation or correction is the most probable outcome in the near term.
Overall Bias: 🟢 Bullish above 22,800 | 🟡 Neutral/Bearish below 23,200
For individuals seeking to enhance their trading abilities based on the analyses provided, I recommend exploring the mentoring program offered by Shunya Trade. (Website: shunya dot trade)
I would appreciate your feedback on this analysis, as it will serve as a valuable resource for future endeavors.
Sincerely,
Shunya.Trade
Website: shunya dot trade
Disclaimer: This post is intended solely for educational purposes and does not constitute investment advice, financial advice, or trading recommendations. The views expressed herein are derived from technical analysis and are shared for informational purposes only. The stock market inherently carries risks, including the potential for capital loss. Therefore, readers are strongly advised to exercise prudent judgment before making any investment decisions. We assume no liability for any actions taken based on this content. For personalized guidance, it is recommended to consult a certified financial advisor.

Potential Buy Zone for NAS100Trade what you see and not what you feel. This is what I see. There is a demand zone on 15 min which has not been balanced. There is also another demand zone below that one on 1hr time frame that has also not been balanced. Will wait for the market to retrace to the demand zone and if I get proper indications of going long on smaller TF I will take the long. I have a feeling though that the market might go to the lower demand zone because there is a potential formation of a H&S pattern forming. So, stop losses will be tight if I enter on the 15 min demand zone.

Nas100 Trade Set Up Sep 2025FX:NAS100
www.tradingview.com
Price broke PDL and approaching daily SSL while making LH/LL so i want to see a slight pull back before continuing lower

Naz 100 in a tricky spotIts trying to break that downtrend as it got oversold on the way down.lets see if it can break the trend

NAS100Currently in bullish movement. Waiting for retracement or pullback to the marking zone and looking for a buy opportunity. Please wait for the close candle to make a decision or execute for trade.
H4-H1-M15

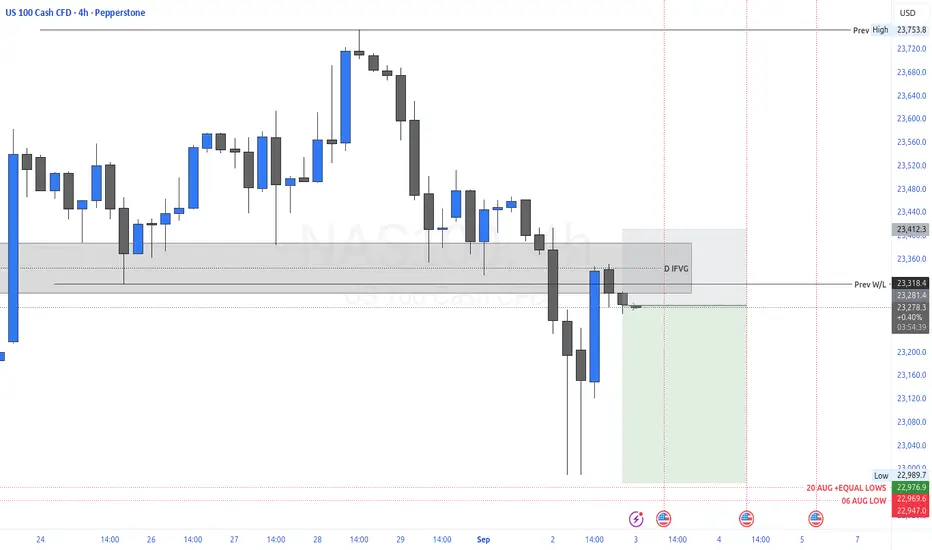
Nas100 Trade Set Up Sep 3 2025FX:NAS100
www.tradingview.com
Price is within a LH and LL range so i would like to see LH or PDH swept as liquidity before a continuation back down towards SSL
