US30: Next Move Is Down! Short!
My dear friends,
Today we will analyse US30 together☺️
The recent price action suggests a shift in mid-term momentum. A break below the current local range around 45,140.8 will confirm the new direction downwards with the target being the next key level of 45,050.1 and a reconvened placement of a stop-loss beyond the range.
❤️Sending you lots of Love and Hugs❤️
US30 trade ideas
US30 Price currently stuck in supplyPrice has been stuck in that supply zone since Friday. If it continues to hold it will eventually apply pressure to the downside and we should therefore short the index and target the next demand zone.

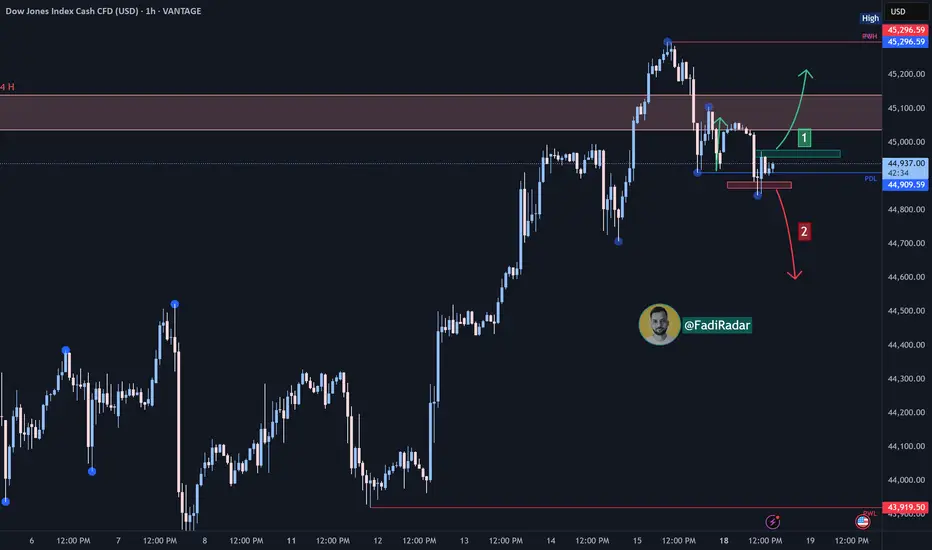
Dow Jones Analysis (US30 / Dow Jones):The index is currently trading in a long-term bullish trend, while moving within a corrective bearish channel on the hourly timeframe.
1️⃣ Bullish Scenario (More Likely):
If bullish momentum continues and the index holds above 45,000, it may target 45,200. Sustained buying pressure could push the price toward a new high.
2️⃣ Bearish Scenario:
If the price breaks below 44,870 and stabilizes under it, the index could retest 44,700, with further downside potential toward 44,500 if selling pressure persists.

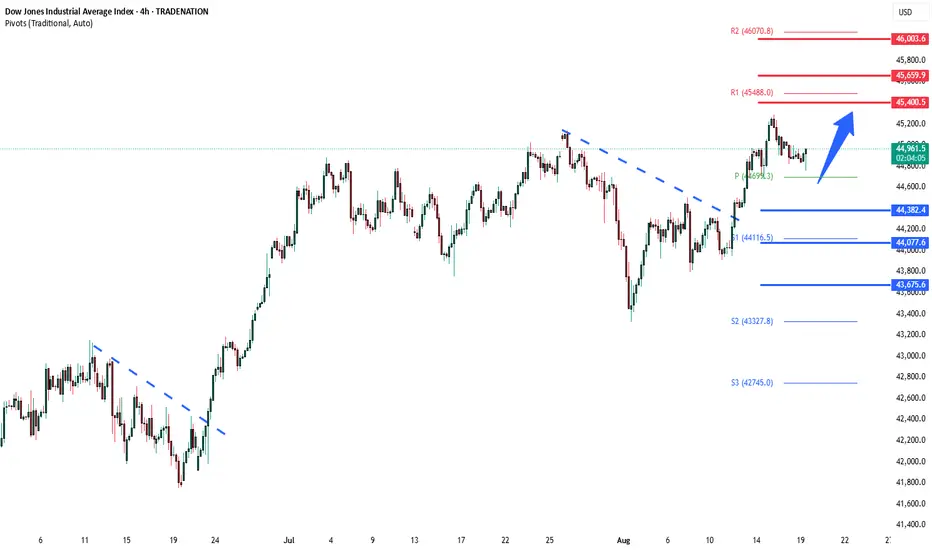
DowJones range trading below ATHKey Support and Resistance Levels
Resistance Level 1: 45400
Resistance Level 2: 45660
Resistance Level 3: 46000
Support Level 1: 44380
Support Level 2: 44080
Support Level 3: 43675
This communication is for informational purposes only and should not be viewed as any form of recommendation as to a particular course of action or as investment advice. It is not intended as an offer or solicitation for the purchase or sale of any financial instrument or as an official confirmation of any transaction. Opinions, estimates and assumptions expressed herein are made as of the date of this communication and are subject to change without notice. This communication has been prepared based upon information, including market prices, data and other information, believed to be reliable; however, Trade Nation does not warrant its completeness or accuracy. All market prices and market data contained in or attached to this communication are indicative and subject to change without notice.


US30 Outlook: Earnings in Focus, 44,950 Key PivotUS30 Overview
The price action today is likely to be influenced by Home Depot NYSE:HD earnings.
If the 4H candle closes above 44,950, this would strengthen the bullish outlook, opening the way toward 45,100 and 45,285.
However, as long as the index trades below 44,950, the bias remains bearish, targeting 44,720 and 44,610.
In summary, while below 44,950, the market remains in a bearish trend.
Support Levels: 44,720, 44,610, 44,470
Resistance Levels: 45,100, 45,285

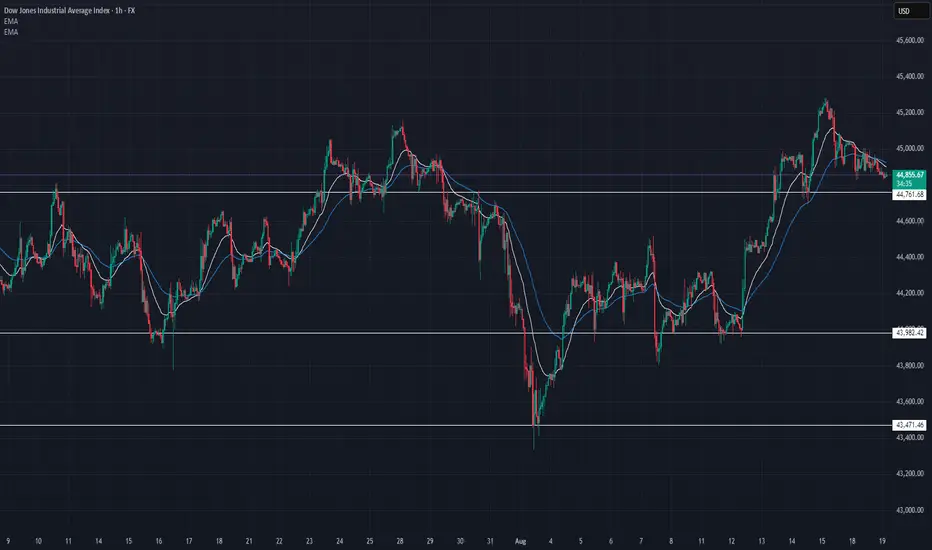
US30 Technical Breakdown – 08/19/2025📍 US30 Technical Breakdown – 08/19/2025
US30 is currently trading around 44,859, pulling back after failing to sustain above 45,200. Price rejected from the upper range and is now sitting just above the 44,761 support zone.
The EMAs are flattening, showing momentum stalling. If 44,761 gives way, bears could press back toward 43,982. Bulls must reclaim 45,000–45,200 to regain control.
📊 Current Market Behavior:
📉 Rejected from 45,200 high
📊 Testing support at 44,761
📉 EMAs flattening → neutral momentum
⚠️ Range-bound between 45,200 & 44,761
📌 Key Levels:
🔹 Resistance Zones:
45,000–45,200 → Immediate barrier
45,400–45,600 → Next upside zone
🔹 Support Zones:
44,761 → Key intraday support
43,982 → Demand base
43,471 → Major swing low
🧠 Bias:
📉 Short-term Neutral / Bearish tilt
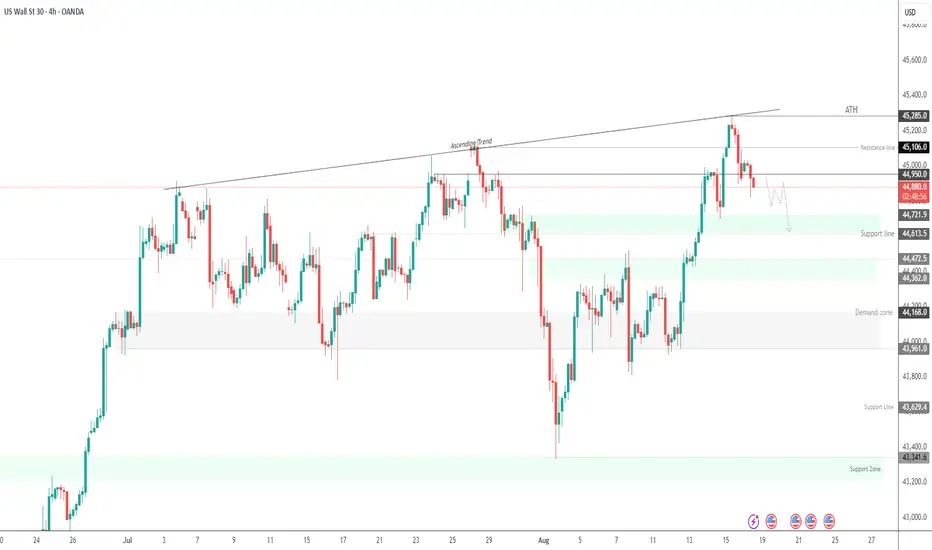
Dow Jones Wave Analysis – 18 August 2025
- Dow Jones reversed from strong resistance level 45000.00
- Likely to fall to support level 44500.00
Dow Jones index recently reversed down from the resistance zone located between the strong resistance level 45000.00 (which has been reversing the price from the end of 2024) and the upper daily Bollinger Band.
The downward reversal from this resistance zone created the daily Japanese candlesticks reversal pattern Shooting Star.
Given the strength of the resistance level 45000.00 and the overbought daily Stochastic, Dow Jones index can be expected to fall to the next support level 44500.00.

US30 UPDATE - Preparing to SHORTDear Friends in Trading,
How I see it,
Zoomed in on 1HR
Price is at a very strong resistance area at this time.
Multiple rejections especially on bigger timeframes increases the potential to
to fall towards the PIVOT/POC area as per my 4HR analysis.
Keynote:
Only a clear and decisive breach above 45018, can potentially rally towards 45140
I sincerely hope my point of view offers a valued insight
Thank you for taking the time study my analysis.

Correction A corrective and fluctuating trend is expected to form and advance to the support area. Then there is a possibility of a trend change and the start of an upward trend.

Dow Jones Index Analysis (US30 / Dow Jones):The index is currently trading in a bullish trend on the broader outlook, while moving within a corrective downward channel on the hourly timeframe.
🔺 Bullish Scenario:
If the bullish momentum continues and the price holds above the 44,970 level, it may target 45,000 followed by 45,200.
🔻 Bearish Scenario:
If the price breaks below the nearby support at 44,870 and stabilizes under it, this may push the index toward testing 44,770, and continued selling pressure could extend the decline toward 44,500.
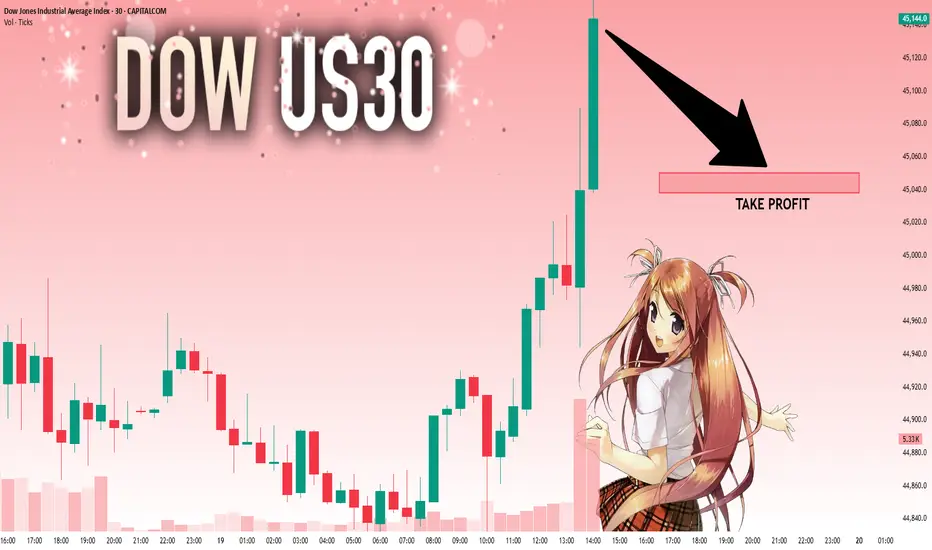
US30 LongElite Analysis
This is an A set up, it is missing 2 confirmations to be a A++ Set Up.
I executed in a smaller time frame.
Executed off an 2m OB
Targeting previous session high.

US30 | Geopolitics in Focus – Key Pivot at 44950US30 Overview
Geopolitics dominates before the Fed takes the stage.
Putin’s position remains that Ukraine should cede all territory Russia has occupied — and even areas it has failed to capture in more than three years of fighting. This has been firmly rejected by Zelenskiy and European leaders, who will be alongside him in Washington when he meets Trump later today.
Technical Outlook:
The price holds bearish momentum toward 44720 and 44610 as long as it trades below 44950.
A 4H close above 44950 would shift the bias bullish toward 45100 and 45285.
Support: 44720, 44610, 44470
Resistance: 45100, 45285
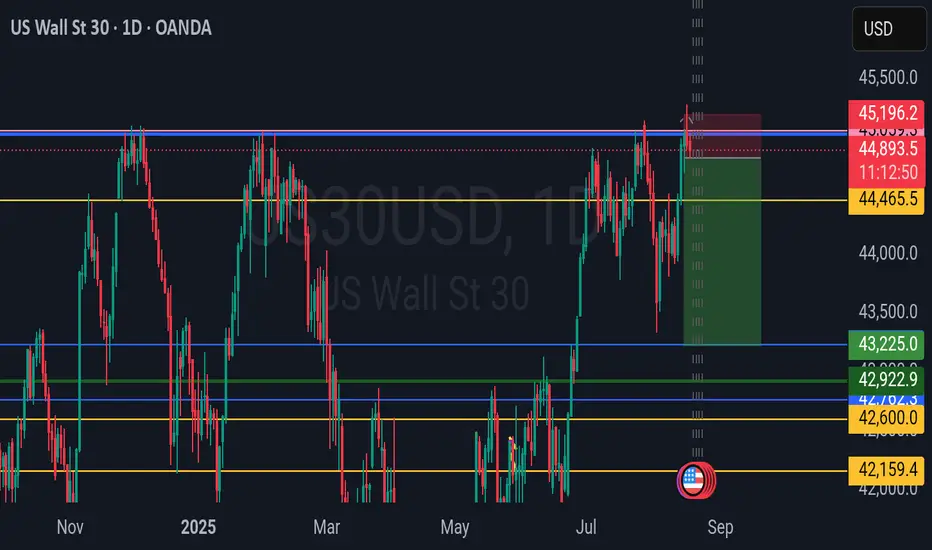
US30 BEARISH SETUPUS30 Has tested 45000 for the 4th time on daily time frame, it has failed to break into a new level on each attempt, sellers are back in control Technically

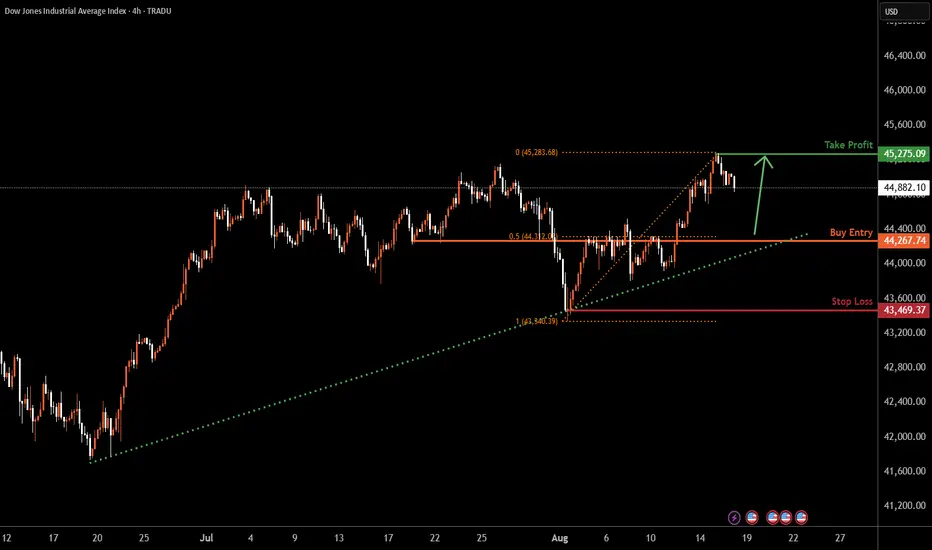
US30 H4 | Falling towards overlap supportDow Jones (US30) is falling towards the buy entry, which is an overlap support that lines up with the 50% Fibonacci retracement and could bounce from this level to the swing high.
Buy entry is at 44,267.74, which is an overlap support that lines up with the 50% Fibonacci retracement.
Stop loss is at 43,469.37, which is a swing low support.
Take profit is at 45,275.09, which is a swing high resistance.
High Risk Investment Warning
Trading Forex/CFDs on margin carries a high level of risk and may not be suitable for all investors. Leverage can work against you.
Stratos Markets Limited (tradu.com ):
CFDs are complex instruments and come with a high risk of losing money rapidly due to leverage. 65% of retail investor accounts lose money when trading CFDs with this provider. You should consider whether you understand how CFDs work and whether you can afford to take the high risk of losing your money.
Stratos Europe Ltd (tradu.com ):
CFDs are complex instruments and come with a high risk of losing money rapidly due to leverage. 66% of retail investor accounts lose money when trading CFDs with this provider. You should consider whether you understand how CFDs work and whether you can afford to take the high risk of losing your money.
Stratos Global LLC (tradu.com ):
Losses can exceed deposits.
Please be advised that the information presented on TradingView is provided to Tradu (‘Company’, ‘we’) by a third-party provider (‘TFA Global Pte Ltd’). Please be reminded that you are solely responsible for the trading decisions on your account. There is a very high degree of risk involved in trading. Any information and/or content is intended entirely for research, educational and informational purposes only and does not constitute investment or consultation advice or investment strategy. The information is not tailored to the investment needs of any specific person and therefore does not involve a consideration of any of the investment objectives, financial situation or needs of any viewer that may receive it. Kindly also note that past performance is not a reliable indicator of future results. Actual results may differ materially from those anticipated in forward-looking or past performance statements. We assume no liability as to the accuracy or completeness of any of the information and/or content provided herein and the Company cannot be held responsible for any omission, mistake nor for any loss or damage including without limitation to any loss of profit which may arise from reliance on any information supplied by TFA Global Pte Ltd.
The speaker(s) is neither an employee, agent nor representative of Tradu and is therefore acting independently. The opinions given are their own, constitute general market commentary, and do not constitute the opinion or advice of Tradu or any form of personal or investment advice. Tradu neither endorses nor guarantees offerings of third-party speakers, nor is Tradu responsible for the content, veracity or opinions of third-party speakers, presenters or participants.
US30 | Bearish ReversalUS30 has printed divergence on 1hr TF and the indice is respecting the divergence so far.Moreover,The head and shoulder pattern is also in making which further confirms bearish reversal.

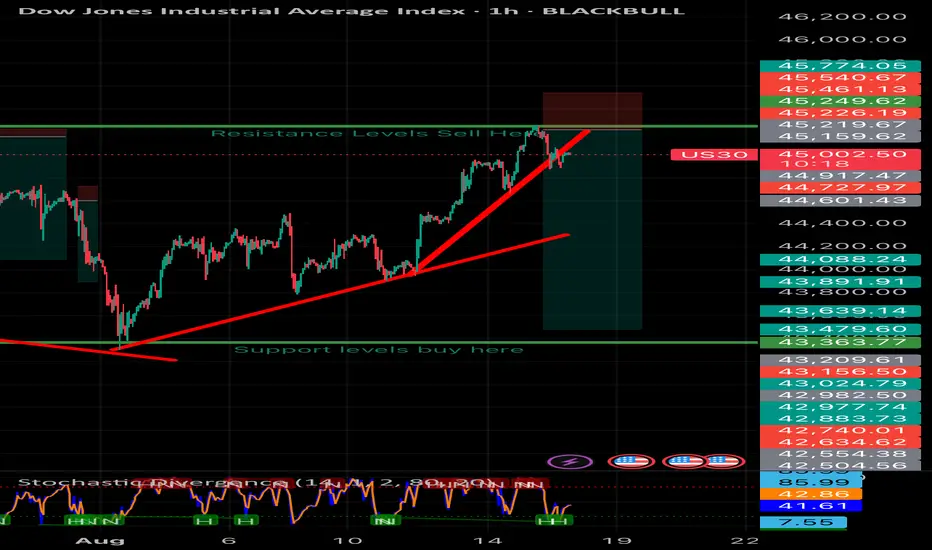
Us30 technical analysis US30 sell technical analysis. At a good trend line breakout opportunity where the trend line is now acting as resistance. We should see a strong breakout movement here to the down side.
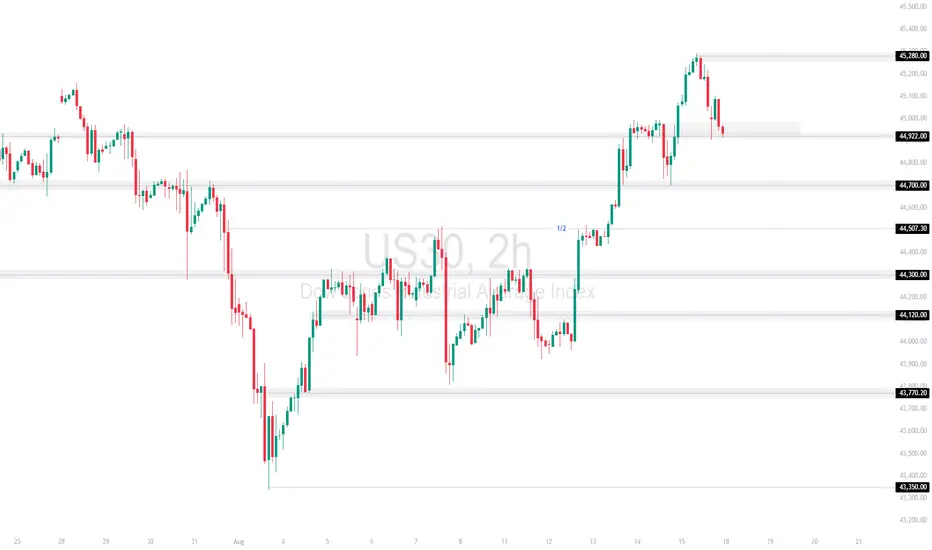
US30 – Retest at 44,922.00After touching 45,280.00 resistance, US30 is pulling back and testing the 44,922.00 level. A hold here could keep bullish momentum intact, while a break lower may open the way toward 44,700.00 and 44,507.30.
Support at: 44,922.0 🔽 | 44,700.0 🔽 | 44,507.3 🔽
Resistance at: 45,280.0 🔼 | 45,500.0 🔼
🔎 Bias:
🔼 Bullish: Holding above 44,922.0 could lead to another attempt at 45,280.0.
🔽 Bearish: A breakdown below 44,700.0 would weaken structure and expose 44,300.0.
📛 Disclaimer: This is not financial advice. Trade at your own risk.
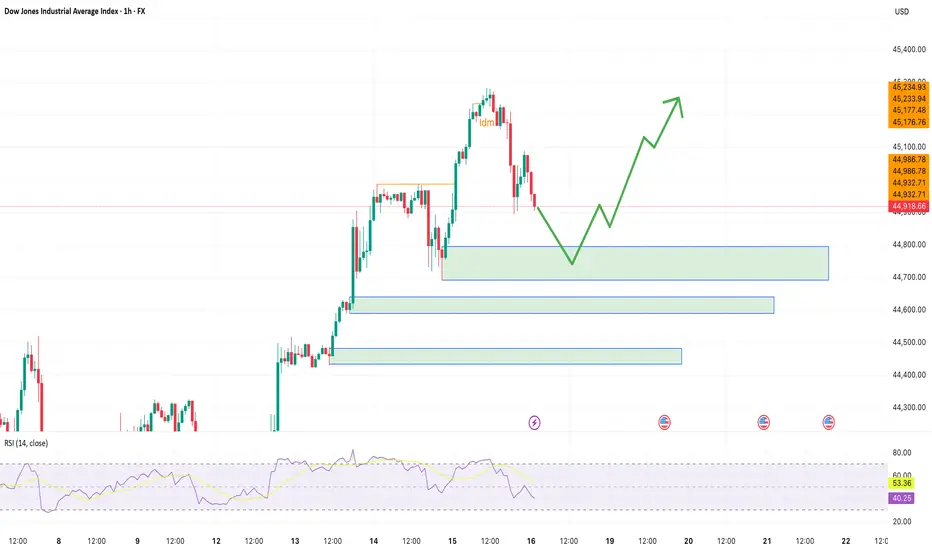
US30US30 still have some upside, wait for correction and look for buy setups.
Disclosure: We are part of Trade Nation's Influencer program and receive a monthly fee for using their TradingView charts in our analysis.

US30 BUY SETUPAccording to SMC, US30 is in a bullish trend, and there is an inducement at approximately 45,175. If order blocks are observed before the inducement, there is a valid order block at 44,798 and a valid fare value gap. A buy setup trade could be executed if the market reaches 44,798. Before executing the trade, wait for confirmation from ChoCH, candlestick analysis, or divergence.
Technical Analysis for US30 (Dow Jones) Closing Price: 44,935.4 (16th Aug 2025, 12:50 PM UTC+4)
Analysis Methods: Japanese Candlesticks, Harmonic Patterns (ABCD, M/W), Elliott Wave, Wyckoff, Gann Theory (Time/Square of 9/Angles), Ichimoku, RSI, Bollinger Bands, VWAP, Moving Averages (MA/EMA/SMA/WMA).
1. Long-Term Trend (Weekly/Monthly)
Elliott Wave:
US30 is in Wave 5 of a bull cycle (Wave 3 peak: 45,500, Wave 4 correction to 42,800).
Target: 46,200–46,800 (1.618 extension of Wave 1).
Gann Price Forecasting:
Square of 9: √44,935.4 ≈ 212.00 →
Key resistance: 213² = 45,369, 214² = 45,796
Critical support: 211² = 44,521, 210² = 44,100
Break above 45,369 targets 46,000 (psychological level).
Ichimoku (Monthly):
Tenkan (9): 43,800 > Kijun (26): 43,200 → Bullish crossover.
Price above thick Senkou Span (42,500–43,000) – structural bullishness.
Moving Averages:
Weekly EMA(100): 43,000 (major trend support).
Swing Outlook: Bullish. Wave 5 targets 46,200–46,800.
2. Medium-Term Swing (4H/Daily)
Harmonic Patterns:
Bearish ABCD on Daily:
A: 45,200 → B: 44,300 → C: 44,900 → D: 45,050–45,150 (1.272 BC extension).
Bullish Crab (W Pattern) near 44,400 (0.886 XA retracement).
Wyckoff Phase:
Distribution above 44,900:
Upthrust rejection at 45,000 (16th Aug) on fading volume.
Weakness in rallies above 44,950.
Gann Theory:
Time Window: Aug 19–22 (Square of 9 reversal cluster).
Gann Angle: 1x1 support at 44,800 (45° angle from Aug 14 low).
Price-Time Squaring: 44,935 aligns with Aug 16 – consolidation expected.
Indicators:
RSI(14) + Bollinger Bands (Daily):
RSI: 65 (neutral-bullish, no divergence).
Price testing upper BB(20,2) at 45,050 → band expansion signals volatility.
VWAP (Weekly): 44,600 (swing support).
Swing Trade Setup:
Short near 45,050–45,150 → Target 44,500. Stop-loss: 45,300.
Long near 44,400 → Target 45,500. Stop-loss: 44,200.
3. Intraday Outlook (5M–4H)
Key Levels:
Resistance: 45,000 (psychological), 45,100 (Gann 1x1), 45,200 (ABCD target).
Support: 44,850 (VWAP), 44,750 (Ichimoku cloud), 44,600 (200-EMA).
Indicators:
Ichimoku (1H):
Tenkan: 44,920, Kijun: 44,860 → Price above both (short-term bullish).
Cloud: Bullish (44,780–44,840) – intraday support zone.
RSI + Bollinger Bands (4H):
RSI(14): 61 (neutral).
Price near mid-BB(20,2) at 44,900 → break below signals bearish momentum.
VWAP + MAs:
VWAP: 44,880 (intraday pivot).
EMA(20): 44,940 (resistance).
Candlestick Patterns:
4H Shooting Star at 45,000 → Bearish reversal signal.
1H Bearish Harami below 44,950 → Confirms selling pressure.
Gann Intraday Squaring:
Time Cycle: 14:00–16:00 UTC+4 (NY open) for volatility surge.
Price Harmony: Close below 44,900 targets 44,800 → 44,700.
Intraday Trade Plan:
Sell below 44,900 → Target 44,800 (VWAP) → 44,700 (Gann support).
Buy above 45,050 only if RSI <65 → Target 45,150.
Stop-Loss: 40–50 points.
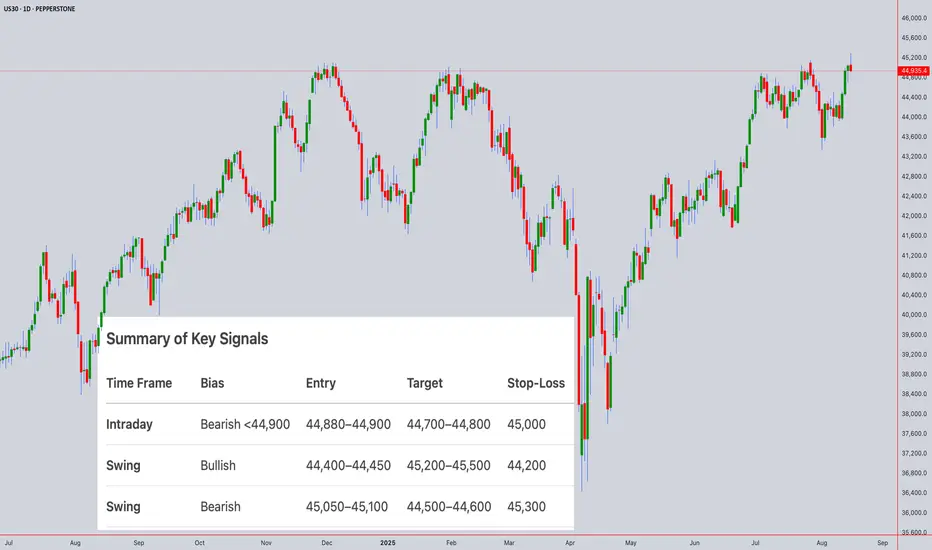
Summary of Key Signals
Time Frame Bias Entry Target Stop-Loss
Intraday Bearish <44,900 44,880–44,900 44,700–44,800 45,000
Swing Bullish 44,400–44,450 45,200–45,500 44,200
Swing Bearish 45,050–45,100 44,500–44,600 45,300
Critical Events:
Gann Reversal Window: Aug 19–22 (watch for Fed minutes/retail data).
Daily Close >45,200 invalidates bearish patterns and targets 45,796.
Risk Note: US30 is sensitive to Dow components’ earnings and USD moves. Use tight stops during NY session.
For those interested in further developing their trading skills based on these types of analyses, consider exploring the mentoring program offered by Shunya dot Trade.(world wide web shunya dot trade)
I welcome your feedback on this analysis, as it will inform and enhance my future work.
Regards,
Shunya.Trade
world wide web shunya dot trade
⚠️ Disclaimer: This post is educational content and does not constitute investment advice, financial advice, or trading recommendations. The views expressed here are based on technical analysis and are shared solely for informational purposes. The stock market is subject to risks, including capital loss, and readers should exercise due diligence before investing. We do not take responsibility for decisions made based on this content. Consult a certified financial advisor for personalized guidance.