US30Waiting on price to retest support, filling the spike just below current price and tapping new zone created below the spike to go long #Ib_Firm.
US30 trade ideas


US 30 short - swing trade Taken a nice swing short on US 30
Entry 38810
TP 38777
SL 38828
Entered on on the 15min inverted FVG after a bit of drawdown as we went back into the 5min imbalance (red box) trapping the bulls before heading towards the 30min buyside liquidity sitting around 38777
As long as we do not close back above 38777 expect some further pa to the downside
Stay safe and never risk more than 1-5% your capital per trade. The following analysis is merely a price action based analysis and does not constitute financial advice in any form.

CHART BREAKDOWN US30: Key Levels, Targets and Thoughts!Brief Description🖊️:
The chart provides insights into critical market levels, emphasizing an essential supply zone (low-risk sell zone) spanning from 39.030 to 39.130. Additionally, one low-risk buy zone between 38.160-18.100, respectively, is highlighted.
Things I Have Seen👀:
Important Supply Zone🟢: Identified between 39.030 to 39.130, serving as a low-risk sell.
Important Demand Zone🟢: Identified between 38.160-18.100, serving as a low-risk buy.
Bullish Targets📈:
38.300: Possible retracement area.
38.550: Possible retracement area.
38.800: Possible retracement area.
39.030: Significant supply zone.
Ultimate Target: 39.130- Liquidity area.
Bearish Targets📉:
38.900: Possible retracement area.
38.730: Possible retracement area.
38.480: Possible retracement area.
38.160: Essential Demand Zone
Ultimate Target: 38.050- Laying Low Liquidity
What's Important Now❗
Currently, the crucial approach is to wait and observe the price action at this level. We need to assess how the market reacts before considering any decisive moves. Stay observant and responsive to real-time developments in the market.

US 30 long - scalp trade Taken a long scalp on US 30.
Entry 38744
TP 38780
SL 38728
Entered based on the 5min breaker (blue box) targeting the obvious buyside liquidity.
I've noted the current buyside liquidity of the daily range (red line) with the sellside liquidity resting around 38560....so let's see how we play it.
Stay safe and never risk more than 1-5% of your capital per trade. The following analysis is merely a price action based analysis and does not constitute financial advice in any form.
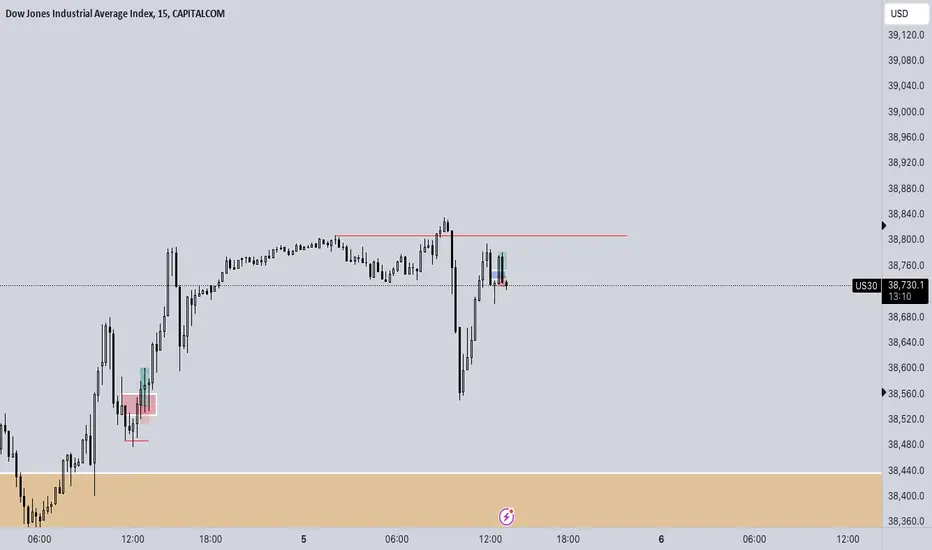

CHART BREAKDOWN US30: Key Levels, Targets and Thoughts!Brief Description🖊️:
The chart provides insights into critical market levels, emphasizing an essential supply zone (medium-risk sell zone) spanning from 39000 to 39140, respectively, are highlighted.
Things I Have Seen👀:
Medium-Risk Sell Zone🟠: Noted between 39000 and 39140, suggesting another area with moderate risk for potential selling positions.
Bearish Targets📉:
40000: Possible retracement area.
39900: Possible retracement area.
39800: Area with laying low liquidity.
Ultimate Target: 39600- Essential Demand Zone
What's Important Now❗
Currently, the crucial approach is to wait and observe the price action at this level. We need to assess how the market reacts before considering any decisive moves. Stay observant and responsive to real-time developments in the market.

US30 ( ADP _ ISM )US30
Tendency the price is a long pressure in between 38,680 and 38,560
Turning level : The turning level between 38,680 and 38,560 so as long as the price above this level, there will be a bullish trend
resistance level : trade above turning level between 38,680 and 38,560 , the price will rise to 39,015 and 39,185
support level : braking a turning level 38,560, the price will reach the support level of 38,280
and 37,940
corrective level : price will attempt between 38,680 and 38,560 , correct itself before long

US 30 Summer Rally Trade PlanAh, the sweet smell of summer! 🌞 While everyone else is hitting the beach, we're hitting the charts. The US 30 has dipped into a Daily and H4 Demand zone, teasing us with a lovely ChocH on the H2 Time frame. 📉 But don't fret! The low of 37,699.8 is our rock-solid structural low. If it gets taken out, we might have to rethink things, but for now, it's looking like a prime time for a summer rally! 🌴
Plan A: The Summer Sizzle ☀️
Buy from 38,187.5 and target 39,000! 🏁
We're betting on the sunny side of the street. If the price hits 38,187.5, we're jumping in with both feet and riding that wave all the way to 39,000. 🏄♂️
Plan B: The Backup Plan 📝
If the price doesn't cooperate and our buy limit doesn't trigger, we'll hang tight. Wait for a break in structure at this point, and we'll update our trade plan accordingly. Flexibility is key! 🧘♂️
Ultimately, we're looking to build on longs here to take out the highs. 📈
The Short Game: Not Just Yet! ⏳
Shorts on the US 30? We'll pass for now. 😅 Indexes aren't our favorite thing to short, especially with the summer vibes in the air. We're holding off until November. After this upside move, we'll get in long for the Santa Claus Rally. 🎅
So, pack your trading gear and let's make this summer one to remember! 🌞📊

US30 Bull now Hey there on 1hTF the US30 looking for further
Bullish movement from downside and cross support level to
Resistance level

possibility of uptrend It is expected that the continuation of the upward trend will be formed up to the specified resistance range. Then, according to the indicator's behavior in this range, the continuation of the movement process will be according to the specified paths

Dow Jones Yearly TemplateLast year in 2023, price was bouncing around the yearly candle's open and eventually blasted higher to form a bull expansion candle. The high to low of the entire year was 6,360 ticks and 20.24%. From the open of the year to the close, it was 4,566 ticks and a 13.77% gain.
This year in 2024, now that it is about half way through the yearly candle, is looking like a doji.
The range so far is small with only 2,978 ticks high to low. Only 8% from the low to high.
I have no clue what the rest of the year will bring. I am only looking at what it is doing in front of me.
There is really only three 2024 candles that can happen.
1. Buy low at the bottom of the yearly range under the teal blue 2024 Open price for a bullish run back up to the high for another bull expansion candle. (Bullish Expansion Candle)
2. Sell near the top of the range and hope the candle turns into a (bearish candle)
3. Play the ranges on both sides and the year goes sideways for a (small doji candle)
Usually after a big bullish expansion candle that we had in 2023, probabilities should say that we get more continuation or a bit of a rest as in a doji candle. I don't really see a bearish candle forming as of yet.

Upward trendThe trend has increased and good entry points can be obtained on this trend line, the previous ceiling can also be the destination

US30 - MON 3 JUNE 24 - TRADE SETUPPrice manipulation to the downside.
The market is likely to deliver to the upside.
Business Data


US30 Range breakout
Order type : instant
Entry : 38209.34
SL : 38021.56
TP1 : 38413.82
TP2 : 38601.60
TP3 : open

US30 longMonthly;
We had a monthly candlestick closure that is very indecisive and we cannot tell if price is headed upwards or downwards
Weekly;
The previous week's candlestick closed above 38,500 which is a major liquidity region
The next major region is 39,100 (which is also the daily region)
There is also a head and shoulders formation which indicates that price is headed upwards
Daily;
From a daily perspective, I expect price to continue going upwards.
However, there is a chance of seeing a retest of 38620, which is a major region of support.
Price may test 38620 before going upwards so as to collect orders.
Since there is no sign of retracement, I just have to sit on my hands and wait.
4 hour;
38,715 is such a massive region where orders are collected.
For now I am sitting on my hands as I wait for price to fully show me what is happening.

my options about us30My opinion about us30 in that zone you can see lt and it can be bearish zone hopefully you get profits

BullishPrepare for higher highs.Dont mess this up.
HH and HL it's that simple, risk very little and keep the larger picture in mind.

Big Movements to the upside.After a bearish landslide of a week, DJ will be looking to correct itself. Expect the bulls to make a massive upclimb. Especially after the PDH has been crushed. I keep it simple, block out the noice. Trade my zones and watch the movement explore. Peace traders $

US30 BULLISH CONFIRMATION!!The bullish strength formerly develop is currently active as price trades at $38,153 level. A buy opportunity is envisaged from the current market price .
Target is 38,491


DOW JONES (US30) LONGS NOT BAD IDEADuring the uncertainty and risk off environment, low GDP data didn't come unnoticed and big boys accumulated some equities after the huge Salesforce panic.
Today, with NASDAQ loosing almost 2% and 0.7% for SP500, DJ was accumulated, so I think we might see nice and strong reversal for the end of the week and month close.
Play safe and good luck!
