US100: Ready To Start a Downward Move?US100: Ready To Start a Downward Move?
A few days ago I posted an bullish forecast for US100.
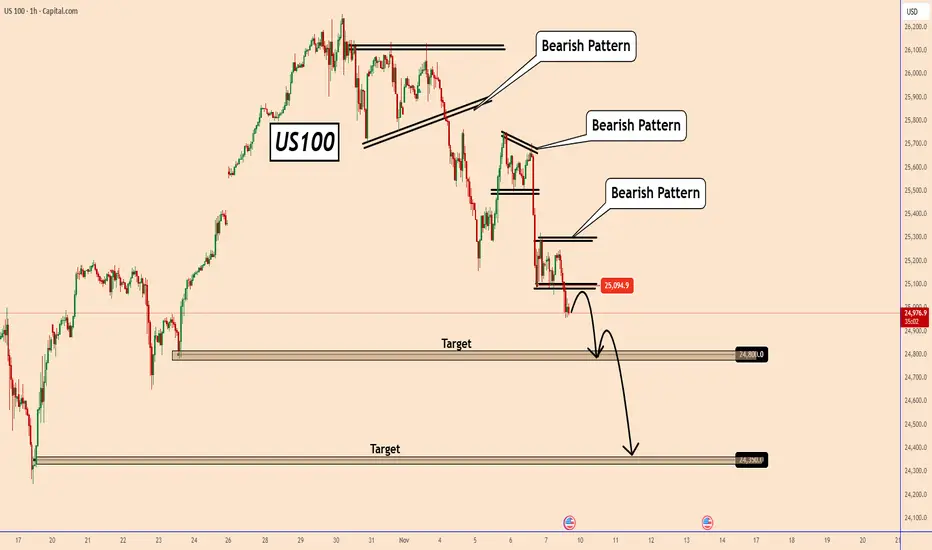
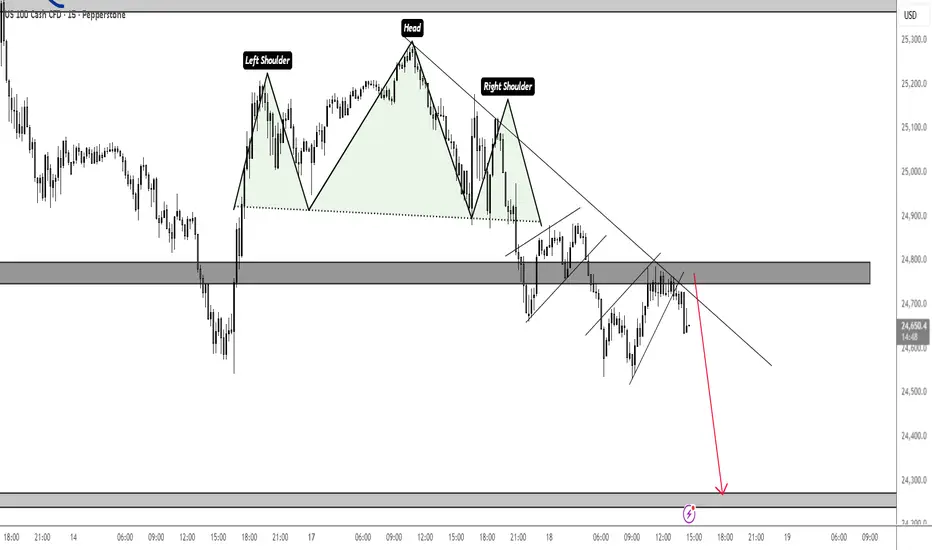
US100 couldn't manage to break above the triangle pattern, and the price turned bearish.
Currently, we can see several bearish patterns one after the other. This sell-off started yesterday and may continue further in the coming days.
It could be related to earnings reports, AI bubble fears, etc. However, all indices were also heavily overvalued.
If the price respects this new bearish structure, we could see US100 falling to 24800 and 24350 first.
I will keep you all updated.
You may find more details in the chart!
Thank you and Good Luck!
❤️PS: Please support with a like or comment if you find this analysis useful for your trading day❤️
Trade ideas
Tech Sector Pauses|USNAS100 Awaits Direction Between 25430–25700USNAS100 | Overview
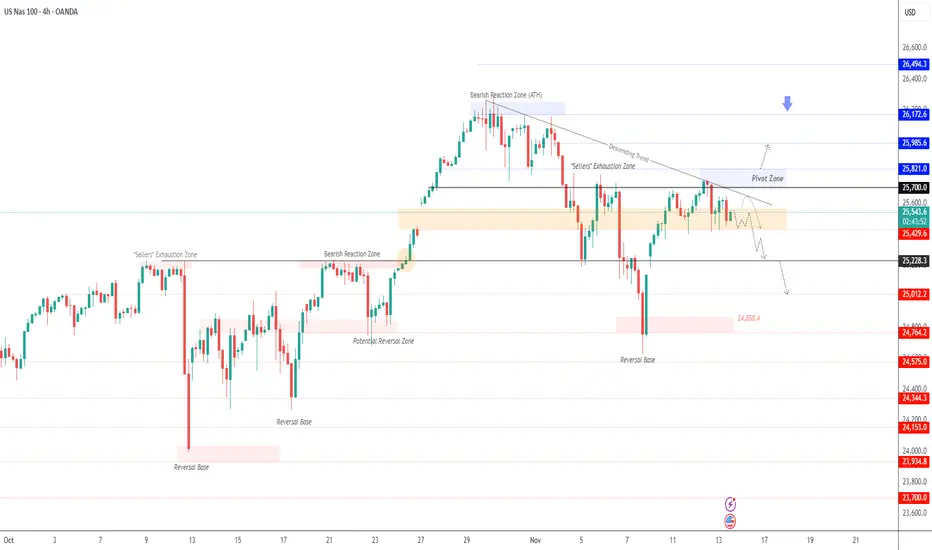
The price is currently consolidating between 25430 and 25570, showing a slight bearish bias as momentum weakens near resistance.
As long as the index trades below 25570 and 25700, the outlook remains bearish, with downside potential toward 25430 and 25220.
A confirmed break below 25220 would accelerate losses toward 25010.
However, if the price closes a 4H candle above 25700, it would signal a bullish reversal, opening the path toward 25820 and 25985.
Pivot Line: 25570
Resistance: 25700 · 25820 · 25985
Support: 25430 · 25230 · 25010
NASDAQ-100 (USTEC) | Elevated risks arise Sentiment:
- Extreme Fear in the market (F&G = 23)
- Investors are bearish (49% bearish vs 37% bullish)
- Volatility elevated but not extreme (VIX 20)
- Higher Put activity and an elevated put/call ratio (1.11)
- Hedge funds unwinding crowded AI longs (50% market cap concentration)
- Record institutional options activity positioning for Q4 2025-Q1 2027
- COT report: No latest data due to the US government shutdown
Interpretation:
- Put hedge elevated = cautious as institutional hedging and distributing stocks to retail
- Extreme Fear + High Bearishness = Potential buying opportunity (later stage)
- When sentiment is this negative, often near bottoms
Fundamental:
- Valuation Concerns:
- 24-25x Forward P/E - vs 20-22 for 5-year average
- 3.08-3.37x P/S ratio - 2.35-2.41 for 5-year average
- Dec Fed cut probability is declining
Technical:
- USTEC broke the ascending trendline and EMA21, indicating potential mean reversion to EMA78, which is just above the support cluster at around 24000.
- Breaking below 24000 may prompt a decline to the following support cluster at around 23000, which is a prominent zone for sentiment contrarians step into the market if market fear remains at an extreme level.
My take on this:
- The distributing process may last for a while before reaching more extreme panic sentiment, prompting consideration of a contrarian approach based on technical levels.
- Therefore, we need to watch the price action to determine the best entry setup for the Long position. Then, for now, short-term pressure is the better take.
Analysis by: Dat Tong, Senior Financial Markets Strategist at Exness

US 100 Index – NVIDIA Earnings and September Payrolls To Keep TrNovember has been a choppy and volatile period for the US 100 index. After opening the month with a push to a high of 26154 on November 1st concerns about lofty valuations of AI companies, more hawkish than expected Federal Reserve speakers and a US government shutdown have all combined to weaken prices which has seen the index twice dip and recover from support at 24608 (more on this in technical update below).
Now looking forward, sentiment towards technology stocks is going to face potentially its toughest test so far with the release of AI bellwether NVIDIA’s earnings after the close on Wednesday, which is closely followed by the delayed September US Non-farm Payrolls report on Thursday.
Expectations for NVIDIA’s results are high, with Reuters reporting analysts on average expecting the company to post a 54% year-on-year rise in Q3 earnings per share, with optimism for future revenue being driven higher by recent chip supply deals the company has announced with a string of companies such as Samsung. NVIDIA carries a huge 10% weighing in the US 100 index so these results could have a big impact on the direction of prices into the weekend, perhaps even further.
The reopening of the US federal government last Thursday has restarted the release of key economic data updates on the labour market and inflation. The Bureau of Labor Statistics (BLS) has confirmed the September Non-farm payrolls report, originally due in early October, will now be released on Thursday November 20th at 1330 GMT. This update could be important for traders as they try and work out whether the US labour market has weakened enough for Federal Reserve policymakers to be swayed to cut interest rates by 25bps (0.25%) again at their final meeting of the year on December 10th. Recent commentary from Fed speakers has been more hawkish than expected by markets only a month ago, so there may be an extra level of US 100 price sensitivity to the outcome of this release on Thursday.
US 100 Index Technical Update: 24608 Support Holds Again
Last week’s US 100 activity began with price strength on Monday, but this quickly reversed, seeing a retreat of nearly 5% into Friday’s low at (24542, November 14th). Importantly, that decline tested support at 24608, which is the 50% Fibonacci retracement of the August to October advance. This level holding last week maintains potential for prices to stabilise to begin the new week.
Interestingly, a similar rally emerged the previous Friday (November 7th) following tests of the same 24608 retracement support, reinforcing the possibility that buyers are currently still active around this area. While not a guarantee of future price strength, with this level now limiting selling pressure on 2 occasions, this may be viewed as the first important support level for traders to focus on this week.
Potential Support Levels:
With 24608 established as a potential support, closing breaks below this level might be needed to suggest renewed downside pressure, leading to a further phase of price weakness.
A close below 24608 if seen, could then turn the focus toward 24221, which is the deeper 61.8% Fibonacci retracement, with the possibility for extension of price declines to 24004, which is the October 10th session low, increasing if this 24221 support level were to give way.
Potential Resistance Levels:
If 24608 continues to hold selling pressure, fresh attempts at price strength might result. However, it could prove to be the still rising Bollinger mid‑average at 25490 that marks an initial resistance level, with a close above this level needed to suggest risks for the possibility of fresh upside momentum.
If the 25490 mid‑average does give way to the upside on a closing basis, renewed price strength could be the result. Such moves may then open scope for tests of 25742, the November 12th session high, and possibly toward 26277, the October 30th all‑time high.
The material provided here has not been prepared accordance with legal requirements designed to promote the independence of investment research and as such is considered to be a marketing communication. Whilst it is not subject to any prohibition on dealing ahead of the dissemination of investment research, we will not seek to take any advantage before providing it to our clients.
Pepperstone doesn’t represent that the material provided here is accurate, current or complete, and therefore shouldn’t be relied upon as such. The information, whether from a third party or not, isn’t to be considered as a recommendation; or an offer to buy or sell; or the solicitation of an offer to buy or sell any security, financial product or instrument; or to participate in any particular trading strategy. It does not take into account readers’ financial situation or investment objectives. We advise any readers of this content to seek their own advice. Without the approval of Pepperstone, reproduction or redistribution of this information isn’t permitted.

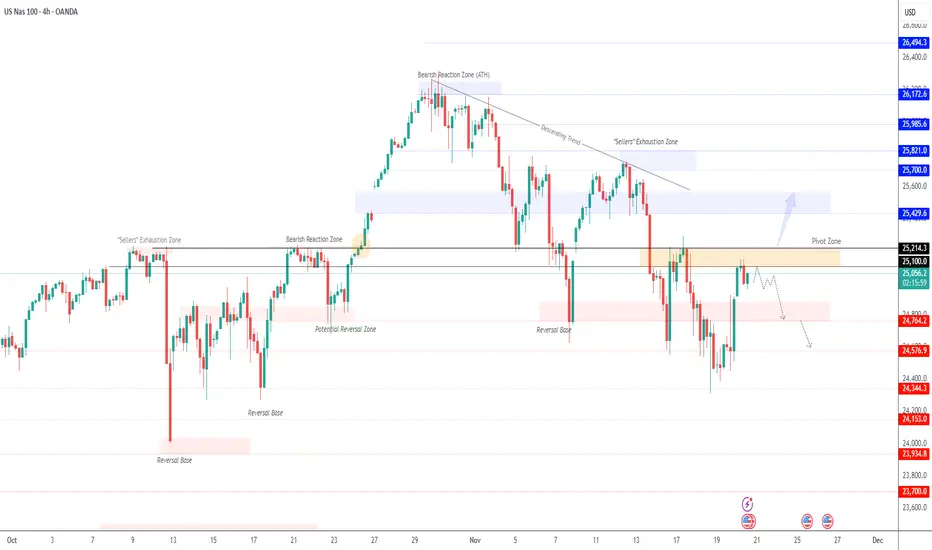
USNAS100 –Key Breakout Levels | Bearish Below 25100 Ahead of NFPUSNAS100 | OVERVIEW
NASDAQ futures surged as Nvidia’s strong earnings eased concerns of an AI-driven market bubble, boosting overall tech sentiment.
Markets are now shifting attention to the NFP and U.S. jobs report, with expectations of elevated volatility throughout the NY session, especially given Nvidia’s strong influence on tech stocks.
Technically:
Below 25100: Bearish continuation toward 24880 → 24760 → 24350
Above 25215: Bullish breakout toward 25430 → 25650 → 25700
Pivot: 25100
Support: 24880 · 24760 · 24350
Resistance: 25220 · 25430 · 25650
USNAS100 stays bearish under 25100; only a confirmed close above 25215 will signal bullish continuation.
NASDAQDO YOU KNOW WHATS BEHIND THIS OR OTHER IDEAS?? in bio..
Preferably suitable for scalping and accurate as long as you watch carefully the price action with the drawn areas.
With your likes and comments, you give me enough energy to provide the best analysis on an ongoing basis.
And if you needed any analysis that was not on the page, you can ask me with a comment or a personal message.
Enjoy Trading ;)

US100 LOCAL SHORT|
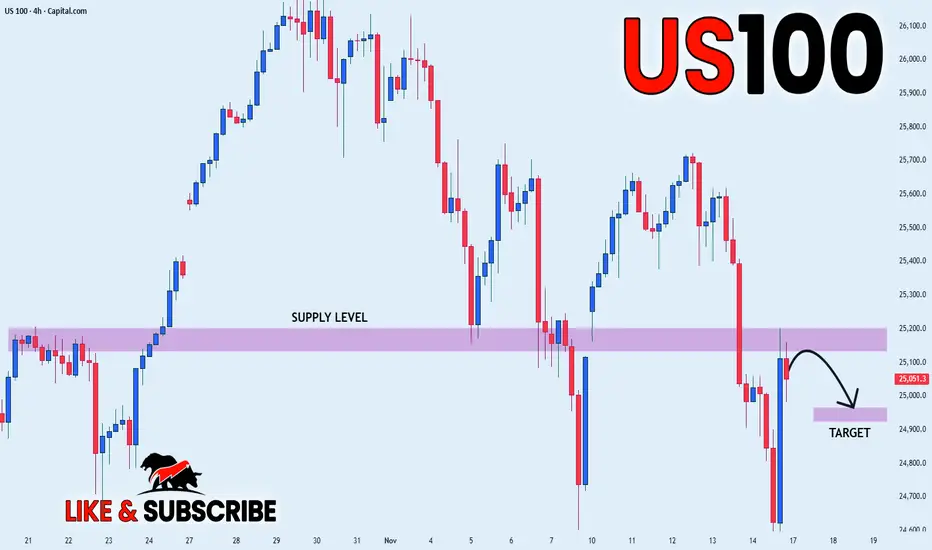
✅US100 price rejects the supply block and forms a clean displacement lower, hinting at a draw on liquidity toward the inefficiency below. A corrective retrace before targeting the marked zone is likely. Time Frame 4H.
SHORT🔥
✅Like and subscribe to never miss a new idea!✅
NDX today is the day.🚀 Today is the day that marks a before and after. ⚡️🔥
We haven’t even tasted true tech-sector FOMO yet — not even close.
Right now we’re sitting in the same extreme fear zone we saw back in early April…
and you know exactly what happened next. 😉
Google is leading the charge, showing the path the entire index is meant to follow.
And tonight, NVIDIA provides the fuel ⛽🔥
The rest of the market will move to its rhythm — like an orchestra waiting for the conductor.
Make no mistake:
🎄🚀 A massive Christmas rally is coming.
The kind that leaves you speechless.
The kind people remember for years.
The kind that turns disbelief into FOMO… and FOMO into vertical candles.
Buckle up.
The real move is just beginning. 😉
🔥🚀📈
#TechRally #NVIDIA #GoogleLeading #FearToFOMO #SantaRally #MarketShift #NextLegUp

Daq buyWhat is up ma friends? Happy Government reopen! Price flushed straight into a demand pocket after a steady selloff. The long triggers right as the candle sweeps the previous lows and snaps back. classic liquidity grab followed by an immediate reclaim.

NAS100 Trade Set Up Nov 18 2025Price is still showing bearish pressure making LL/LH in the 1h and 15m but first id like to see BSL swept followed by IFVG/CISD on the 1m-5m before looking for sells back down to lower SSL levels

NAS100 Trade Set Up Nov 19 2025Price is still overall bearish on the 4h and daily but price just broke structure on the 1h so i would want to see a sweep of SSL, close above and internal IFVG/CISD to target PDH/BSL

SIGNS OF WEAKNESS ON NASNAS100 1H - This pair is showing signs of weakness, it looks as though price is respecting these areas of Supply and is continuing to trade us lower. We have also been delivered with a higher timeframe break to the downside.
This is indicating further bearishness in this market, I would personally be looking for short temporarily with this pair, as you can see price is approaching an area of Supply now, this could act as an entry point.
We need to wait for price to trade in, clear this area and give us some kind of entry confirmation before getting involved. We would need to see price break structure to the downside before taking us lower.
I have set an alert and will keep you all updated on whether or not I vet a valid short entry for this pair moving forward, its important we treat this pair with caution.

Long Opportunity on NAS100Any thought on this NAS100 setup? The double bottom was formed on 1hr timeframe and broke the neckline. Looking for the long opportunity after any confirmation of this retest at the neckline

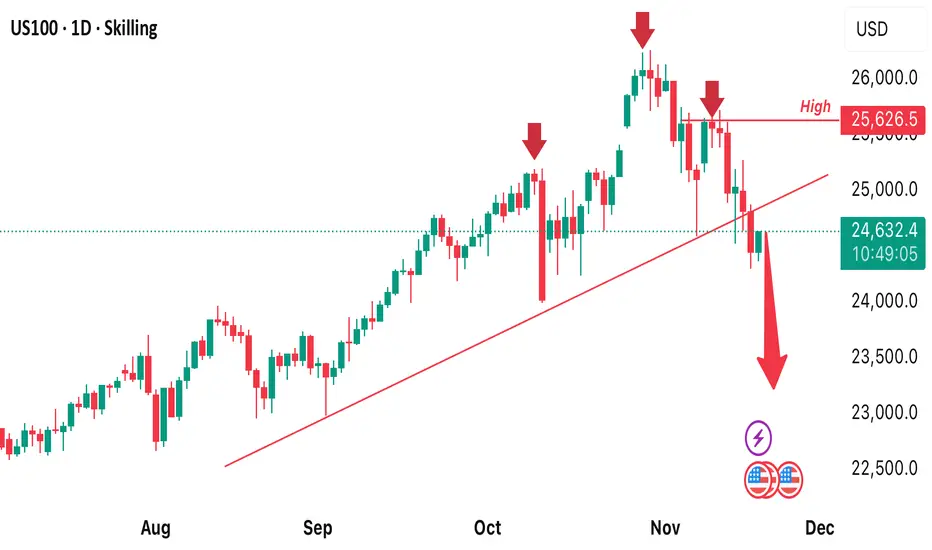
US100 DAILY CHARTNASDAQ100 has a tendency to make a new low. We can see how price has been bearish for couple of days now. I expect price to drop lower therefore, a sell opportunity is envisaged
Nasdaq Slips as Traders Brace for Nvidia EarningsUSNAS100 | Overview
Traders remain firmly in risk-off mode as concerns grow over stretched AI and tech valuations ahead of Nvidia’s earnings, set for release after tomorrow’s market close.
Nvidia shares are already down about 1% in premarket trading, reflecting cautious sentiment across the tech sector.
At the same time, investors are watching for the resumption of key U.S. economic data, including the jobs report due Thursday, after recent shutdown-related delays.
There is growing worry that incoming data may discourage the Fed from delivering further rate cuts, adding pressure to equity markets.
Technically:
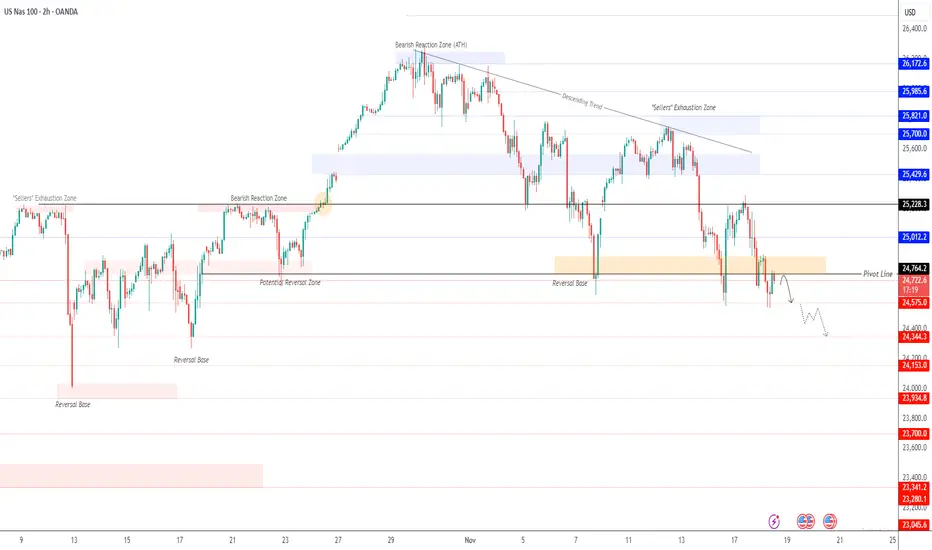
USNAS100 continues to trade under bearish pressure, and as long as the price remains below 24760, the downtrend is expected to continue toward 24575.
A break below 24575 would open the next bearish targets at 24340 and 24150.
To shift into bullish movement, the index must close a 1H candle above 24880, which would signal a rebound toward 25010 and 25230.
Key Levels
Pivot Line: 24760
Support: 24575 · 24340 · 24150
Resistance: 24880 · 25010 · 25230
NAS 2 MOON ?Ok so i made my oblivion call
where i expect incomprehensible shorting wothon the us stock market however i see one last impulse cooking up might react at the red levels and tank there before it goes my way idk but my bias is bullish and $27295 is my target
weekly timeframe keeps making higher highs if it breaks structure well game over

Smart Money Positioning on US100 – Liquidity Flow ExplainedRepeated failed highs, deep liquidity sweeps, and a tightly trapped range — the US100 is showing textbook smart money behavior.
Let’s decode how liquidity pockets, fake breakouts, and institutional accumulation are shaping the next 600+ point move.
🧭 Market Story – Where We Are Now
The US100 has been in a broad liquidity cycle after a strong rally.
Price is consolidating within a re-accumulation or distribution phase, hinting that smart money is positioning quietly before expansion.
🔹 Key Liquidity Zones
🟩 Breakout Level – 25,600
The make-or-break point.
Holding above 25,600 = bullish continuation potential.
Losing it = likely sweep back into liquidity below.
🔵 Liquidity Pocket – 26,150 → 26,350
This zone is loaded with stop liquidity.
Multiple failed breakouts = engineered liquidity traps.
A decisive breakout with volume could unleash a sharp institutional expansion toward 26,600–26,800.
🔴 Weekly Low Zone – 24,660 → 24,610
Where the market performed a major liquidity sweep before reversing.
Strong reaction = signs of accumulation.
A revisit here could form the final liquidity grab before the next rally.
🧩 Structure Breakdown
Sweep of Lows → Reaction — liquidity collected below prior swing lows.
Box Phase → Accumulation or Distribution — institutions building orders.
Trendline Rejections → Liquidity Creation — every “failed attempt” tells a story.
Compression Phase → Expansion Loading — pressure building before the breakout.
⚖️ Possible Scenarios
🚀 Bullish Breakout
Price holds above 25,600
Clean break above 26,150–26,350 liquidity pocket
Expansion move likely toward 26,600–26,800
🩸 Bearish Liquidity Trap
Rejection from 25,600 → 24,823 / 24,660 zone
Final liquidity sweep before strong reversal
Watch for aggressive bullish recovery candles
💡 Institutional Insight
Each failed breakout isn’t weakness — it’s intent.
Smart money builds liquidity where retail enters wrong.
When both sides’ liquidity is consumed, true direction begins.
👉 Liquidity is not just a zone — it’s market psychology visualized.
🧠 Educational Takeaway
The US100 demonstrates the full liquidity cycle at work:
Sweep → Trap → Accumulate → Expand.
Every fakeout clears inefficiency and builds the fuel for the next impulse.
Don’t chase — track where liquidity builds and follow the flow.
📊 Final Thoughts
The index is coiling between 25,600 and 26,350 — volatility is loading.
Above → Expansion Phase (trend continuation)
Below → Liquidity Sweep Phase (bullish trap setup)
Patience > Prediction.
Let the liquidity tell the truth — not emotions.
💬 Your Turn:
Do you expect a clean breakout or another trap before lift-off?
Share your bias below — let’s discuss how liquidity might play it out!


NSDQ100 key trading levelsKey Support and Resistance Levels
Resistance Level 1: 25180
Resistance Level 2: 25300
Resistance Level 3: 25500
Support Level 1: 24655
Support Level 2: 24490
Support Level 3: 24330
This communication is for informational purposes only and should not be viewed as any form of recommendation as to a particular course of action or as investment advice. It is not intended as an offer or solicitation for the purchase or sale of any financial instrument or as an official confirmation of any transaction. Opinions, estimates and assumptions expressed herein are made as of the date of this communication and are subject to change without notice. This communication has been prepared based upon information, including market prices, data and other information, believed to be reliable; however, Trade Nation does not warrant its completeness or accuracy. All market prices and market data contained in or attached to this communication are indicative and subject to change without notice.

NASDAQ 100 Buy Bias 18/11/2025.
Price is currently trading on the Previous Week Lows, 240 TF low, and Daily Low.
With rejection on the hourly timeframe, break of structure on the 15M and equal lows we can anticipate for a buy.

NASDAQ NASDAQ can start a bullish move from the price zones of 24,767 or 24,682 toward 25,200. However, the 24,530 level is highly critical. NASDAQ:NDX

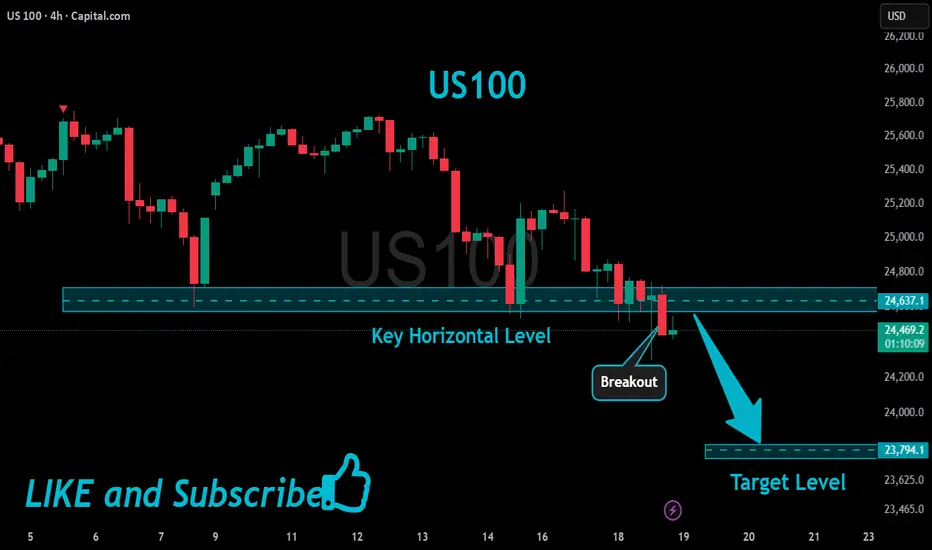
US100 Will Keep Falling!
HI,Traders !
#US100 keeps falling down
And made a strong
Bearish breakout of the key
Horizontal key level of 24637.1
And the breakout is confirmed
So we are bearish biased and
We will be expecting a further
Bearish move down !
Comment and subscribe to help us grow !